Analyses of reactor building by 3D nonlinear FEM models considering basemat uplift
for simultaneous horizontal and vertical ground motions
Naoto Yabushita1), Naohiro Nakamura 1), Takuya Suzuki 1), Jun Yamada 2), Naohiko Tsunashima 2) and Tomio Nakano 3)
1) Takenaka Corporation, Tokyo, Japan 2) Kansai Electric Power Co., Inc., Japan 3) NEWJEC Inc., Osaka, Japan
ABSTRACT
The nonlinear behavior of basemat uplift, which is an important point in seismic designs of nuclear power plants in Japan, has been investigated by arranging joint elements between the reactor building basemat and the soil on a 3 dimensional (hereafter referred to as 3D) FEM model of the soil. However, the nonlinearity of the basemat uplift has been investigated separately from the nonlinearity of reactor buildings, and these nonlinearities have yet to be taken into account simultaneously. In this paper, models of the building and the soil made using 3D FEM elements with consideration to the nonlinearity of building materials as well as the nonlinearity of the basemat uplift were subjected. The behavior of the building’s elements were investigated by carrying out seismic response analyses for horizontal ground motions only, as well as for simultaneous horizontal and vertical ground motions using these models. As a result, it was found that there was little difference in the horizontal response of the building between the horizontal input motions only and the simultaneous horizontal and vertical input motions. The effects of the vertical ground motions on the basemat uplift behavior which is represented by the ground contact ratio were also slight.
1. INTRODUCTION
In seismic designs of nuclear power plants in Japan, the sufficient safety margin of reactor buildings for severe earthquakes is confirmed by response analyses using a lumped mass model with sway & rocking (hereafter referred to as SR) soil springs shown in Fig. 1 (a).
The seismic safety level for horizontal input motions had been evaluated with seismic response analysis results and that for vertical input motions had been evaluated by static seismic forces. However, the Guideline for Seismic Design Evaluation of Nuclear Power Reactor Facilities 1) was revised in 2006. The evaluation method for vertical input was changed to the method based on the seismic response analysis results, too.
In order to accurately evaluate the behavior of reactor buildings during a severe earthquake, dynamic nonlinear analyses using 3D FEM models can be taken into account because the real shapes of the buildings are complicated (see Fig. 1 (b)).
The authors have been estimating the seismic safety margins of PWR 3 LOOP type nuclear reactor buildings through carrying out dynamic nonlinear analyses for horizontal ground motions using a detailed 3D FEM2). Furthermore, the progress of the damage to the building was evaluated by increasing the input level in order to compare it with the behavior of the SR model, which is a typical design model. In particular, it was confirmed that the energy absorption capacity of the SR model becomes less than that of the FEM model in the strong nonlinear domain because of the peak-oriented hysteresis rule3) used in the SR model to evaluate the nonlinear effect of shear walls4). However, the effects of basemat uplift were not considered in this study.
(a) SR Models (b) 3D FEM Model Fig. 1 Analytical Model
300m 150m
90m
CL
300m 150m
90m
CLCL Direction of Vibration
Nakamura et al.5) showed a method to accurately estimate the uplift behavior using a 3D FEM soil model made with solid elements and properly arranging joint elements between the basemat and the soil. It was confirmed that the time history waves of the ground contact ratio and the induced vertical motion (the vertical motion induced by the basemat uplift) calculated by the model corresponds well to those obtained by the theoretical solution method (the Green function method). However, neither effects of 3D shape nor the nonlinearity of the building were investigated because the linear lumped mass model was used for the building in the investigations. Moreover, although the SR soil springs in most of the lumped mass models are calculated by the assumption considering the flexibility of the basemat, the basemat was assumed as a rigid body for the calculation of the basemat uplift in this study.
In this paper, the response behavior of the building during a severe earthquake is estimated using a detailed model which can accurately indicate the basemat uplift behavior of the building as well as its 3D shape and nonlinearity. As for actual buildings, horizontal and vertical ground motions are simultaneously input. However, in the current study using a lumped mass model, analyses for horizontal ground motions and those for vertical ground motions are carried out separately.
This paper estimates the effects of vertical ground motions input with regard to the following two points by comparing the response of the nonlinear 3D FEM model in the case of horizontal ground motions only being input (hereafter referred to as the case H) and in the case of horizontal and vertical ground motions being simultaneously input (hereafter referred to as the case H+V).
i) Comparison in the behavior of the horizontal response which is an important response of the building ii) Comparison in the basemat uplift behavior
2. INVESTIGATION OUTLINE
The 3D analysis model which is used in this study has the following features. i) The nonlinearity of building materials is taken into account.
ii) The soil part is made with consideration to the frequency properties of the soil.
iii) Joint elements are arranged between the building basemat and the soil in order to evaluate the nonlinearity of the basemat uplift.
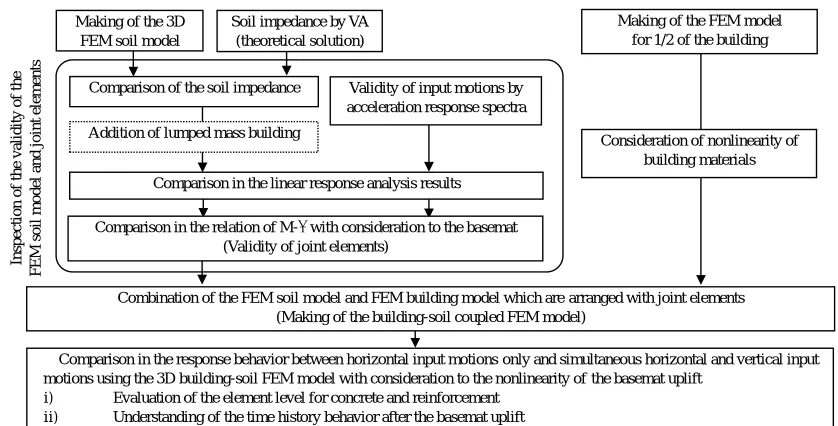
In order to carry out accurate response analyses for a 3D FEM soil model, specifications of the soil model and the joint elements need to be properly established. Based on reference 5, the investigation procedure proceeding from the confirmation of the accuracy of the soil model through the response analysis of the building is shown in Fig. 2.
First, the validity for modeling the element size and boundary condition should be inspected by comparison with the soil impedance based on the vibrational admittance theory. Next, the results obtained from the response analyses carried out for the combination of the FEM soil model and the lumped mass building model are compared with the response analysis results of the SR model. Moreover, in order to verify the behavior after the basemat uplift, the relation of M-θ is obtained using the model which is arranged with joint elements between the FEM soil model and the rigid massless basemat, and this M- θ relation is compared with the behavior of the SR model after its basemat uplift. After inspecting the validity for modeling the soil and joint elements according to the aforementioned procedure, a building-soil coupled FEM model combined with a model under consideration of the nonlinearity of materials corresponding to 1/2 of the building is made. Then, 3D building-soil FEM response analyses are carried out with consideration to the nonlinearity of the basemat uplift.
Fig. 2 Investigation procedure in the study Making of the 3D
FEM soil model
Comparison in the response behavior between horizontal input motions only and simultaneous horizontal and vertical input motions using the 3D building-soil FEM model with consideration to the nonlinearity of the basemat uplift
i) Evaluation of the element level for concrete and reinforcement
ii) Understanding of the time history behavior after the basemat uplift
Inspection of the validity of the
FEM soil
model a
nd joint elements
Combination of the FEM soil model and FEM building model which are arranged with joint elements (Making of the building-soil coupled FEM model)
Soil impedance by VA (theoretical solution)
Comparison in the linear response analysis results Comparison of the soil impedance
Addition of lumped mass building
Making of the FEM model for 1/2 of the building
Consideration of nonlinearity of building materials Validity of input motions by
acceleration response spectra
Comparison in the relation of M-θ with consideration to the basemat (Validity of joint elements)
3. ANALYSIS CONDITION
The PWR type nuclear reactor building (R/B) subjected to the investigation is a complex building composed of an outside shielding building (O/S), inner concrete (I/C), a fuel handling building (FH/B), an external building (E/B) and a nuclear reactor containing vessel (C/V). Table. 1 shows the composition of the reactor building. Table. 2 shows the main physical property values. The lumped mass model and the building-soil coupled FEM model are illustrated in Fig. 1.
3.1 Lumped Mass Model
The lumped mass model is made up by adding the axial stiffness and the vertical soil impedance of the building to the bending shear type SR model illustrated in Fig. 1 (a). The horizontal, vertical and rotational components for the soil impedance can be calculated using the vibrational admittance theory 6) (hereafter referred to as VA).The restoring force characteristics obtained from RC shear wall experiments are taken into account for the bending components and the shear components in a horizontal direction along the building. The restoring force characteristics in a vertical direction are set to be linear.
Table. 1 Composition of R/B Table. 2 Main physical property values Shear wave
velocity
Poisson’s
ratio Density --
Soil
2200(m/s) 0.33 2.7(t/m3
) -- Elastic modulus Poisson’s
ratio Density Maximum strain 22.8 (N/mm2
) 0.2 2.35 (t/m3
) ε0=2.5/1000 Compressive
strength
Tensile strength
First compressive turning point
Compressive ultimate strain Concrete
24.5 (N/mm2
) 1.58(N/mm2
) σc1=0.5 σc εu=10/1000 Young modulus Poisson’s ratio Density Yield strength Reinforcement and
structuralsteel
205.8 (N/mm2
) 0.3 8.0 (t/m3
) 343.2 (N/mm2
)
3.2 FEM nonlinear model (Building)
The 3D FEM model is a 1/2 sized model which is symmetric with respect to the parallel surfaces in a horizontal loading direction.The outline of the method for modeling the concrete and reinforcement used for the building part of the model is shown as below.For further details the reader should refer to references 5 and 7.
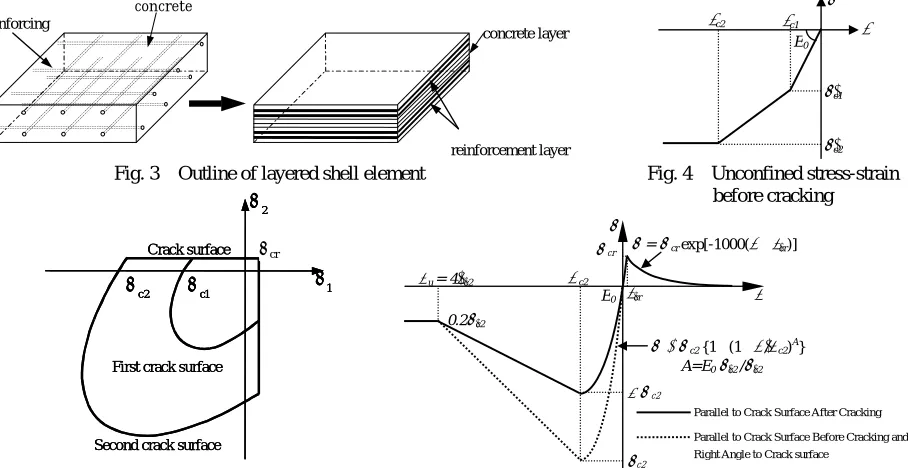
The RC wall is modeled using layered shell elements under consideration of the anti-plane bending (See Fig. 3). The nonlinearity of materials is taken into account for the in-plane stress-strain components and the out-plane shear component is dealt with as linearity.
The unconfined stress-strain relation of concrete before cracking was approximated with a polygonal line as shown in Fig. 4. As shown in Fig. 5, the concrete before the occurrence of cracks is an elasto-plastic body which conforms to the Drucker-Prager’s yield condition. The occurrence of cracks under the assumption of Smeared Crack is judged according to the main tensile stress.σcr in the figure indicates the amount of stress for the occurrence of cracks and the
corresponding strain is indicated as εcr. Cracks in the second direction occur at a right angle to the first direction.
Fig. 3 Outline of layered shell element Fig. 4 Unconfined stress-strain before cracking
Fig. 5 Crack and yield surface Fig. 6 Envelop curve of stress-strain of concrete Building Abbreviation Structure
Outside shielding building O/S RC
Inner concrete I/C RC
Fuel handling building
FH/B RC (Steel in part) External building E/B RC Containment vessel C/V Steel
reinforcement layer reinforcing
concrete layer
concrete
Crack surface
First crack surface
Second crack surface
2 σ
t σ
1 σ 2
c
σ σc1
Crack surface
First crack surface
Second crack surface
2
σ2
σ
t
σt
σ
1
σ1
σ 2
c
σc2
σ σσcc11
σcr
σ ε
εc2
σc2
σc1
E0
εc1
λ σ c2
E0
σ = σ c2{1− (1−ε /ε c2)
A
}
A=E0σc2 /σc2
σ= σ cr exp[-1000(ε − εcr)]
σc2
0.2σc2
ε c2
εcr
σ cr
σ
ε
ε u = 4εc2
Parallel to Crack Surface Before Cracking and Right Angle to Crack surface
Fig. 6 indicates the envelope curve of stress-strain of concrete. After the occurrence of cracks, both the strength and the stiffness of the concrete are reduced according to the increase in the strain ε in directions at a right angle to and parallel to the crack surface.Moreover, the compressive stiffness and compressive strength in the direction parallel to the crack surface is reduced by the coefficient λ, and the value of λ is set to be constant as 0.63.
The hysteresis curve for the stress in the case of cyclic loading was approximated using a hyperbola based on the results of investigations carried out by Stevens et al.8) and Karsan et al.9).In this case, the decrease in the stress caused by cyclic loading was considered with reference to the equation proposed by Yamada et al.10).
3.3 FEM model (Soil)
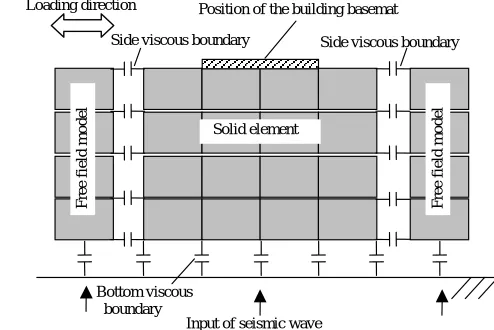
The soil part of the 3D FEM model is made by adding joint elements with extremely rigid compressive stiffness for vertical degrees of freedom and without any tensile stiffness to the FEM soil model made using solid elements in order to represent the uplift behavior of the building’s basemat5). Fig. 7 shows the nonlinear property of the joint element.
The boundary conditions of the FEM soil model are illustrated in Fig. 8. Both sides of the model are viscous boundaries which are connected to the free fields with the same physical properties located at the flanks. The bottom of the model is also a viscous boundary.
Fig. 7 Property of Joint Element Fig. 8 Boundary conditions of the FEM soil model
3.4 Analysis conditions
The duration time of the input ground motions is set at 80sec. The maximum acceleration in a horizontal direction is set at 500Gal and that in a vertical direction is set at 300Gal. The Newmark-β method (β=1/4) was used for the analyses of both the lumped mass model and the FEM model. As for the convergence calculation, the Newton-Raphson method was used. ∆t for the analyses was set at 0.002sec.
4. CONFIRMATION OF THE FEM SOIL MODEL
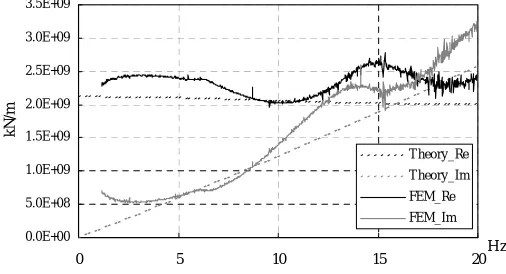
First, the horizontal, vertical and rotational impedance calculated using the FEM soil model were compared with the theoretical values obtained from the VA. Fig. 9 illustrates the comparison between the horizontal impedance for the basemat. The calculated impedance corresponds fairly well to the theoretical solution.
Next, seismic response analyses were carried out by inputting the seismic wave to the FEM soil model and the response wave which was output at the building basemat (the input motion to the building basemat) was compared with the target wave. The ratio of the response spectra AR/AT is defined as a ratio of the acceleration response spectra of the
response wave (AR) to the acceleration response spectra of the target wave (AT). Fig. 10 shows the ratio of the response
spectra AR/AT in horizontal and vertical directions respectively, and the ratio was nearly equal to 1.0. Therefore, it was
confirmed that the response wave for both horizontal and vertical ground motions corresponded quite well to the target wave.
Furthermore, linear response analyses were carried out by inputting ground motions to the 3D FEM soil model and to the lumped mass building model with a rigid basemat was added. Fig. 11 indicates the comparison between the response value of the lumped mass model with the soil impedance obtained from the FEM soil model and that of the lumped mass models with SR soil springs calculated by the VA. It was confirmed that both responses corresponded quite well to each other. It was also confirmed from this that the property of the FEM soil model in the case of linearity was satisfactory.
Moreover, after joint elements installed between the FEM soil model and the rigid massless basemat statically sank due to the building’s weight, the nonlinear characteristics of the uplift were calculated by static moment loading.
Fig. 12 illustrates the calculated M-θ (moment-rotation angle) relation. The calculated result corresponded well to the result obtained using the VA under the assumption of rigid basemat and the satisfactory nonlinear property of the uplift of the FEM soil model was confirmed
ε
Tension
σ
Compression
Input of seismic wave Bottom viscous
boundary
Free field model
Side viscous boundary
Position of the building basemat Loading direction
Solid element
Side viscous boundary
Free field model
Fig. 9 Comparison of horizontal impedance
(a) Horizontal (b) Vertical Fig. 10 Comparison of the ratio of the response spectra AR/AT
Fig. 11 Comparison of response for the lumped mass linear building model Fig. 12 Comparison of M-θ relation
0 20 40 60
EL+55.3
EL+47.3
EL+40.0
EL+32.8
EL+24.5 EL+20.4
EL+10.5 EL+32.8
EL+28.5 EL+24.5 EL+20.9 EL+17.5
EL+10.5 EL+24.5
EL+32.8 EL+28.5 EL+24.5 EL+37.3 EL+56.8 EL+60.7 EL+76.8 EL+80.4
EL+38.0 EL+32.8
EL+21.0 EL+17.5
EL+10.5
EL+83.5 EL+82.7
EL+72.1
EL+66.8
EL+50.0 EL+45.3
EL+20.9 EL+17.5
EL+10.5
0 20 40 60 0 20 40 60
0 0 20 40 60
O/S
I/C
E/B
FH/B
Acceleration (m/sec2) Acceleration (m/sec2) Acceleration (m/sec2) Acceleration (m/sec2)
SR FEM
FEM SOIL MODEL SR MODEL
0.0E+00 5.0E+08 1.0E+09 1.5E+09 2.0E+09 2.5E+09 3.0E+09 3.5E+09
0 5 10 15 20
kN
/m
T heory_Re T heory_Im FEM_Re FEM_Im
Hz
0.E+00 1.E+07 2.E+07 3.E+07 4.E+07 5.E+07 6.E+07
0.E+00 2.E-05 4.E-05 6.E-05 8.E-05
Rotational Angle(rad)
M
o
me
n
t (k
N
m)
FEM VA Theory 0
0.2 0.4 0.6 0.8 1 1.2
0.01 0.1 1.0 10.0
Period (sec)
AR
/
AT
0 0.2 0.4 0.6 0.8 1 1.2
0.01 0.1 1.0 10.0
Period (sec)
AR
/
Fig. 13 Cracks on the external walls of the O/S
Fig. 14 Vertical reinforcement stress of the O/S
Fig. 15 Transverse reinforcement stress of the O/S
(b) the case H+V (a) the case H
FH/B
E/B O/S
500000kN/m2
FH/B
E/B O/S
500000kN/m2
FH/B
E/B O/S
500000kN/m2
FH/B
E/B O/S
500000kN/m2
Front of the north side
Front of the west side Front of the south side Base
Front of the north side
Front of the west side Front of the south side Base
N S N S
Tensile yield Compressive yield
Tensile yield Compressive yield
(b) the case H+V (a) the case H
FH/B
E/B O/S
200000kN/m2
FH/B
E/B O/S
200000kN/m2
FH/B
E/B O/S
200000kN/m2
FH/B
E/B O/S
200000kN/m2
Front of the north side
Front of the west side Front of the south side Base
Front of
the north side Front of the west side
Front of the south side Base
Tensile yield Compressive yield
Tensile yield Compressive yield
N S N S
Direction of Vibration Direction of Vibration
Direction of Vibration Direction of Vibration
(b) the case H+V FH/B
E/B O/S
FH/B
E/B O/S
FH/B
E/B O/S
(a) (a) the case H
FH/B
E/B O/S
FH/B
E/B O/S
Front of the north side
Front of the west side Front of the south side
N S
Base
Crack Crack(Closed)
Front of the north side
Front of the west side Front of the south side Crack Crack(Closed) N S
Base
Direction of Vibration Direction of Vibration
5. COMPARISON OF RESPONSE BEHAVIOR
The response behavior in the case H was compared with that in the case H+V.
Fig. 13 illustrates cracks on the external walls of the O/S. In the shear cracks on the web surface (west side) and the flexural cracks on the flange surface (south side and north side), it can be said that the behavior of the case H is almost the same as the case H+V.
Fig. 14 and Fig. 15 illustrate vertical and transverse reinforcement stress of the O/S. Vertical and transverse reinforcement does not reach a yield state in either case and it can be confirmed that the structural safety performance is secured. From these facts, it can be said that the responses of the building remain in a weak nonlinear range in general for this input level.
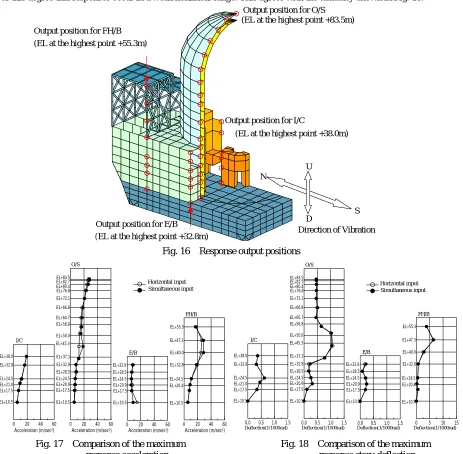
Fig. 16 shows the output points for responses of the FEM model. In this paper, investigations are carried out mainly for RC shear walls. The C/V composed of linear steel is not subjected to an investigation.
Fig. 17 shows the comparison of the maximum response acceleration in a horizontal direction. There are some parts where the response for the case H+V is slightly larger than that for the case H, but the responses for both cases are almost equivalent to each other as a whole.
Fig. 18 shows the comparison of maximum response story deflection. The results obtained in the case H almost agree with the results in the case H+V. It can be thought that the effects of the vertical input ground motion upon the horizontal response are slight. All values for the story deflection except the steel members (E.L.32.8 or more) are about 1/1000 or less, which is a comparatively small value. It can be estimated from the maximum response story deflection of this degree that responses occur in a weak nonlinear range. This agrees with the tendency shown in Fig. 13.
Fig. 16 Response output positions
Fig. 17 Comparison of the maximum response acceleration
Fig. 18 Comparison of the maximum response story deflection 0 20 40 60
EL+55.3
EL+47.3
EL+40.0
EL+32.8
EL+24.5 EL+20.4
EL+10.5 EL+32.8
EL+28.5 EL+24.5 EL+20.9 EL+17.5
EL+10.5 EL+24.5
EL+32.8 EL+28.5 EL+24.5 EL+37.3 EL+56.8 EL+60.7 EL+76.8 EL+80.4
EL+38.0 EL+32.8
EL+21.0 EL+17.5
EL+10.5
EL+83.5 EL+82.7
EL+72.1 EL+66.8
EL+50.0 EL+45.3
EL+20.9 EL+17.5
EL+10.5
0 20 40 60 0 20 40 60 0 20 40 60
O/S
I/C
E/B
FH/B
Acceleration (m/sec2) Acceleration (m/sec2) Acceleration (m/sec2) Acceleration (m/sec2)
Horizontal input Simultaneous input
0.0 0.5 1.0 1.5
EL+55.3
EL+47.3
EL+40.0
EL+32.8
EL+24.5 EL+20.4
EL+10.5 EL+32.8
EL+28.5 EL+24.5 EL+20.9 EL+17.5
EL+10.5 EL+24.5
EL+32.8 EL+28.5 EL+24.5 EL+37.3 EL+56.8 EL+60.7 EL+76.8 EL+80.4
EL+38.0 EL+32.8
EL+21.0 EL+17.5
EL+10.5
EL+83.5 EL+82.7
EL+72.1 EL+66.8
EL+50.0 EL+45.3
EL+20.9 EL+17.5
EL+10.5
0.0 0.5 1.0 1.5 0.0 0.5 1.0 1.5 0 5 10 15
O/S
I/C
E/B
FH/B
(1/1000rad) (1/1000rad) (1/1000rad) (1/1000rad)
Horizontal input Simultaneous input
Deflection(1/1000rad) Deflection(1/1000rad) Deflection(1/1000rad) Deflection(1/1000rad)
O/SEL+83.5m
I/C EL+38.0m
E/B EL+32.8m FH/B
EL+55.3m
Output position for FH/B (EL at the highest point +55.3m)
Output position for O/S (EL at the highest point +83.5m)
Output position for I/C
(EL at the highest point +38.0m)
Output position for E/B
(EL at the highest point +32.8m)
N
S U
D
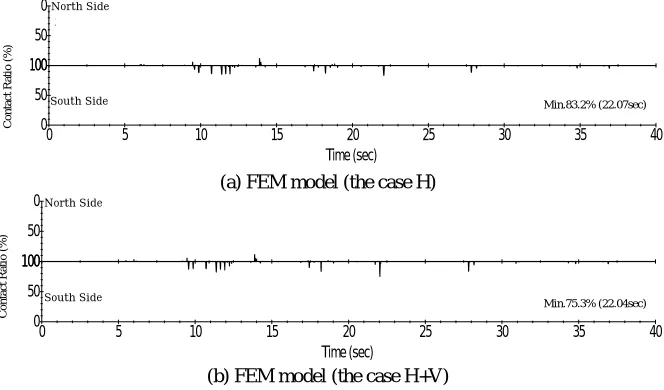
6.COMPARISON OF GROUND CONTACT RATIO
Fig. 19 shows the time history wave (0~40sec). In this study, the ground contact ratio and the time when the ground contact ratio decreased in both cases almost corresponded to each other. The difference in the uplift behavior caused by inputting vertical ground motions was not large.
(a) FEM model (the case H)
(b) FEM model (the case H+V)
Fig. 19 Comparison of time history wave for ground contact ratio
7. CONCLUSIOINS
In this paper, the behavior of the nonlinear building-soil coupled type 3D FEM model made with consideration to basemat uplift in the case H (horizontal input only) was compared with that in the case H+V (horizontal and vertical input). As a result, the following results were obtained.
(i) There is not a large difference between the horizontal response for the case H and that for the case H+V even in the analyses of element models. It has been clarified that the effects of the vertical ground motion on the horizontal response are slight.
(ii) The difference of the behavior of the basemat uplift between the case H and the case H+V is not large for the input of this level.
APPENDIX
1. Nuclear Safety Commission of Japan : Revision of the “guidelines for seismic design evaluation of nuclear power reactor facilities” 18, NSC, No.59, 2006.9.19 (in Japanese)
2. Kasuga, Y., Kambayashi, A., Tsunashima, N., et. al. : Nonlinear seismic response of a PWR-type reactor building simulated by a 3-D FEM Model, 12TH WCEE, 2000.
3. Japan Electric Association, Technical Guidness for Aseismic Design of Nuclear Power Plants- Supplement, JEAG4601-1991, 1991, pp.79-97 (In Japanese)
4. Kasuga, Y., Tsunashima, N., Ozaki, M., et. al. : Analytical Study on Non-linear Seismic Behavior of a large Scale Reinforced Concrete Structure, Journal of Structural Engineering, Vol.49B, pp.193-202, 2003.3 (in Japanese)
5. Nakamura,N., et. al. : An Estimation Method for Basemat Uplift Behavior of NPP Building, Proc. of 18th International Conference on Structural Mechanics in Reactor Technology, Paper No.K04-8, 2005.8
6. 6.Tajimi, H : Basic Theories on Aseismic Design of Structures, Report of the Institute of Industrial Science, University of Tokyo, Vol.8, No.4, pp.170-215, 1959 (in Japanese)
7. Nakamura, N., Kasuga, Y., Tsunashima, N., et. al : Analytical Study on Energy Consumption of Reinforced Concrete Shear Walls Subjected to Cyclic Horizontal Loading, Architectural Institute of Japan, No.565, pp.87-94, 2003.3 (in Japanese)
8. Stevens,I.D., Uzumeri,S.M. and Collins, M.P. : Analytical Modeling of Concrete Subjected to Monotonic and Reversed Loadings, Department of Civil Engineering, Publication No.87-1, University of Toronto, 1987.2
9. Karsan,I.D., and Jirsa,J.O. : Behavior of Concrete under Compressive Loading, Journal of Structural Division, ASCE, pp.2543-2563, 1969.12
10. Yamada, M., Kawamura, H. and Morisita, H., ”Study on plastic fatigue of concrete”, Summaries of Technical Papers in Kinki Area, Architectural Institute of Japan, pp.21-24, 1977. (in Japanese)
11. Yamada, K., Aoyagi, M., “Shear transfer model for cracking faces”, Conference on Shear of Concrete in Analytical Study, pp.19-28, 1983 (in Japanese)
0 5 10 15 20 25 30 35 40
0 50 100 100 50 0
Time (sec)
( %
) Min. 88.6% ( 27.76 sec )
Min. 75.3% ( 22.04 sec )
Min.75.3% (22.04sec) North Side
South Side
Conta
ct Ra
tio (
%
)
0 5 10 15 20 25 30 35 40
0 50 100 100 50 0
Time (sec)
( %
) Min. 88.6% ( 27.75 sec )
Min. 83.2% ( 22.07 sec )
Conta
ct Ra
tio (
%
)
North Side
South Side Min.83.2% (22.07sec)