Report No. 392
BIOSOLIDS AND REALISTIC YIELD EXPECTATIONS
By
James T. Green, Jr. and Noah N. Ranells
Department of Crop Science
College of Agriculture and Life Sciences North Carolina State University
Raleigh, NC 27695
UNC-WRRI-392
BIOSOLIDS AND REALISTIC YIELD EXPECTATIONS
James T. Green, Jr. and Noah N. Ranells
Department of Crop Science College of Agriculture and Life Sciences
North Carolina State University Raleigh, NC 27695
The research on which this report is based was supported by funds provided by the Urban Water Consortium (UWC) of the Water Resources Research Institute of The University of North Carolina (WRRI). Contents of the publication do not necessarily reflect the views and policies of the UWC or the WRRI, nor does mention of trade names of commercial products constitute their endorsement by the UWC or the State of North Carolina.
This report fulfills the requirements for a project completion report of the Water Resources Research Institute of The University of North Carolina. The authors are solely responsible for the content and completeness of the report.
WRRI Project No. 50338
ACKNOWLEDGMENTS
Many individuals aided in the completion of this project, but Dr. Larry D. King, of Soil Science Consulting did the literature review that addressed the primary objective of this project.
Dr. Amber D. Moore reviewed this document and analyzed and prepared the field data from experiments conducted at the Greenville Water Treatment Facility.
We would like to acknowledge research associate Michael Scott, for coordinating all of the field work, and research technicians Pete Thompson and T.J. Holiday for assisting Mike with site selection, planting, fertilizing, harvesting, lab analysis, and data organization. Undergraduate laborers Justin Garrett, Renee White, Owen Wagner, Jacob Presley, and Mike Weeks for helped with data recording, data entry, and lab analysis. Mr. John Gagnon (NRCS Soil Scientist) identified and characterized the soils at the Greenville Water Treatment Facility.
We certainly appreciate the efforts of Pitt County Extension Agent Phillip Rowan for his assistance in weed control, vegetation conditions and the farm tour. The employees of the Greenville Utilities Department provided assistance in plot preparation, forage removal and animal control.
ABSTRACT
Municipal waste water operators question whether Realistic Yield Estimates (RYE) developed from studies of the behavior of chemical fertilizers and animal waste in soils, are valid for wastewater biosolids, which are generated by various treatment processes that affect their
chemical makeup and nutrient content. This project summarized available scientific literature on differences between biosolids and other sources of plant nutrients for crop production. A series of protocols were developed to document crop yields, nutrient uptake, and estimate Plant-Available N (PAN) in biosolids and soils. A series of experiments were conducted on two relatively common soil series to validate the Realistic Yield Database for bermudagrass and its mixtures with winter cover crops. A questionnaire was developed to provide guidance on the training needs for those who manage crops receiving waste water and biosolids.
In a study of biosolids in North Carolina, PAN ranged from 4 to 39%. Other studies showed a range of 0% PAN for biosolids stored long-term in lagoons to 45% for biosolids dewatered on drying beds. In studies with corn, PAN ranged from 25 to 38% and with fescue grass from 42 to 50%. The ratio of fertilizer N to biosolids N to achieve identical yields is the N efficiency ratio (NER) of the biosolids. Review of numerous field studies showed that NER varies widely. This variation is due in part to nutrient forms in the biomass (e.g., the ratio of NH4-N to total N in the biosolids), rainfall during the growing season, and differences among crops. NER values ranged from 0.15 to 1.38 with a mean of 0.57 and a median of 0.55. Evidence was found that NER increases if biosolids are applied over a long period of time because of the residual effect of biosolids applied in prior years. No toxic effects were found when the ration for beef cattle was supplemented with up to 12% biosolids.
The RYE data base generally over estimates the yield of bermudagrass and winter cover crops on the Alaga and Pactolus soil series. Actual yields ranged from about 45% to 95% of RYE
database. Rainfall averaged from 73% to 137% of the 30-year mean, but more importantly the amount of moisture during the growing season was often severely limiting; this aspect of crop production makes it necessary to study crop responses for several years.
TABLE OF CONTENTS
ACKNOWLEDGEMENTS ...iii
ABSTRACT ...v
TABLE OF CONTENTS ...vii
LIST OF FIGURES ...ix
LIST OF TABLES ...xi
SUMMARY AND CONCLUSIONS ...xv
RECOMMENDATIONS ...xxi
ABBREVIATIONS ...xxiii
CHAPTER 1 CROP RESPONSE TO BIOSOLIDS: A LITERATURE REVIEW ...1
SUMMARY ...28
APPENDIX ...29
LITERATURE CITED ...34
CHAPTER 2 OPERATIONAL PROTOCOLS FOR ESTIMATION OF PLANT-AVAILABLE N ...37
CHAPTER 3 DOCUMENTING FORAGE CROP PRODUCTION AND N USE EFFICIENCY FOR BERMUDAGRASS GROWN WITH AND WITHOUT WINTER COVER CROPS AND RELATED TO RYE DATABASE ...50
LIST OF FIGURES
CHAPTER 1
Figure 1.1. Response of fescue grass to fertilizer N and biosolids N, Biltmore Estate, Asheville, NC. Data from Mays (1988). ...13
Figure 1.2. Response of corn to fertilizer N or biosolids N, Warren Wilson College,
Swannanoa, NC. Data from Mays (1988). ...15
Figure 1.3. Response of corn to fertilizer or biosolids N, Neuse River Wastewater
Treatment Plant farm, Raleigh, NC. Data from King (1983). ...16
Figure 1. 4. Nitrogen use efficiency (NUE) of fertilizer N and biosolids N applied to corn, Neuse River Wastewater Treatment Plant, Raleigh, NC.25. Data from
King (1983). ...17
Figure 1.5. Response of fescue grass to fertilizer N and N in heat-dried or dewatered biosolids, state of Washington. Data from Cogger (2001). ...18
Figure 1.6. Relationship between N efficiency ratio (NER) and years of biosolids application to fescue grass, state of Washington. Derived from
Cogger (2001). ...19
Figure 1.7. Response of Coastal bermudagrass to fertilizer N or biosolids N,
Georgia Piedmont. Data from King (1972a). ...20
Figure 1.8. Response of Coastal bermudagrass to fertilizer N applied in 1971 and to the residual effect of biosolids N applied in 1969 and 1970.
Data from Touchton (1976). ...21
Figure 1.9. Response of rye over-seeded in Coastal bermudagrass to fertilizer N applied to the rye and to the residual effect of biosolids N applied to the
Coastal bermudagrass each year. Data from King (1972b). ...22
CHAPTER 2
Figure 2.1. Suggested flow chart for estimating PAN in soils and biosolids ...38
Figure 2.2. Soil samples in Zip-lock bags showing spacing within incubation chamber ....44
Figure 2.3. A core sampler inserted into center of bale to sample cross section of forage within ...46
CHAPTER 3
Figure 3.1. Monthly precipitation recorded at the Pitt/Greenville airport in
Greenville, NC ...53
Figure 3.2. Predicted and observed mean annual dry matter yield of bermudagrass overseeded with cereal rye on an Alaga soil in Pitt County, NC. Values are
the mean of 3 growing seasons, and 4 replications ...62
LIST OF TABLES
CHAPTER 1
Table 1.1. Availability of organic N in biosolids from selected North Carolina cities. Data from King (1984)...4
Table 1.2. Plant-available N from biosolids and fertilizer applications at the Neuse
River Wastewater Treatment Plant. Data from King (1983). ...5
Table 1.3. Plant-available N (PAN) in biosolids as determined from a field study
with fescue grass. Data from Cogger (2004). ...5
Table 1.4. Cumulative plant-available (PAN) in biosolids as determined from a field study with perennial ryegrass, prairiegrass, and fescue grass. Data from Henry (1999). ...6
Table 1.5. Ammonia volatilization from surface-applied liquid biosolids. Data from Beauchamp (1978). ...7
Table 1.6. Effect of additions of FeCl3 during wastewater treatment on
extractability of P from biosolids. Data from Penn (2002). ...8
Table 1.7. Effect of FeCl3 used in the treatment process and lime stabilization
of biosolids on P extractability from biosolids. Data from Leytem (2004). ...9
Table 1.8. Dissolved reactive P in runoff from soil amended with fertilizer or
biosolids. Data from Bundy (2001). ...10
Table 1.9. Phosphorus leached from sandy soils amended with biosolids or
fertilizer P. Data from Elliott (2002)...11
Table 1.10. Nitrogen efficiency ratios (NER) for biosolids from several studies. ...14
Table 1.11. Estimates of biosolids N efficiency ratio from various studies...23
Table 1.12. Nitrogen efficiency ratio (NER) of biosolids as determined from a field study with irrigated corn and rain-fed sorghum in Nebraska. Data from Binder (2002). ..24
Table 1.13. Response of wheat, corn, and soybean to fertilizer and biosolids
applications. Data from Mays (1988). ...24
Table 1.14. Comparison of plant-available N (PAN) and nitrogen efficiency
Table 1.15. Response of spring barley to P from fertilizer or biosolids. Data from
Christie (2001). ...25
Table 1.16. Response of loblolly pine and sweetgum trees to fertilizer or biosolids
on disturbed areas. Data from Berry (1987). ...26
CHAPTER 2
Table 2.1. Example of the number of species contacted when 500 points of contact
were recorded with a field...48
Table 2.2. The estimated percentage of annual yield that is produced during each
month for several forage crops ...49
Table 2.3. Suggested application times for various forage crops to optimize yields
and nutrient uptake ...49
CHAPTER 3
Table 3.1. Study site design for experiments to evaluate effects of N rates on yields of bermudagrass overseeded with winter cover crops at the Greenville
wastewater treatment site ...51
Table 3.2. Site characteristics and experimental protocol for the experiments conducted at the Greenville wastewater treatment site ...52
Table 3.3. N concentration, N uptake, and dry matter yield of bermudagrass on Pactolus soil in Pitt County, NC. (n=4, mean of four replications) ...54
Table 3.4. N concentration, N uptake and dry matter yield for bermudagrass on an
Alaga soil in Pitt County, NC ...55
Table 3.5. N concentration, N uptake, and dry matter yield of bermudagrass
overseeded with prairiegrass on an Alaga soil in Pitt County, NC. (n=4, mean of four replications) ...56
Table 3.6. Apparent Nitrogen Recovery (ANR) and N efficiency of bermudagrass overseeded with prairiegrass on an Alaga soil in Pitt County, NC. (n=4, mean of 4 replications and the total of four harvests) ...57
Table 3.7. N concentration, N uptake, and dry matter yield of bermudagrass overseeded with cereal rye on a Pactolus soil in Pitt County, NC. (n=4, mean of four
Table 3.8. Apparent Nitrogen Recovery (ANR) and N efficiency in 2002 of bermudagrass overseeded with cereal rye grown on a Pactolus soil in Pitt
County, NC. (n=4, mean of 4 replications and total of four harvests) ...59
Table 3.9. N concentration, N uptake, dry matter yield, apparent N recovery, and N efficiency for bermudagrass overseeded with cereal rye on an Alaga soil
in Pitt County, NC...61
Table 3.10. Observed and expected RYE yields for bermudagrass ...63
Table 3.11. Observed and expected RYE yields for bermudagrass overseeded with
either prairiegrass or cereal rye ...63
SUMMARY AND CONCLUSIONS
Municipal waste water operators question whether Realistic Yield Estimates (RYE) developed from studies of the behavior of chemical fertilizers and animal waste in soils, are valid for wastewater biosolids, which are generated by various treatment processes that affect their chemical makeup and nutrient content. This project summarized the existing literature on differences between biosolids and other sources of plant nutrients and developed protocols for determining Plant Available Nitrogen and documenting yields and nutrient composition of forage crops and developed a questionnaire that could be used to determine the training needs for those who manage crops receiving waste water and biosolids
The objectives of this project were to:
1. Summarize available scientific literature on differences between biosolids and other sources of plant nutrients for crop production.
2. Develop operational protocols for documenting crop yields, nutrient uptake, and estimation of Plant-Available N (PAN) in biosolids and soils.
3. Document forage crop production and N use efficiency for bermudagrass grown with and without winter cover crops and relate the response to RYE (Realistic Yield Expectation) database.
4. Develop a questionnaire that will provide information about crop and application management practices used on biosolids and effluent application sites.
Literature Review
From the late 1960s through the 1980s considerable research was conducted on agricultural use of biosolids. The emphasis resulted from the increase in biosolids production due to more efficient wastewater treatment processes and interest in land application as a least-cost disposal method.
Nutrient Availability
In field studies, PAN is estimated by summing the amount of N taken up by the crop plus the amount remaining in the soil at the end of the growing season. In studies with corn, PAN ranged from 25 to 38% and with fescue grass from 42 to 50%.
Since biosolids, particularly liquid biosolids, can contain appreciable NH4-N, estimates of N loss by ammonia (NH3) volatilization are important in determining application rates. Field studies have shown losses up to 58% of the applied NH4-N.
The concentration of P in biosolids and the availability of that P are affected by the wastewater treatment process. Most treatment facilities have added a process to increase P removal. Iron (Fe) and aluminum (Al) compounds may be added to react with P and form precipitates, e.g., ferric chloride [FeCl3] and alum [Al2 (SO4)3]. Other facilities use a biological nutrient removal (BNR) step in which wastewater is subjected to anaerobic conditions, which increases P uptake by microorganisms.
One study showed 3.5% P in the biosolids from a facility where FeCl3 was used and 1.4% from a facility where it was not. Studies estimating P availability by extracting biosolids with
commonly used soil-testing extractants showed availability in the order: BNR > no additions > FeCl3 additions. For example, extractable P ranged from 29 to 68 % with no additions and from 0.4 to 13% where FeCl3 was added. A similar availability sequence was seen in studies
measuring leaching of P from biosolids in very sandy soils. Nutrient Loading Rates
In the past, loading rates of biosolids have been based on the N content because, among other reasons, N was considered the nutrient most likely to pose a water pollution hazard. However, because the P/N ratio in biosolids (0.25) is much greater than the ratio required by crops (0.1), this practice has led to over-application of P. A survey of biosolids application sites in North Carolina found that P rates up to 1460 kg/ha was being applied. In another study, one site had soil-test P concentrations up to 19 times higher than that required for good crop growth. Because of concern for potential surface water pollution from erosion and runoff, 24 states now restrict loading rates based on P. Restricting loading rates based on P greatly increases disposal costs because of the greater amount of land required and greater transportation costs.
Crop Response
Since biosolids have been applied based on N content in the past, one way of evaluating crop response to biosolids is to compare the amount of fertilizer N and biosolids N required to achieve the same yield. The ratio of fertilizer N to biosolids N to achieve identical yields is the N
efficiency ratio (NER) of the biosolids. A problem with this approach is that in addition to containing N, biosolids also contain a variety of other nutrients and micronutrients that could affect the yield response
with a mean of 0.57 and a median of 0.55. Evidence was found that NER increases if biosolids are applied over a long period of time because of the residual effect of biosolids applied in prior years.
Since restricting loading rates based on biosolids P content is a recent development, few studies were found comparing fertilizer P rates and biosolids P rates to achieve the same yield. One study showed a P efficiency ratio (PER) of 0.77.
Tree Response
Biosolids application to trees was not very effective except on disturbed sites like barrow pits and kaolin mine spoils. Weed competition was one factor that limited the response of trees. Effect On Grazing Animals
Since forages are the main crop on many application sites, a brief review of the effect of direct ingestion of biosolids on grazing animals was conducted. No toxic effects were found when the ration for beef cattle was supplemented with up to 12% biosolids.
Protocol For Plant Available Nitrogen Of Biosolids And Soils
An estimate of the plant availability of nitrogen (N) in biosolids is required to ensure that biosolids loading rates will supply sufficient N for optimum yields, but will not create a ground water pollution hazard. The protocol consists of maintaining samples of soil and biosolids-amended soil at moisture and temperature levels suitable to sustain microorganisms that convert organic N to ammonium and nitrate. The accumulation of these two inorganic N forms over a period of 12 or more weeks is an estimate of the PAN the soil or biosolids will supply during a growing season.
A flow chart of the suggested protocol for estimating PAN is shown. It could be incorporated into the regular monitoring program that wastewater treatment facilities use to assess the performance of treatment systems.
Soil samples would be collected from each field receiving biosolids. Each sample would be split for specific analyses:
Sample 1 would be submitted to the Agronomic Division of the NC Department of Agriculture for routine soil testing. Results of these tests would be use to determine rates of supplemental fertilizer and/or lime required by specific crops.
Sample 2would be analyzed to determine soil nitrate content after crop harvest or at the end of growing season. Excessive soil nitrate would indicate the previous biosolids rate was too high and subsequent rates should be adjusted accordingly. Low concentrations could indicate (1) the rate was appropriate if yields were good; or (2) the rate was too low if yields were poor.
Sample 3 would be used in a laboratory incubation study to estimate PAN.
(NO3-N). This inorganic N that accumulated during the study period would be an estimate of:
i. the PAN the soil would supply during the subsequent growing season ii. the PAN the biosolids would supply.
The data from samples 2 and 3 would provide the information needed to determine the biosolids loading rate for the subsequent growing season. This procedure would be repeated each year as a regular part of the wastewater treatment facility’s monitoring program.
Protocol For Monitoring Yields And Nutrient Uptake
Yields for a particular field or farm may vary from the reported RYE database due to variation in soil characteristics, management skills, cropping history, and environmental conditions, namely rainfall for a given year. Yield and nutrient composition from crop fields should be documented for a minimum of three years but due to unpredictable weather patterns it is best to monitor yields every year.
Sample a representative number of bales within any of the above parameters that can impact weight, moisture content and number of bales. As a general rule, sample a minimum of 10 bales or 10% of the bales within a management unit to achieve repeatable and consistent results. Choose representative bales and weigh them in the field using load bars or truck scale. Immediately after weighing each bale, use a commercial hay probe to extract at least one core from the bale to be used for moisture determination. Combine the core samples of 10 bales or 10% of the bales in the management unit into a “ziplock” bag for moisture content determination and nutrient analysis. Calculating the dry weight per acre example:
Dry weight yield per acre = (avg bale weight * avg dry matter % ) * number of bales /acre
Protocol For Estimating The Botanical Composition Of Forage Crops.
Nutrient management plans are based on RYE values for specific crop species and mixtures. Therefore, one must know the botanical composition of application sites before selecting the appropriate agronomic rates of nutrients or the proper harvest or grazing management practices. The Point-Step method provides a reasonable estimate of botanical composition. The procedure is based on making a number of specific contact points with the vegetation across a field and recording the number of times a particular plant specie is contacted relative to the number of potential contacts. Use a systematic way of collecting the data by recording a “contact” at some predetermined interval while crossing the field. For example, make a reading at every 10th step while walking the field.
Using Crop Growth Curves To Time Nutrient Applications
Nutrient uptake by crops is strongly related to the daily growth rate of the plant. Plants have fairly characteristic growth patterns that can be used to strategically apply nutrients so that the rapid growth of the plant can be matched with nutrient applications that maximize uptake and minimize the risk of nutrient loss from the root zone. Data is presented to show monthly distribution of growth for various forage species and suggested application dates are presented.
Documenting RYE and Apparent Nitrogen Recovery On Alaga And Pactolus Soil Series. The yields of bermudagrass alone or with overseeded winter cover crops varied widely from year to year. Using observed yields and regression analysis it was determined that most of the
variation in yield could be attributed to N level. However soil moisture and rainfall variation were most likely the factors limiting yields on the two soils evaluated in this study.
The RYE data base generally over estimates the yield of bermudagrass and winter cover crops on the Alaga and Pactolus soil series. Actual yields ranged from about 45% to 95% of RYE
database. Rainfall averaged from 73% to 137% of the 30-year mean, but more importantly the amount of moisture during the growing season was often severely limiting; this aspect of crop production makes it necessary to study crop responses for several years.
Apparent nitrogen recovery (ANR) ranged from 26 to 46% for the RYE levels of N and was as low as 19% when the N application rate was double the RYE suggested level. These levels of recovery indicate that significant amounts of N is not being accounted for by plant uptake and suggests that some method of assessing soil N levels should be implemented following a cropping season.
A Questionnaire About Crop And Application Management Practices
RECOMMENDATIONS
1. Do not select an availability factor to use for all biosolids and all soils because estimates of N and P availability varied widely among biosolids.
2. Do not select a value of NER for all biosolids because crop response to biosolids-applied N is quite variable. NER values varied not only among studies but also within studies but it increases as the years of treatment continue.
3. Wastewater treatment facilities should estimate PAN by conducting incubation studies with biosolids and soil from their respective sites as a regular part of their land application program. A protocol was developed for conducting incubation studies. 4. Use PAN incubation of soils from application sites at the end of the growing season
to adjust nutrient loading rates in the subsequent season.
5. Monitor crop yields for weight (dry matter composition) and nutrient (N, P, and perhaps Cu, Zn) concentration as a means of documenting nutrient removal from application sites. A protocol was developed for documenting yields and nutrient composition.
6. It appears that the RYE database may be overestimating the yield potential for many soils, therefore additional research should be initiated to further validate the crop removal of N and P on biosolids application sites.
7. Validating the RYE database should be continued for many other soils and for more than three year periods.
8. Due to wide variation in seasonal rainfall it would be best to provide supplemental irrigation water to application sites during the active growing season as a way to maximize crop growth and nutrient uptake.
9. To enhance crop yields and nutrient uptake consider split applications of biosolids or waste water based on monthly crop growth curves.
10.Since P buildup is a strong possibility on some sites, research should be initiated to determine the amount of fertilizer N needed for satisfactory crop growth.
11.PLAT (Phosphorus loss assessment tool) should be used on sites to determine the potential for P loss from the application site, especially on sites that have received biosolids for several years. See http://www.soil.ncsu.edu/nmp/ncnmwg/index.htm
ABBREVIATIONS
Al: aluminum
BNR: biological nutrient removal Ca: calcium
Cd: cadmium Cl: chlorine Cu: copper dm: decimeter Fe: iron g: gram H: hydrogen
ha: hectare (2.47 acres)
kg: kilogram (2.2 pounds); kg/ha = 1.12 x pounds/acre
Mehlich 1 and 3 = extractants used in soil testing laboratories
mg: milligram N: nitrogen
NER: Nitrogen efficiency ratio, fertilizer N rate/biosolids N rate that results in the same yield.
NH3: ammonia
NH4-N: ammonium nitrogen NO3-N: nitrate nitrogen
NUE: Nitrogen use efficiency, the ratio of N taken up by the crop to the amount of N applied by fertilizer or biosolids. O: oxygen
P: phosphorus
PAN: plant-available N. Estimated from laboratory incubation studies or from field studies where crop and soil N are
determined Pb: lead
PER: Phosphorus efficiency ratio, fertilizer P rate/biosolids P rate that result the same yield.
CHAPTER 1
CROP RESPONSE TO BIOSOLIDS: A LITERATURE REVIEW
Introduction
Definition of Biosolids
Municipal wastewater contains about 99.9% water and 0.1% solids. One of the main objectives of wastewater treatment is the removal of the solids. Most of the solids are removed in “clarifiers”, large tanks where wastewater is held to allow heavy particles to settle to the bottom and light particles to float to the top. In the past these solids were referred to as sewage sludge. The newer term is “biosolids”. The biosolids are removed from the clarifiers and stabilized prior to land application.
Common methods of stabilization include anaerobic digestion, aerobic digestion, and lime
stabilization. Digestion involves holding biosolids in air-tight structures (anaerobic) or open basins (aerobic) for 20 to 30 days to allow microbial decomposition of the readily decomposable
components of the biosolids. Lime stabilization involves dewatering the biosolids and adding lime [calcium hydroxide, Ca(OH)2] to raise the pH to approximately 12 to kill essentially all the
microorganisms in the biosolids. Another highly alkaline material, cement kiln dust, is also used for stabilization. Because of the lime content, these biosolids have a liming effect on soil. For example, the liming potential of lime-stabilized biosolids may range from 21 to 52% of that of agricultural limestone; liming potential of biosolids stabilized with cement kiln dust may rang from 47 to 68% (Jakobsen 1986; Simard 1986; Willett 1986; Sloan 1995).
Biosolids aerobically or anaerobically digested usually are applied to land in a liquid form (e.g., 5% solids). The organic matter contend of these biosolids is about 45% (King 1977; King 1981). Lime-stabilized biosolids are usually applied as a cake material (e.g., 20-30% solids). Because of the high lime content (up to 66% of the solids), the organic matter content is greatly reduced by dilution.
History of Interest in Land Application
Early reports on the agricultural value of biosolids include publications by Anderson (Anderson 1955) and Bear and Prince (Bear 1955). Interest in application to agricultural land increased in the mid 1960s and continued into the 1980s. This interest was stimulated by increased biosolids production because of more efficient wastewater treatment processes, a desire for cheaper disposal methods, phasing out of land filling and ocean dumping, and environmental concerns like nitrate leaching and uptake of heavy metals by crops. Application to agricultural land is now a widely accepted method of biosolids disposal/utilization.
Purpose
Scope
The review placed emphasis on the availability of N and P in biosolids and crop response to
biosolids applications. The fate of heavy metals and pathogens in biosolids was not included in this review of literature. Also, biosolids produced during treatment of industrial wastewater were not included in the review.
Information sources
Initially, the Internet was used to conduct electronic searches of a variety of databases. Websites of scientific journals such as the Journal of Environmental Quality, Soil Science Society of America Journal, and Transactions of the American Society of Agricultural Engineers provide online search capabilities. Similarly, the websites of the D. H. Hill Library at North Carolina State University and the State Library of North Carolina provide online search capabilities. Also the D. H. Hill Library provides databases such as Agricola, which can be searched online. Initial searches of these sources yielded about 55 references (articles, books, or reports) pertaining to crop response to biosolids. The references available at the D. H. Hill Library were accessed and reviewed. Literature citations in these references led to additional references of interest. The greatest numbers of references were found in the Journal of Environmental Quality (24 articles).
Nutrient Availability
The response of crops to application of biosolids is mainly a response to the nutrients applied. Yields may be enhanced by improved soil physical properties resulting from organic matter
additions. For example, a biosolids application supplying 110 kg /ha of plant-available N might also supply 1000 kg/ha organic matter(King 1977; King 1981; King 1983). However, since the main response is to the applied nutrients, the availability of the nutrients must be estimated so rates can be chosen to supply adequate but not excessive nutrients for good crop growth.
Nitrogen
Estimates of Effectiveness of Biosolids N
Several methods have been used to estimate the effectiveness of biosolids N as a nutrient source for crops. These methods produce estimates like plant-available N (PAN), N use efficiency (NUE) and
N efficiency ratio (NER). The methods of determining these three estimates will be discussed briefly.
Plant-available N (PAN) in biosolids consists of the NH4-N and NO3-N initially in the biosolids plus the amounts of these compounds formed as the organic N in the biosolids is mineralized. Organic N will mineralize at a rate dependent on the form of the organic N (e.g., easily
mineralizable proteins vs. recalcitrant lignin-bound N compounds), temperature, and oxygen supply. PAN can be estimated from laboratory studies in which soil amended with biosolids and unamended soil are incubated for several weeks. The unamended soil is included so the NH4-N and NO3-N that accumulates due to mineralization of native soil organic N can be deducted from the amount that accumulates in biosolids-amended soil. The difference in the amount of NH4-N and NO3-N that accumulates in the amended and unamended soil is assumed the PAN, i.e.:
PAN also can be estimated in greenhouse or field studies in which the amount of N taken up by a crop, plus the amount of NH4-N and NO3-N remaining in the soil after crop harvest are determined. PAN is the sum of the N uptake plus the soil NH4-N and NO3-N from treatments receiving biosolids minus the same N pools from unamended treatments:
PAN = (N uptake + soil NH4-N & NO3-N) with biosolids – (N uptake + soil NH4-N & NO3-N) without biosolids
Total N added by biosolids
N use efficiency (NUE) is the ratio of the amount of N taken up by a crop to the amount supplied by biosolids. The amount of N uptake by an unamended crop is assumed to be the amount of soil N taken up by the biosolids-amended crop. Thus, NUE is calculated:
NUE = (N uptake by biosolids amended crop) – (N uptake by unamended crop) N supplied by biosolids
Note that NUE is similar to PAN estimated from field studies except that soil NH4-N and NO3-N are not included in the NUE calculation. Thus, while NUE is a measure of efficiency of crop use, it gives no indication of the potential groundwater pollution hazard posed by residual NH4-N and NO3-N in the soil after crop harvest.
N efficiency ratio (NER) is simply the ratio of the rates of fertilizer N and biosolids N that result in the same crop yield. For example, if 100 kg/ha of fertilizer N resulted in the same crop yield as did 400 kg/ha of total N supplied by biosolids, NER would be 100/400 or 0.25. Note that NER does not address the efficiency of uptake of biosolids N nor the pollution potential from residual NH4-N and NO3-N in the soil after crop harvest.
A word of caution in interpreting NER: Biosolids supply a variety of elements in addition to N, so the response to biosolids may be a response to more than the N applied. Comparing response to N from biosolids and fertilizer is not like comparing the response to different fertilizer N sources, e.g., ammonium nitrate (NH4NO3) vs. sodium nitrate (NaNO3).
Plant-available N
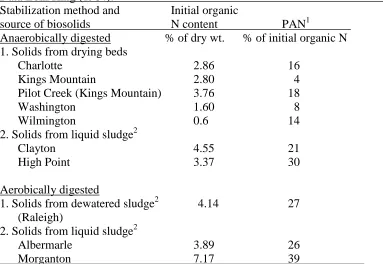
A laboratory study was conducted to estimate the PAN in biosolids from selected North Carolina cities (King 1984). Biosolids were added to samples of Cecil sandy loam soil at rates to supply 500 mg total N/kg soil. The mixtures were kept moist and incubated for 16 weeks. PAN was defined as the NH4-N and NO3-N present in the amended soils at 16 weeks minus that in an unamended
Table 1.1. Availability of organic N in biosolids from selected North Carolina cities. Data from King (1984).
Stabilization method and Initial organic
source of biosolids N content PAN1
Anaerobically digested % of dry wt. % of initial organic N 1. Solids from drying beds
Charlotte 2.86 16
Kings Mountain 2.80 4
Pilot Creek (Kings Mountain) 3.76 18
Washington 1.60 8
Wilmington 0.6 14
2. Solids from liquid sludge2
Clayton 4.55 21
High Point 3.37 30
Aerobically digested
1. Solids from dewatered sludge2 4.14 27 (Raleigh)
2. Solids from liquid sludge2
Albermarle 3.89 26
Morganton 7.17 39
1. PAN: plant-available N
2
. To estimate the PAN of liquid sludge, the N in the liquid fraction (mainly NH4-N, data not shown) must be included in the calculation.
Laboratory incubation studies provide an estimate of PAN for the first growing season, but do not provide an estimate of PAN in subsequent growing seasons. Multi-year field studies noted below do provide information on PAN over several growing seasons.
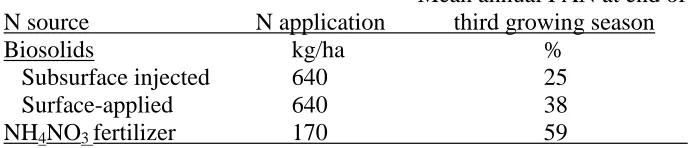
An estimate of PAN in biosolids from the Neuse River Wastewater Treatment Plant (City of Raleigh, NC) was obtained through a 3-year field study with corn (King 1983). Research plots were amended with several rates of biosolids. PAN was estimated as the N taken up by the corn crop plus any NO3-N remaining in the soil at the end of the growing season. The assumption was made that N losses by leaching were minimal during the study period. When biosolids were applied only once at a rate to supply 1300 kg total N/ha, PAN was 19% of the applied N at the end of the first growing season, 46% at the end of the second, and 53% at the end of the third.
Table 1.2. Plant-available N from biosolids and fertilizer applications at the Neuse River Wastewater Treatment Plant. Data from King 1983.
Mean annual PAN at end of N source N application third growing season
Biosolids kg/ha %
Subsurface injected 640 25
Surface-applied 640 38
NH4NO3 fertilizer 170 59
A field study in the state of Washington estimated biosolids PAN by comparing yield and N content of fescue grass fertilized with several rates of biosolids or fertilizer N (Cogger 2004). Biosolids from 14 sources varied in the range of treatment and dewatering/drying processes. Biosolids were applied in May and yield and N uptake were monitored through September of the following year. Using crop uptake of N from fertilizer or biosolids, fertilizer efficiency regression equations were developed and used to calculate biosolids PAN from N uptake data. Results are shown in Table 3. PAN was relatively low in lagoon biosolids. Also, heat drying resulted in low PAN after the first summer. Previous experiments similar to this one showed no increase in soil NO3-N above background concentrations and thus no soil NO3-N had to be factored into PAN calculations (personal communication with Craig Cogger).
Table 1.3. Plant-available N (PAN) in biosolids as determined from a field study with fescue grass. Data from Cogger (2004).
Biosolids type May-Sept Oct-April May-Sept Cumulative --- PAN as % of total N applied ---
Fresh 37 7 6 50
Fresh, heat dried 36 4 2 42 Lagoon (2-17yr) 8 to 25 0 to 5 0 to 3 ---
Table 1.4. Cumulative plant-available (PAN) in biosolids as determined from a field study with perennial ryegrass, prairiegrass, and fescue grass. Data from Henry (1999).
Biosolids Grass 1st year 2nd year --- % of applied N ---
Dewatered Per. ryegrass 17 60 Prairiegrass 35 43 Tall fescue 37 59
Mean 30 54
Heat dried Per. ryegrass 23 57 Per. ryegrass 27 61 Tall fescue 40 40
Mean 30 53
Liquid Tall fescue 27 42 Overall mean 29 53
A study that included laboratory and field experiments and computer simulation was used to
estimate the PAN of biosolids from 25 cities in the United States (Gilmour 2003). In the laboratory incubation study, mean PAN was 30% and the range was 0% for biosolids from long-term lagoon storage to 45% from anaerobically digested biosolids dewatered on drying beds. In the field study, relationships were developed between the total N uptake by plants and the amount of fertilizer N required to produce these same values. Mean PAN was 37% and the range was 9 to 74%.
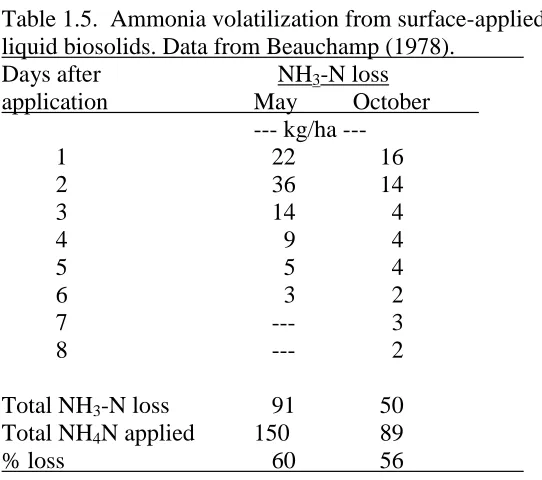
Ammonia volatilization
Loss of N by NH3 volatilization will affect biosolids PAN. In the field studies noted above, this loss is included in the PAN estimates. However, if data from incubation studies are used to estimate PAN, then NH3 volatilization must be factored into the estimate.
Table 1.5. Ammonia volatilization from surface-applied
liquid biosolids. Data from Beauchamp (1978).
Days after NH3-N loss
application May October
--- kg/ha ---
1 22 16
2 36 14
3 14 4
4 9 4
5 5 4
6 3 2
7 --- 3
8 --- 2
Total NH3-N loss 91 50 Total NH4N applied 150 89
% loss 60 56
Robinson and Roper (Robinson 2003) measured NH3 volatilization from biosolids applied to pine forest in New Zealand. From 44 to 55% of the applied NH4-N volatilized, the majority of it on the first day. After 5 days, 95% of the loss had occurred. The loss was 12% of the total N applied. Phosphorus
The availability of P in biosolids is influenced by the wastewater treatment process and the method of biosolids stabilization. Several methods are used to remove P from wastewater during the
treatment process. Additions of chemicals that react with P to from insoluble compounds have been used for many years, e.g., ferric chloride [FeCl3] and alum [Al2 (SO4) 3]. In contrast to chemical additions, biological nutrient removal (BNR) is also used. In this process wastewater is treated in an anaerobic environment and then in an aerobic environment. The result is that microorganisms take up P at higher than normal rates and thus sequester P in their biomass.
Once biosolids are separated from wastewater, they are stabilized by anaerobic or aerobic digestion or by addition of Ca(OH)2 to raise the pH to around 11 (lime stabilization). Phosphorus in the biosolids may react with Ca to form relatively insoluble Ca phosphates.
Table 1.6. Effect of additions of FeCl3 during wastewater treatment on extractability of P from biosolids. Data from Penn (2002).
FeCl3 addition % of USEPA 50301 P extracted Mehlich 3 Mehlich 1 Water
None 29-68 17-52 10-45
Added 0.4-13 0.3-6 0.4-5
1
The US Environmental Protection Agency 5030 procedure is an acid peroxide digestion method that extracts metals absorbed by biosolids constituents. It does not include metals associated with
silicates, but often extracts 75 to 90% of total metals measured by more complex digestion procedures. Also called “total sorbed P”.
When the biosolids were applied to soil, relative P availability was: biosolids from treatment
facilities using BNR > biosolids from facilities using no chemical additions > biosolids for facilities using FeCl3 additions and lime stabilization > biosolids for facilities using FeCl3 additions. The greater availability with Fe+lime compared with Fe only probably results from greater availability of Ca phosphates as compared to Fe phosphates.
The authors also found that when biosolids from facilities using FeCl3 additions were added to soils already high in P, certain forms of extractable P decreased (relative to the control). In acid soils like those found in the southern United States, most P is bound to naturally occurring Fe and Al.
Evidently some of the Fe and Al added via biosolids had not reacted with P in the wastewater and was available to react with native soil P.
Maguire et al. (Maguire 2001) conducted similar studies with some of the same biosolids and found basically the same results: lowest P availability was in biosolids from facilities using FeCl3 to remove P from wastewater.
Leytem et al. (Leytem 2004) added biosolids to a loamy sand at rates to supply 60mg total P/kg soil and incubated the mixture for 8 weeks. The samples were then extracted with Mehlich 3 and water. Results are shown in Table 7. Estimates of bioavailability by these extractions were in the order: lime-stabilized > FeCl3+lime > FeCl3. As was found in studies cited above, (1) addition of FeCl3 during the treatment process greatly reduces P availability in biosolids and (2) lime stabilization of biosolids generated with this treatment process increased P availability. The authors concluded that the concentration of P in biosolids is a poor indicator of extractability after incubation.
Table 1.7. Effect of FeCl3 used in the treatment process and lime stabilization of biosolids on P extractability from biosolids. Data from Leytem (2004). FeCl3 used Lime P concentration Extractable at 8 weeks in process stabilized Total Water soluble Mehlich 3 Water
--- mg/kg --- -- % of applied --
No Yes 14,000 138 (1)1 61 5
Yes Yes 14,300 357 (2.5) 49 4
Yes No 35,000 108 (0.3) 26 1
1. Percent of total P
Lu and O’Connor (Lu 2001) conducted experiments on availability of biosolids P on sandy soils. Biosolids high in Fe and Al increased P retention in soils for one to three years. The temporary increase may be due to production of organic acids due to biosolids applications, which lead to loss of Al and Fe from the topsoil. Phosphorus in biosolids containing abundant Fe and Al behave as a slowly available P source.
Nutrient Loading Rates
Problem: N/P Ratio
In the past, biosolids have been applied at a rate to supply the N needs of crops. This practice has resulted in over-application of P because the P/N ratio in biosolids is much higher than that required by crops. Most crops require a P/N ratio of about 0.1. Although the ratio in biosolids varies, a ratio of total P to total N of 0.25 is typical. If one assumes the P and N in biosolids are equally plant-available, then an application of biosolids to supply the N needs of the crop would supply 2.5 times the P needs of the crop. In the 1993 EPA guidelines, this over-application was not considered a problem because it was believed that best management practices would prevent erosion – the main pathway of P into surface water (Shober 2003). However, more recently this over-application has raised concerns about possible water pollution due to P losses from fields (Pierzynski 1994; Shober 2003).
Buildup in Soil
Several studies have shown the buildup of soil P when biosolids are applied based on N content. Land application of biosolids was begun in the late 1970s at the Neuse River Wastewater Treatment Plant serving Raleigh, NC. A review of the land application system was conducted in 1989 (King 1989). Soil analyses showed Mehlich 3-extractable1 P concentrations up to 1500 mg/dm3 in the top 15 cm of the soil in some fields. The Agronomic Division of the NC Department of Agriculture does not recommend P fertilization for any crop if concentrations are 80 mg/dm3 or higher. In a review of land application of biosolids in North Carolina, Zublena et al. (Zublena 1994)
reported that at 14 sites P loading rates varied from 9 to 1460 kg/ha annually. Soil analysis showed elevated P levels at most of the sites.
A similar survey of biosolids-amended farm soils in the mid-Atlantic region of the US was
conducted (Maguire 2000). Mehlich 1-extractable P was excessive in many of the treated soils but
1
excessive concentrations also were found in soils that had not received biosolids. The authors also determined oxalate-extractable P. This P is associated with amorphous Fe and Al and is not readily available to plants. The biosolids-treated fields averaged 560 mg/kg and untreated fields averaged 300 mg/kg. Therefore, the high concentration of Mehlich 1-extractable P was mitigated to some extent by the elevated concentrations of oxalate-extractable P.
Erosion and Runoff
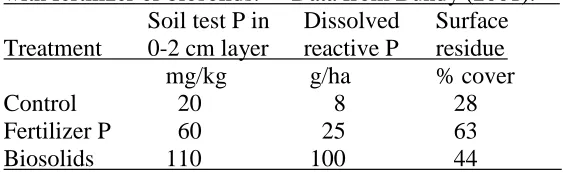
Loss of P from soils over-fertilized with biosolids P was determined in a study in Wisconsin (Bundy 2001). A rainfall simulator was used to measure P runoff from a control site receiving no biosolids, a site that had received liquid biosolids for 5 years, and a site receiving fertilizer P. Corn had been grown for three years prior to making the measurements. Results are shown in Table 8. P loss increased as soil test P increased.
Table 1.8. Dissolved reactive P in runoff from soil amended with fertilizer or biosolids. Data from Bundy (2001).
Soil test P in Dissolved Surface Treatment 0-2 cm layer reactive P residue mg/kg g/ha % cover
Control 20 8 28
Fertilizer P 60 25 63
Biosolids 110 100 44
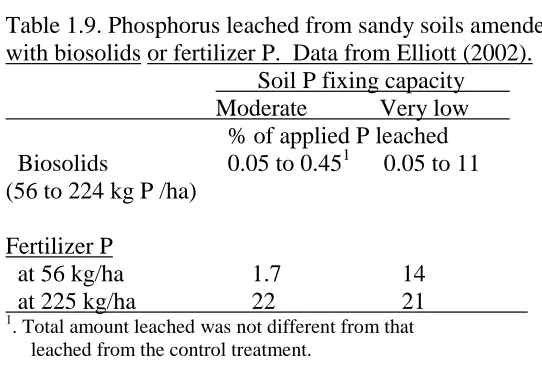
Elliott et al. (Elliott 2002) conducted a study to determine the rate of P leaching when biosolids were applied to sandy soils. Biosolids were applied at rates to supply 56 or 224 kg P/ha, i.e., rates based on crop P requirements or N requirements, respectively. From 80 to 90% of the P in the biosolids was in the inorganic form. A soil with a moderate P fixing capacity and one with a very low fixing capacity were used. Bahiagrass was grown for 4 months. None of the biosolids treatments resulted in P leaching as great as that from fertilizer P (Table 9.). For each of the
biosolids, the authors calculated a P saturation index: the molar ratio of readily soluble P/amorphous Al and Fe.
Table 1.9. Phosphorus leached from sandy soils amended with biosolids or fertilizer P. Data from Elliott (2002).
Soil P fixing capacity Moderate Very low % of applied P leached Biosolids 0.05 to 0.451 0.05 to 11 (56 to 224 kg P /ha)
Fertilizer P
at 56 kg/ha 1.7 14 at 225 kg/ha 22 21
1. Total amount leached was not different from that
leached from the control treatment.
Regulations
Animal manures, like biosolids, have P/N ratios greater than those required by crops. The concern of over-application of P has resulted in Delaware, Maryland, and Virginia requiring that manure rates be P-based (Shober 2003). The authors conducted a survey in 2000 to see if biosolids applications also were being regulated based on P. Fifty one of the 54 states and territories responded and 24 of these had regulations, guidelines, or legislation that restrict biosolids
applications based on P. Four other states have proposed guidelines. The guidelines are based on soil test P concentrations above which no application is allowed. In contrast, restrictions on manure application generally are based on a P site index. This index combines several factors that affect P loss from fields, e.g., soil P, soil type, slope, distance from drainage/streams, conservation practices, etc.
In North Carolina, the concern that excessive soil P poses a water pollution hazard has prompted the development of the Phosphorus Loss Assessment Tool (PLAT) (Osmond 2004). A computer program uses soil, landscape, and management parameters to estimate P losses by soil erosion, surface runoff, and leaching and to calculate a PLAT rating for a given field. This rating is then used to determine acceptable rates of P applications to the field.
Crop response
Nitrogen
As noted in the Introduction, interest in agricultural use of biosolids increased dramatically from the late 1960s through the 1980s. Consequently, much of the yield response data are from that period. During that period, loading rates generally were based on biosolids N content rather than P content for several reasons:
1. N was seen as the plant nutrient most likely to cause water pollution. 2. Municipalities wanted to apply maximum rates to reduce disposal costs.
3. Biosolids were distributed without cost, so farmers had no incentive to maximize the use of all the nutrients in the biosolids.
4. Over-application of P was not considered a problem because fixation by Fe and Al in soil and use of erosion control practices would prevent the excess P applied from becoming a water
pollutant.
As noted earlier, one method of assessing the effectiveness of biosolids as an N source is to
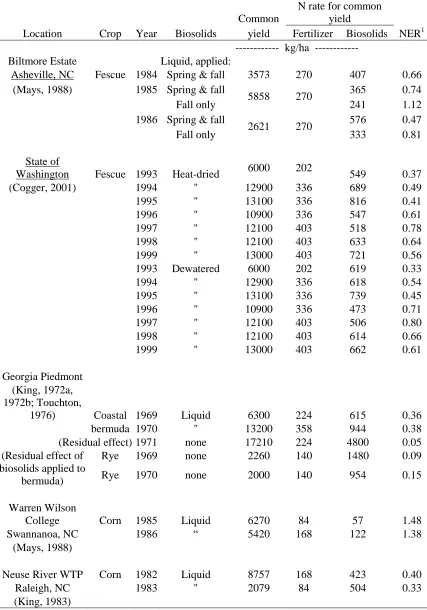
determine the N efficiency ratio, NER, the ratio of fertilizer N rate and biosolids N rate that produce the same yield. Data from a number of field studies measuring crop response to fertilizer N and biosolids N are presented below. From these data, values of NER have been estimated. In studies with multiple rates of fertilizer N or biosolids N, regression analysis was used to quantify the yield responses. The resulting regression equations were used in the calculation of NER. For example, consider a study on response of fescue grass to fertilizer N or biosolids N at the Biltmore Estate near Asheville, NC (Mays 1988). The data are shown in Figure 1 and the yield data are presented in Appendix Table A. The 3-year study included a control treatment, three rates of fertilizer N, liquid biosolids applied spring and fall, and liquid biosolids applied in the fall only (1985 and 1986 only). Using the 1984 data, NER was estimated by:
1. Using the yield at the highest fertilizer N rate as the common yield (3573 kg/ha)
2. Substituting that yield in the regression equation for fescue grass response to biosolids N and solving for N: 3573 = 1620 + 4.8N; N = 407 kg/ha
3. Calculating the ratio of fertilizer N to biosolids N: NER =270/407 = 0.66
Similar calculations were made with the data from 1985 and 1986 to produce values of NER shown in Table 10. Note in Figure 1 that the response to biosolids applied spring and fall in 1985 was nonlinear. The slope of the line between the control yield and the yield at the lowest biosolids rate was used in the calculations.
Values of NER for biosolids applied only in the fall were higher than those for biosolids applied spring and fall. The higher rates applied in the spring/fall treatments account for some of the difference, i.e., N use efficiency decreases as N loading rate increases. In 1985, fall-applied biosolids N was as effective as fertilizer N.
1972a; King 1983; Mays 1988)] Although some of this N would be lost by NH3 volatilization, a significant amount would be available to the fescue grass immediately.
800 600 400 200 0 0 0 1000 2000 3000 4000 5000 6000 7000 0 1000 2000 3000 4000 5000 6000 7000
Y = 1620 + 4.8N Y = 1380+8.1N
Fertilizer N
1984
Spring & Fall
1985
Fall
Spring & Fall
Fertilizer N Y=1910+15.4N
Y = 1840 +16.7N
800 600 400 200 0 0 800 600 400 200 0 0 0 1000 2000 3000 4000 5000 6000 7000 1986 Fertilizer N Y = 910 +6.6N
Spring & Fall Y = 1180 + 2.5N Fall
Y = 1025 + 4.8N
Annual rate of fertilizer N or biomass N, kg/ha
F e scu e g ra ss yi e ld , kg /h a
Table 1.10. Nitrogen efficiency ratios (NER) for biosolids from several studies.
Common
N rate for common
yield
Location Crop Year Biosolids yield Fertilizer Biosolids NER1 --- kg/ha ---
Biltmore Estate Liquid, applied:
Asheville, NC Fescue 1984 Spring & fall 3573 270 407 0.66 (Mays, 1988) 1985 Spring & fall
5858 270 365 0.74
Fall only 241 1.12
1986 Spring & fall
2621 270 576 0.47
Fall only 333 0.81
State of
Washington Fescue 1993 Heat-dried 6000 202 549 0.37
(Cogger, 2001) 1994 " 12900 336 689 0.49
1995 " 13100 336 816 0.41
1996 " 10900 336 547 0.61
1997 " 12100 403 518 0.78
1998 " 12100 403 633 0.64
1999 " 13000 403 721 0.56
1993 Dewatered 6000 202 619 0.33
1994 " 12900 336 618 0.54
1995 " 13100 336 739 0.45
1996 " 10900 336 473 0.71
1997 " 12100 403 506 0.80
1998 " 12100 403 614 0.66
1999 " 13000 403 662 0.61
Georgia Piedmont (King, 1972a, 1972b; Touchton,
1976) Coastal 1969 Liquid 6300 224 615 0.36
bermuda 1970 " 13200 358 944 0.38
(Residual effect) 1971 none 17210 224 4800 0.05
(Residual effect of biosolids applied to
bermuda)
Rye 1969 none 2260 140 1480 0.09
Rye 1970 none 2000 140 954 0.15
Warren Wilson
College Corn 1985 Liquid 6270 84 57 1.48
Swannanoa, NC 1986 “ 5420 168 122 1.38
(Mays, 1988)
Neuse River WTP Corn 1982 Liquid 8757 168 423 0.40
Raleigh, NC 1983 " 2079 84 504 0.33
(King, 1983)
1.
The same biosolids used in the fescue grass study at the Biltmore Estate were used on corn at Warren Wilson College, Swannanoa, NC (Mays 1988). Yield data are presented in Appendix Table B. The first year, corn yield was increased significantly by fertilizer N and biosolids as compared to the control but differences among fertilizer and biosolids rates were not significant. Yields at the low fertilizer N rate and the low biosolids rate were the same and based on those data the NER was 1.47 (Table 10). Results from the second year are shown in Figure 2. Again, biosolids were more effective in raising corn yields (NER=1.38) than was fertilizer N. Several factors may have contributed to these high NER values. As noted above, 56% of the biosolids N was in the NH4-N form. Secondly, the biosolids were injected below the soil surface, so NH3 volatilization was minimal. Also, as cautioned above, biosolids contain other plant macro- and micronutrients and these will stimulate crop growth if these elements are deficient in the soil. Finally, the injection process had a tillage effect, which might have benefited crop growth.
250 200
150 100
50 0
1000 2000 3000 4000 5000 6000 7000
Fertilizer N
Y = 1840 + 20N
1986
Biosolids
Y = 2260 + 26N
Fertilizer N or biosolids N applied, kg/ha
C
o
rn
g
ra
in
y
ie
ld
,
kg
/h
a
A study of corn response to fertilizer N or biosolids N was conducted at the Neuse River Wastewater Treatment Plant farm, Raleigh, NC from 1981 through 1983 (King 1983). Due to inadequate rainfall in 1981 fertilizer N and biosolids did not increase yields above that in the control (yield data are presented in Appendix Table C). In 1982 response to fertilizer N was linear, but with biosolids, yields did not respond above the lowest application rate (Figure 3). Therefore the slope of the response between zero and the lowest rate was used in NER calculations. NER was 0.4 in 1982 and 0.33 in 1983 (Table 9).
In this study, uptake of N by the corn crop was reported, so the N use efficiency (NUE, the percentage of the biosolids-applied N taken up by the crop) could be calculated. NUE decreased with increasing rate of biosolids-applied N (Figure 4.) During the dry years of 1981 and 1983 when crop growth was low, NUE was 10% or less. In 1982 when rainfall was plentiful and therefore yields were higher, NUE was much higher. Because of the lower rate of application of fertilizer N and the fact that the fertilizer N was water-soluble, NUE was always higher for fertilizer N than for biosolids N.
2000 1800 1600 1400 1200 1000 800 600 400 200 0 0 0 2000 4000 6000 8000 10000
12000 00 200 400 600 800 1000 1200 1400 1600 1800 2000
0 2000 4000 6000 8000 10000 12000
Fertilizer N Biosolids Y = 1030 + 7.5N
Fertilizer N Y = 3020 + 35N
Biosolids
1982
1983 (adequate rainfall)
(inadequate rainfall) Y = 2840 + 14N
Y = 820 + 2.5N
Fertilizer N or biosolids N applied, kg/ha
C o rn g ra in yi e ld , kg /h a
2000 1750 1500 1250 1000 750 500 250 0 0 0 10 20 30 40 50 60 70 Biosolids 1981 1982 N fertilizer 1983 1982 1981 & 1983
N applied, kg/ha
N it ro g e n u se e ff ic ie n cy ( N U E ), %
Figure 1.4. Nitrogen use efficiency (NUE) of fertilizer N and biosolids N applied to corn, Neuse River Wastewater Treatment Plant, Raleigh, NC. Data from King (1983).
In the studies discussed above, fertilizer N was applied at several rates. However, in studies discussed below, only one fertilizer N rate was used. This rate was usually the locally
1000 900
800 700
600 500
400 300
200 100
0 2000 3000 4000 5000 6000 7000 8000
Heat dried
Dewatered Fertilizer N
(202 kg/ha)
Y = 3420 + 4.7N
Y = 3460 + 4.1N
Fertilizer N or biosollids N applied, kg/ha
F
e
s
cu
e
g
ra
ss
y
ie
ld
,
kg
/h
a
1993
Figure 1.6. Relationship between N efficiency ratio (NER) and years of biosolids application to fescue grass, state of Washington. Derived from Cogger (2001).
4000 3500 3000 2500 2000 1500 1000 500 0 0 2000 4000 6000 8000 10000 12000 14000 4000 3500 3000 2500 2000 1500 1000 500 0 0 2000 4000 6000 8000 10000 12000 14000 1969 1970 Fertilizer N Biosolids Fertilizer N Biosolids
Fertilizer N or biosolids N applied, kg/ha
C o a st a l b e rm u d a g ra ss yi e ld , kg /h a
Figure 1.7. Response of Coastal bermudagrass to fertilizer N or biosolids N, Georgia Piedmont. Data from King (1972a)
8000 7000
6000 5000
4000 3000
2000 1000
0 0 2000 4000 6000 8000 10000 12000 14000 16000 18000
Cumulative biosolids N applied and annual fertilizer N applied, kg/ha
C
o
a
st
a
l
b
e
rm
u
d
a
g
ra
ss
yi
e
ld
,
kg
/h
a
1971
Biosolids Fertilizer N
(224 kg/ha)
Figure 1.8 . Response of Coastal bermudagrass to fertilizer N applied in 1971 and to the residual effect of biosolids N applied in 1969 and 1970. Data from Touchton (1976)
4000 3500 3000 2500 2000 1500 1000 500 0 0 500 1000 1500 2000 2500 3000 2000 1800 1600 1400 1200 1000 800 600 400 200 0 0 500 1000 1500 2000 2500 3000 1969 1970 Biosolids Fertilizer N (140 kg/ha) Fertilizer N (140 kg/ha) Biosolids
Fertilizer N applied to rye and biosolids N applied to Coastal bermudagrass each year, kg/ha.
R ye yi e ld , kg /h a
Figure 1.9. Response of rye over-seeded in Coastal bermudagrass to fertilizer N applied to the rye and to the residual effect of biosolids N applied to the Coastal bermudagrass each year. Data from King (1972b).
Table 1.11. Estimates of biosolids N efficiency ratio from various studies.
Nitrogen source
Total N efficiency
Location
& citation N P K Yield, kg/ha ratio (NER)
--- Cumulative yield --- Corn Soybean Cotton Annual application (4 years) (4 years) (3 years)
Alabama Control 0 0 0 12,000 9000 6000 ---
Piedmont Fertilizer 168 45 112 21,000 10,000 10,000 --- Giordano Biosolids 275 209 22 24,000 13,000 8000 0.61 (1981&1983)
Georgia
Corn (1 yr)
Piedmont Control 0 0 0 4,570 --- --- ---
Sims (1980) Fertilizer 217 20 74 10,100 --- --- --- Biosolids 820 530 122 11,270 --- --- 0.26
Minnesota Mean annual
Clapp (1994)
1974-1982 corn yield
Biosolids 700 --- --- 8,400 --- --- 0.33 Fertilizer 230 --- --- 8,000 --- --- ---
1983-1992
Biosolids 240 --- --- 8,300 --- --- 0.90 Fertilizer 215 --- --- 7,600 --- --- ---
3-yr mean seed cotton
Arizona Control 0 --- --- 2,657 --- --- ---
Watson (1985) Fertilizer 55 --- --- 3,187 --- --- --- Biosolids 361 --- --- 3,037 --- --- 0.15
Cumulative yield Corn Grain Soybean Florida
cumulative
application (5 yr)
Sorghum
(6 yr) (6 yr)
Lutrick (1982) Fertilizer 1760 330 660 18,000 24,000 --- --- Fertilizer 0 390 360 --- --- 15,000 --- Biosolids 3180 1270 100 16,000 23,000 15,000 0.55
Georgia Fescue, 2-yr mean
Piedmont Control 0 0 0 4,800 --- --- ---
Boswell (1975) Fertilizer 448 188 404 12,000 --- --- ---
A study in Nebraska with irrigated corn and rain-fed sorghum showed significant residual effect of biosolids on NER (Binder 2002) (Table 12).
Table 1.12. Nitrogen efficiency ratio (NER) of biosolids as determined from a field study with irrigated corn and rain-fed sorghum in Nebraska. Data from Binder (2002).
Irrigated corn Rain-fed sorghum Year N applied NER N applied NER
kg/ha kg/ha
1 532 0.40 309 0.39
2 0 0.27 0 0.17
3 0 0.07 0 0.11
4 0 0.0 4 0 0.04
Total 532 0.78 309 0.71
A regional project was sponsored by the Tennessee Valley Authority to demonstrate the value of biosolids at several locations in the Tennessee Valley (Mays 1988). For the locations shown in Table 13, fertilizer N was applied at rates recommended for local crop/soil conditions. However, the specific rates were not reported. Annual biosolids N rates ranged from 460 to 570 kg/ha. Generally, yields were similar with fertilizer N and biosolids N. However, biosolids were
superior to fertilizer N for wheat in 1986 and corn in 1985 at Jackson TN. In 1984 in Murry KY, soybean yield was greater with biosolids than with fertilizer but the yield was not greater than that in the control treatment.
Table 1.13. Response of wheat, corn, and soybean to fertilizer and biosolids applications. Data from Mays (1988).
Wheat Corn Soybean
Location Treatments 1984 1985 1986 1984 1985 1986 1984 1985 1986
Cullman AL kg/ha kg/ha kg/ha kg/ha kg/ha kg/ha kg/ha kg/ha kg/ha
Annual N from Control --- 538 c1 --- NSD
3324 b --- No significant differences (NSD) biosolids, kg/ha Fertilizer --- 1075 a --- 4892 a ---
Total: 570 Biosolids --- 1008 ab --- 5331 a ---
NH4-N: 200 Mean 2932 874 2218 907
Jackson TN Control --- 941 ab 1210 b 8844 b 6209 c 3387 b NSD 1344 b NSD
Annual N from Fertilizer --- 1142 a 1478 b 11,227 a 9032 b 8906 a 1680 ab biosolids, kg/ha Biosolids 1478 a 2218 a 10,600 ab 10,098 a 9283 a 1814 a
Total: 460 Mean 2580 1868
NH4-N: 78
Murry KY Control 1344 b 470 b --- No
significant differences
941 ab No significant differences Annual N from Fertilizer 1344 b 874 a --- 739 b
biosolids, kg/ha Biosolids 1747 ab 538 ab --- 1008 a
It should be stressed that NER is not necessarily the same as plant-available N (PAN). Generally PAN is estimated using a N budget to account for all the applied N. In laboratory incubation studies, PAN is simply the quantity of applied N that is converted to NO3-N during the study. In field studies, PAN is the quantity of biosolids N taken up by the crop plus the NO3 -N in the soil at the end of the growing season. In contrast, -NER is simply a function of yield. Values of PAN and NER can be contrasted in the experiment at the Neuse River Wastewater Plant at Raleigh (King 1983). PAN was estimated by determining the amount of N taken up by the crop and the amount of NO3-N in the soil at the end of the growing season. Table 14 shows PAN and NER resulting from an application of biosolids, surface applied at 9000 kg/ha and incorporated after drying. Crop and soil components of PAN are shown. Even the crop uptake portion of PAN is greater than the NER. Therefore, while NER is a measure of N efficiency in increasing crop yield, it may underestimate PAN. Underestimating PAN can lead to excessive biosolids rates and subsequent pollution of groundwater by nitrate.
Table 1.14. Comparison of plant-available N (PAN) and nitrogen efficiency ratio (NER) for biosolids applied to corn.
Data from King (1983).
Biosolids PAN
Year N applied In corn In soil Total NER kg/ha --- % of applied N ---
1982 588 46 5 51 0.4
Phosphorus
Studies designed to estimate the efficiency of biosolids P compared to fertilizer P are limited since over-application of P is a relatively recent concern. One study conducted in Northern Ireland compared yield response of spring barley to P from concentrated superphosphate
fertilizer and to P in biosolids (Christie 2001). Several rates of fertilizer and biosolids were used but yield was not increase beyond the lowest rate. Yield and P efficiency ratio (PER) are shown in Table 15.
Table 15. Response of spring barley to P from fertilizer or biosolids. Data from Christie (2001).
P applied Yield PER1 --- kg/ha ---
Control 0 3610 ---
Fertilizer 17 4510 --- Biosolids 38 4990 0.45
1 P efficiency ratio: fertilizer P rate/biosolids P
Tree Response
Forests can serve as an application area for biosolids. McKee and others (McKee 1986) applied liquid biosolids supplying 400 kg N/ha (170 kg NH4-N/ha) to loblolly pine trees in the upper Coastal Plain of South Carolina. During the 4 years of the study, they observed no significant effect on trees that were 3 years old when the biosolids were applied, primarily because of weed competition. Trees initially 8 years old or 28 years old increased in breast-height diameter and basal area but not in volume. Applying biosolids prior to planting tree seedlings increased growth but the increase was dependent on insect and weed control.
Another study on response of loblolly pine and sweetgum trees to commercial fertilizer and biosolids was conducted in barrow pits (South Carolina) and on spoil from kaolin mining (Georgia) (Berry 1987). After 10 years, tree height had responded to fertilizer but diameter and volume had not (Table 16). All three measurements were significantly increased by biosolids. Similarly, all measurements of sweetgum trees in barrow pits were increased by biosolids up to the rate supplying 680 kg N/ha. After 4 years, sweetgum trees growing on kaolin mine spoil responded to biosolids but not to fertilizer.
Although tree response to sludge was greater than response to commercial fertilizer on these disturbed sites, biosolids generally were not superior to fertilizer on undisturbed sites (data not shown).
Table 1.16. Response of loblolly pine and sweetgum trees to fertilizer or biosolids on disturbed areas. Data from Berry (1987).
Nutrient
Species Soil source N-P-K Height (H) Diameter (D) D2H
kg/ha cm mm cm3 x 10,000
Loblolly pine Barrow Control 0 265 c1 41 b 18 b (10 years after pit Fertilizer 56-24-47 454 b 68 b 32 b application) Biosolids 680-340-170 980 a 154 a 248 a
m
Sweetgum Barrow Control 0 0.6 c 3.6 b 0.2 c (10 years after pit Biosolids 340-170-85 4.1 b 8.6 a 3.6 b application) " 680-340-170 5.5 a 10.6 a 7.1 a " 1360-680-340 5.6 a 10.8 a 7.4 a
cm
Sweetgum Kaolin Control 0 76 b 17 b 0.03 b