121
THE IMPACT OF E-LEARNING ON STUDENTS
PERFORMANCE IN TERTIARY INSTITUTIONS
1
Oye, N. D.;
2A.Iahad, N.,
3Madar, M. J. and
4Ab.Rahim, N.
1, 2, 3,4Department of Information Systems
Universiti Teknologi Malaysia
Abstract— E-learning has become an increasingly popular learning approach in higher educational institutions due to the rapid growth of Internet technologies. E-learning is the use of information and communication technology (ICT) to enhance and facilitate teaching and learning. This study examines the application of e-learning model to explain acceptance of the e-learning technology within the academic settings. The study confirms that in order to foster individuals’ intention to use an e-learning, positive perception on e-learning use is crucial. By using linear regression analysis, the study verified that, while attitudes have influence on intention to use, the actual e-learning use has significant effect on students’ academic performance. E-learning use is associated with increased students’ academic performance. Recommendation was that, training and information sessions on e-learning need to focus primarily on how the e-learning technology can help improve the efficiency and effectiveness of students’ learning process.
Keywords- E-learning; Students’ academic performance; Pedagogy; Attitudes; Regression analysis
Introduction (Heading 1)
E-learning (EL) is the use of Information and Communication Technology e.g. Internet, Computer, Mobile phone, Learning Management System (LMS), Televisions, Radios and others to enhance teaching and learning activities. E-learning is a unifying term used to describe the fields of online learning, web-based training and technology delivered instructions (Oye , Salleh, & Iahad, 2010). EL has become an increasingly popular learning approach in higher educational institutions due to vast growth of internet technology. Nowadays E-learning has a competitive advantage and many universities have implemented it and this has impacts on students’ performance or GPA. However, still there are other universities and academic institutions that use very low interactive E-learning which is not enough to contribute to the performance of the students. In contrary to that, other higher educational institutions use highly interactive E-learning which directly improves students’ performance in general (Rodgers, 2008). Today technology is a tool used to remove geographical barriers and facilitates everybody to learn anytime and anywhere without the presence of the lecturer. The main purpose of E-Learning is to increase accessibility of education and reducing costs and time as well as improving
students’ academic performance. This approach of learning facilitates different students at different continents to attend the same classes almost at the same time. Nowadays, technology is becoming the medium for teaching and learning without being at university campuses. This technology enabled instructional method is aimed to improve quality of education and student academic performance.
It has been found that students in higher educational institutions that engaged in E-Learning, generally performed better than those in face-to-face courses. (Holley, 2002) found that students who participate in online/ E-Learning achieve better grades than students who studied traditional approach. As result of this finding E- learning is growing very fast and become popular and that is why many higher educational institutions are adopting to virtual learning system. E- Learning is widely used in many universities in the world today. In some universities, their E-learning does not add any value to the teaching and learning activities of the University and perhaps they do not investigate the impact of E-learning on student academic performance. Much research has not been done on the relationship of E-learning use and student academic performance. UTM has an E-learning site designed for teaching and learning using module software package, but is not fully utilized by both students and lecturers. The students in Universiti Teknologi Malaysia (UTM) that use E-learning may perform better than those who do not use it. This study will reveal the possible contributions of E-learning to students’ academic performance. This study is very important and will find out the relationship of E-Learning use and students’ academic performance in UTM.
122 1. Review of Literature
E-learning refers to the use of information and communication technology (ICT) to enhance and/or support learning in tertiary education. However this encompasses an ample array of systems, from students using e-mail and accessing course materials online while following a course on campus to programmes delivered entirely online. E-learning can be different types, a campus-based institution may be offering courses, but using E-learning tied to the Internet or other online network (Lorraine M.2007). What is E-learning? E-learning is an education via the Internet, network, or standalone computer. E-learning is basically the network-enabled convey of skills and knowledge. E-learning refers to using electronic applications and processes to learn. E-learning applications and processes include Web-based learning, computer-based learning, virtual classrooms and digital collaboration. EL is when content is delivered via the Internet, intranet/extranet, audio or video tape, satellite TV, and CD-ROM. E-learning was first called "Internet-Based training" then "Web-Based Training" Today you will still find these terms being used, along with variations of E-learning. EL is not only about training and instruction but also about learning that is tailored to individual. Different terminologies have been used to define learning that takes place online (Lorrain, 2007; Oye , Salleh, & Iahad, 2011).
E-learning and distance learning are not quite the same thing but are different. The basic thing that distinguishes distance education is the physical separation of the students from the teacher/instructor and the class room. E-learning, nonetheless, is considered to be as part of the classroom environment from the beginning. The early use of computers and ICT were geared to support the classroom instructional methods. Gradually, as more and more personal computers
became available, the thought of online classes was investigated and explored by some pioneering Colleges and Universities. The early endeavors at distance education were hampered by resistance from traditionalist within the education field (Heeger, 2007).
According to European School net, “ E-learning is an ever-expanding field which is growing more popular and more recognized as time progresses so much, that an organization called “European School net” is distributing what are known as the “E-learning Awards” for the fourth year in a row”. European School net is an international association which encourages the use of E-learning throughout all education levels, starting with the primary schooling up to higher educational institutions. The organization provides information for all parties participated in the educational process including students, teachers, and educational professionals on the diverse facets of teaching and learning with technology (Balannskat, Blamire, & Kefala, 2006).
In most developing countries the implementation of learning was made in practice and of the early adopters of E-learning are Malaysia, Pakistan and etc. Specifically, in Malaysia context, the ministry of education has set clear policy for the implementation of E-learning in the public sectors and invested in many higher educational institutions to enhance teaching and learning by using technology (Roger Blamire, 2006). There are many countries that are facing scarcity of ICT infrastructure and knowledge; mostly they are the third world countries in which the usage and implementation of E-learning are still at the infant stage. Most African institutions widely use traditional approach of education. Nevertheless in 2006 there were initiatives regarding ICT implementation in African Universities although very view countries have the capability of an effective ICT usage and E-learning implementations (Balannskat et al., 2006).
123
Year Place and Description
1837 Sir Isaac Pitman developed the most widely used system of shorthand, Pitman Shorthand, for postal correspondence courses using Great Britain’sPenny Post
1906 The University of Wisconsin-Extension was founded; the first true distance learning institution
1909 The Machine Stops a short story by E.M.Forster, which describes an audio/ video communication network being used to deliver a lecture on Australian music to a remote
audience
1920s Sidney Pressey, an educational psychology professor at Ohio State University develops the first "teaching machine." This device offered drill and practice exercises, and multiple
choice questions
1956 Gordon Pask and Robin McKinnon-Wood develop SAKI, the first adaptive teaching system to go into commercial production
1960 PLATO (Programmed Logic for Automated Teaching Operations) system developed at the University of Illinois at Urbana-Champaign.
1965 SUNY Learning Network begins in 1994. Traditional faculty were hiredto create online courses for asynchronous delivery into the home viacomputer. Each faculty member worked
with an Instructional design partner to implement the course. SLN now supports over 3,000 faculties, 100,000 enrolments on 40 of the State University of New York's campuses.
1994 Bob Jensen and Petrea Sandlin publish "Electronic Teaching and Learning: Trends in Adapting to Hypertext, Hypermedia, and Networks in Higher Education 1995 The Stanford Centre for Professional Development (SCPD, formerly SITN) launches
Stanford Online, which "was the first university internet delivery system incorporating text and graphics with video and audio, using technology developed at Stanford
2004 OLAT 3.0 (Online Learning And Training. It is a web application. OLAT is free software/open source, and has been developed at the University of Zürich) released. This is
the first OLAT release that is entirely written in Java.
2005 Microsoft release Microsoft Class Server 4.0
2006 Blackboard is granted US patent 6988138 relating to "Internet-basededucation support systems" claiming priority
2007 Software Freedom Law Centre was successful in its request that the USPatent and Trademark Office re-examine the E-learning patent owned by Blackboard Inc.
2008-2009 E-learning has been extensively reached all parts of the world and donations of distance learning/E-learning scholarships and trainings were conducted in many developing countries.
2010-2011
124 In the early 1990s, many companies were using
videotape-based training for their employees. At this point, the industry represented a very small market and lacked the 'scalability' that is so important in today's applications (Cooke, 2004). The idea of putting training on video was a good idea, though it was lacking in a few areas (1) Customization based on needs of users, (2) Expensive to maintain and (3) Could not be upgraded easily. There is also the issue of employees having to hunt down the proper equipment in order to watch the videos. These videos often had limited interactions which lead to the nearly impossible task of tracking progress and assessment (Cooke, 2004) . Since it was obvious that video was not the best solution, a new form of training evolved, CBT or Computer Based Training. Windows 3.1, Macintosh, CD-ROMs, PowerPoint marked the technological advancement of the Multimedia Era(Kiffmeyer, 2004), CD-ROMs could be cheaply produced so that the problem of checking in and out videos was eliminated. Employees would also be able to simply pop in a CD to their personal computer at their desk and complete the training.
One of the first innovations in actual e-learning was the LMS or Learning Management System. The first Learning Management Systems (LMS) offered off-the-shelf platforms for front-end registration and course cataloguing, and they tracked skills management and reporting on the back-end (Clark & Heaney, 2003). This enabled schools and companies to place courses online and be able to track students' progress, communicate with students effectively and provide a place for real-time discussions. The E-classroom evolved shortly after, which are ...web-based synchronous events with integrated CBT and simulations(Clark & Heaney, 2003). E-classrooms are often called Live Instructor-Lead Training or ILT. Live instructor-led training (ILT) via the Web can be combined with real-time mentoring, improved learner services, and up-to-date, engaging "born on the Web" content to create a highly-effective, multi-dimensional learning environment (Kiffmeyer, 2004). E-learning has come a very long way since its early days of being text-based via the Web or CD-ROM.
2.
E-learning and Pedagogy
E-learning can be viewed as an alternative to the face-to-face teaching method or as a complement to it. E-learning usually allows the student a greater choice as well as responsibility for their own learning (Collis, 2008; Oye et al., 2011). E-learning can change the methods of learning and has the capability to overcome the barriers of time, distance, and economics (Vrasidas & McIsaac, 2000). E-learning can be viewed as "disruptive technology" and as a new paradigm for learning (Christensen, Anakwe, & Kessler, 2001). Disruptive technologies look at problems in completely new and creative ways. E-learning challenges the traditional ways of teaching and learning, enables new alliances between various educational and commercial entities, and presents new ways of solving old problems. For
example, the role of teachers is likely to change from importers of knowledge to facilitators of knowledge gaining process.
Synchronous interaction, such as chat and conferencing requires the "physical" or "virtual" presence of participants at the same time. This has the benefit that collaboration is done in real time and delays of communication are avoided. Asynchronous, such as email, blogs, and threaded discussions have the advantage of allowing the students to access the learning resources any time. Asynchronous mode of communication is useful when parties have to communicate and share information (i.e. intermediate software progress modules) between the interaction sessions, it is important to reflect and discover.
Asynchronous interaction is also beneficial when students are geographically dispersed and it is difficult to assemble them at the same time. Reflection can reinforce and enhance learning. Reflection is a form of mental processing – a form of thinking – which we use to fulfill a purpose or to achieve some anticipated outcome. It is applied to relatively complicated or unstructured ideas for which there is no obvious solution; the equivocality resulting from no "single" obvious solution to a software design project requires additional processing of knowledge and understanding and possibly display of emotions (Moon, 1999). Group reflection is an extremely important part of helping students retain what they learn, provide feedback on their performance, and guide them on how to improve their performance on the next group situation (Educators, 2006). 3. E-learning at UTM
E-learning in UTM is generally defined as “the application of ICT to advance the effectiveness of the teaching and learning process” (UTM, 2005). According to (Soyemi, Ogunyinka, & Soyemi, 2012), there is no doubt that ICT use in the classroom increase students’ motivation to learn, engage in learning and give independence in learning. Evidence shows that there is a correlation between using ICT in schools and students academic achievement and performance. This system consists of course content, lecture notes, communication tools, quizzes, tests and assignments and can be accessed through the network. UTM uses a moodle to software and its E-learning system is categorized as low interactivity since it content is downloadable at any time, this is a synchronize E-learning. Moodle is an Open Source Course Management System (CMS), also known as a Learning Management System (LMS) or a Virtual Learning Environment (VLE). It has become very popular among educators around the world as a tool for creating online dynamic web sites for their students. To work, it needs to be installed on a web server somewhere, either on one of your own computers or one at a web hosting company.
4.1 Academic Performance
125 literature in this area, the dialogue tends to be centred along
four major themes: (1) meaning and measurement, (2) summative vs. Formative measurement, (3) underachievement and overachievement, and (4) predictors of performance. This section seeks to review the issues centred on these themes. (Lavin, 1965) gives a valuable definition of the term academic performance: “As traditionally used, the term ‘academic performance’ refers to some method of stating or expressing a student’s academic rank. Generally this is a grade for a course, an average for a group of courses in a particular subject area, or an average for all courses expressed on a 0-to-100 or other quantitative scale.”
4.2 Performance Calculation in Malaysia
Calculating and measuring students’ academic performance is what students have learned all the way through the course. This can be accomplished in different ways, based on the course objectives and how student academic performance will be measured. Assignments, class participation papers and tests are all traditional methods for assessment that can be created and recorded within Blackboard. Collection, projects and presentations are also ways that students can express their comprehension and mastery of course material and these too can be implemented within Blackboard. In general, whether it is E-learning or traditional E-learning approach, academic performance is measured in the same way. Different institutions and universities in the world calculate academic performance (GPA) in different ways but similar. This paper follows the international grading system and Malaysian grading system particularly in UTM. Grades are standardized measurements of varying levels of comprehension within a subject area. Grades can be assigned in letters (for example, A, B, C, D, E or F), as a range (for example 1.0–4.0), as descriptors (excellent, great, satisfactory, needs improvement), in percentages, as It is common in some post-secondary institutions in some countries, as a Grade Point Average (GPA). The GPA can be used by potential employers or further post-secondary institutions to assess and compare applicants. A Cumulative Grade Point Average is a calculation of the average of all of a student's grades for all semesters and courses completed up to a given academic term, whereas the GPA may only refer to one term. Malaysia and other universities in the region, higher education institutions usually apply the U.S. American grading system.
4. Methodology
The primary objective of the study is to confirm the impact of e-learning on students’ academic performance. The study was conducted in the faculty of Computer Science and Information Systems at the Universiti Teknologi Malaysia (UTM). The total questionnaire returned out of 300 was 215. 23% of the respondents were female students while 77% were male. A simple linear regression analysis was conducted to accept or reject the five null hypotheses stated.
5.1 Hypotheses:
H01: Perceived use of E-learning has a significant effect on the attitude towards using E-learning.
H02: Attitude towards using E-learning has significant influence on the behavioral intention to use E-learning.
H03: Perceived use of E-learning has significant influence on behavioral intention to use E-learning.
H04: Perceived use of E-learning and behavioral intention to use have significant effect on the actual use of E-learning.
H05: Actual use of E-learning has significant effect on student academic performance.
5. Reliability Analysis
Measurement validity in terms of reliability and construct validity was evaluated. The reliability analysis was conducted in order to ensure the internal validity and consistency of the items used for each variables. (Zhang, Li, & Sun, 2006), recommended that Cronbach alpha values from 0.6 to 0.7 were deemed the lower limit of acceptability. An alpha of more than 0.7 would indicate that the items are homogeneous and measuring the same constant.
Table 2: Cronbach’s Alpha (Reliability)
Scale Cronbach’s alpha
Academic performance 0.89 Actual Use of E-learning 0.89 Perceived ease of use 0.87 Perceived usefulness 0.85
Attitude towards using 0.85 Intention to use 0.83
126 Student Academic Performance (GPA)
Another important category which is also one of the most important elements in the research is the academic performance of the students (GPA). Figure 1, present the respondents by their GPA.
Figure 1: Respondents by GPA
The above pie chart introduces the percentage distribution of respondents’ academic performance (GPA). The respondents’ GPA was categorized in to two categories by scale. 61 percent of the respondents have the GPA between 3.60-4.00, while 39 percent of the respondents’ GPA is between 3.00-3.50, this is only semester based data and students were asked to give their current GPA.
6.2 Linear Regression Analysis
Linear regression analyzes the relationship between two variables, X and Y. For each subject (or experimental unit), you know both X and Y and you want to find the best straight line through the data. In linear regression matrix there are five parameters, R2 (the coefficient of the correlation or the relation) which shows the strength and direction of the relationship. P- Value indicates the significant of the relationship, P must always equal or less than 0.05 for the relationship to be significant. Beta, β which is another parameter in linear regression shows the slope
and the direction of the relationship, standard error of β
indicates the percentage of error that can happen. The smaller the standard error of β the less likely error can happen while t statistics is the coefficient divided by its error. The standard error is an estimate of the standard deviation of the coefficient, the amount varies across cases. It can be thought of as a measure of the precision with which the regression coefficient is measured. If a coefficient is large compared to its standard error, then it is probably different from 0.
6. Perceived Use of E-learning and Attitude Towards Using E-learning
In order to test the linear relationship between students’ perception on learning use and attitude towards use of learning, a simple linear regression was used. Perceived E-learning use was regressed upon students’ attitudes toward use of E-learning. The perceived use of E-learning was taken as independent variable while attitude towards using E-learning of the students was taken as dependent variable. The results of the regression are shown Table 3.
Table 3: Regression results for Hypothesis (H01)
As shown in Table 3, the perceived E-learning use had a significant effect on students’ attitudes towards using the E-learning. The relationship is significant at level p = 0.003 while R2 (.684) which is the coefficient of the regression shows strong relationship between the variables. Therefore, (H01) was accepted. The coefficient of the regression
determines if the relationship is accepted or rejected. The greater the value of R2 the stronger the relationship. The positive value of β=(0.723) shows the direction of the relationship. From this table it can be inferred that perceived E-learning use influence on student attitudes towards using the E-learning.
7.1 Perceived Use of E-learning and Behavioral Intention to Use
Variable β Standard Error of β T P R2
127 Table 4: regression results for H02
According to the result displayed in the above matrix there is a strong and positive relationship between students’ perception and their behavioral intention to use E-learning. The coefficient of the regression (R2) is .758; this means that the perception of E-learning use had statistically significant influence on the behavioral intention to use. The larger the R2 value, the higher the influence. Therefore, H02 was accepted. Based on the data in the table above, the relationship between the two variables are statistically significant. P = 0.002 which indicates that the hypothesis is
accepted. The β has a positive value (0.549) showing the relationship is positive as it indicates the direction. We conclude that perceived E-learning use increase students’ behavioral intention towards using E-learning.
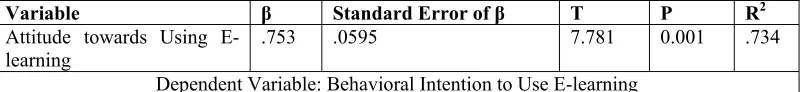
7.2 Attitude Towards Using E-learning and Behavioral Intention to Use
Another regression analysis was conducted to test H03 regarding whether the perceived E-learning use has significant influence on behavioral intention to using E-learning.
Table 5: Regression results for H03
As you can see from the table above all the parameters are indications of the significance of the relationship between the attitude towards using the E-learning and the behavioral intention to use. The result shows that, the coefficient of the regression (R2) is .734 which means that attitude toward using has significant effect on behavioral intention to use. This relationship is statistically significant as P =0.001, while β has a positive value showing us the direction of the relationship. Therefore, H03 was accepted.
7.3 Perceived E-learning Use and Behavioral Intention to Use by Actual System Use
Hypothesis 4 was also tested through a third regression model with perceived E-learning use and behavioral intention to use upon actual E-learning use. Stepwise regression was performed in which perceived E-learning use entered in step one and behavioral intention entered in step two. Results for H04 and H05 are presented in Table: 6.
Table 6: Regression results for H04
The perceived E-learning use and behavioral intention to use had significant effect on E-learning actual use, with p = 0.001 and 0.002. The effect of perceived E-learning use and behavioral intention to use explains 56.7% of the variance of actual usage by the students. The coefficient of the regression R2=0.567 indicates the strength of the relationship while the value of β demonstrates the direction of the relationship depending on its positive and the negative value. P value determines the acceptance and the rejection of the hypothesis, the lower value of P the greater the significance of the relationship. Therefore, we
concludes that both perceived E-learning use of the students and their behavioral intention to use have significant effect on students’ actual E-learning use.
7.4 Actual E-learning Use and Student Academic Performance
Again a separate linear regression was used to test the relationship between actual E-learning use of the students and their academic performance. Actual E-learning use of the students was taken as independent variable while the dependent variable was the student academic performance or GPA.
Table 7: Regression results for H05
Variable β Standard Error of β T P R2
Perception of E-learning use .549 .062 12.225 0.002 .758 Dependent Variable: Behavioral Intention to Use E-learning
Variable β Standard Error of β T P R2
Attitude towards Using
E-learning .753 .0595 7.781 0.001 .734
Dependent Variable: Behavioral Intention to Use E-learning
Variable β Standard Error of β T P R2
Perceived E-learning use .765 .045 12.6 0.002
Behavioral intention to use .654 .052 10.9 0.001
.567
Dependent Variable: Actual E-learning Use
Variable β Standard Error of β T P R2
Actual E-learning use .749 .0425 13.15 0.001 .559
128 As presented in Table 7, actual E-learning use had a
significant influence on students’ academic performance. (β
= .749; p = 0.001). Thus, H05 was accepted. Therefore, we concludes that the more the students use the E-learning the better academic performance they have.
7.5 Relationship and Hypothesis Test
To simplify for the reader to comprehend the Hypothesis test, the researcher summarized the relationship
test in the following Table 8.This table consists of three columns; the first column shows the Hypothesis in sequential manner, the second column shows the relationship that has been hypothesized and the third column presents the regression results required to ensure whether the hypothesis is accepted or rejected.
Summary for hypotheses testing (H01 to H05)
In summary, the table shows the hypothesis test in a very clear and simple way. Figure 2, uses the arrows to show the direction of the relationship and the value labeled on the arrow is the coefficient of the regression or the results.
Results Hypothesis Relationship Tested
R2 P
H01 Perceived use of E-learning has a significant effect on the attitude
towards using E-learning
0.684 0.003
H02 Perceived use of E-learning has a significant effect on the
behavioral intention to use E-learning
0.758 0.002
H03 Attitude towards using has significant influence on the behavioral
intention to use E-learning
0.734 0.001
H04 Perceived use of E-learning and behavioral intention to use have
significant effect on the actual use of E-learning 0.567 0.002 0.001
H05 Actual use of E-learning has significant effect on students’
academic performance 0.559 0.001
Perceived of E-learning Use EL
Behavioral Intention to Use EL R2 = .684 R2 = .734 Attitude toward
Using EL R2 = .758
Actual E-learning Use EL R2 = .567
Academic performance
R2 = .559 H03 (β = .749; p=0.001).
H05(β = .559; p =0.001). H04(β = .756; p=0.002).
H01 (β = .723; p=0.003). H02 (β = .749; p=0.002).
129
7.
Discussion
This study examined the relationship of E-learning use and students’ academic performance as well as proposing model in the learning context. The relationship of E-learning and academic performance was revealed. Based on the data collected. The actual use of E-learning has significant effect on students’ academic performance (GPA). This result matches the findings of longitudinal study that examined the student engagement in the E-learning process and the impact on their grades (Rodgers, 2008). The study finds that greater E-learning engagement leads to better academic performance. Rodgers used course grade as student academic performance while this study used the grade point average of the students (GPA) as academic performance. The result shows that perception on E-learning use is important in determining intention to use, actual use and attitudes towards use which reflects on student academic performance. In agreement with what TAM postulates, perceived usefulness was found to have significant influence on students’ intention to use the technology (Davis, 1989). Similarly both attitudes and perception have significant effect on intention to use which also confirms that intention and perception have significant influence on actual use of E-learning of the students. While Davis study focused on E-learning technology acceptance, in contrary, this study focuses on the overall influence of E-learning use on student academic performance.
8. Conclusion
E-learning has become an increasingly popular learning approach in higher educational institutions due to the rapid growth of Internet technologies. This study mainly focuses on the relationship of students’ use of e-learning and their academic performance. The results from the regression analysis using 215 students studying at faculty of computer science and information systems shows that the use of E-learning improves students’ academic performance (GPA).The study also examines the application of e-learning model to explain students’ acceptance of the e-learning technology within the academic settings. The findings confirm that in order to foster individuals’ intention to use an e-learning, positive perception on e-learning use is crucial. One of the most important occurrences is that both perception and intention to use have significant effect on actual e-learning use. While attitudes have influence on intention to use, the actual e-learning use has significant effect on students’ academic performance. The figures and tables presented are the representation of the interrelationship between e-learning use by students and students’ academic performance. E-learning use is associated with increased students’ academic performance, while perception and behavioral intention are associated with actual use of e-learning. Recommendation was that, training and information sessions on e-learning need to focus primarily on how the e-learning technology can help improve the efficiency and effectiveness of students’ learning process.
A. Acknowledgement
B. The authors would like to thank all authors that their papers are quoted. In addition, the authors gratefully acknowledge UTM, Research Universiti Teknologi Malaysia for their support and encouragement.
Reference
Balannskat, A., Blamire, R., & Kefala, S. (2006). A review of studies of ICT impact on schools in Europe.
European Schoolnet.
Christensen, E. W., Anakwe, U. P., & Kessler, E. H. (2001). Receptivity to distance learning: The effect of technology, reputation, constrains, and learning preferences. Journal of Research on Computing in
Education., 33,, 263-279.
Clark, L., & Heaney, P. (2003). Author Online: Using Asynchronous Computer Conference to Support
Literacy,. British Journal of Educational Technology,, 34(1), 57-66.
Collis, B. (2008). Pedagogy 2.0 : Learning by contribution. Keynote Presentation, Technology Supported learning in the 21st Century: Issues and paradigm
in transformative tertiary education. [Electronic Version]. Retrieved June 2008., Cooke, M. (2004). Clomedia: The evolution of e-learning
[Electronic Version]. Retrieved June 2007., Davis, F. D. (1989). Perceived usefulness, perceived ease of
use, and user acceptance of information technology. MIS Quarterly, 13, 319-340. Educators, V. M. (2006). A Guide to the Concept on
educators virtual mentors. [Electronic Version]. Retrieved December 2006.,
Heeger, A. G. (2007). A close look at distance learning,. Distance Learning Today,, 1(2), 1-13. Holley, D. (2002). "Which room is the virtual seminar in
please?" Education and Training,, 44(3), 112-121. Kiffmeyer, M. (2004). Knowledge Management: The
revolution of e-learning. [Electronic Version]. Retrieved June 2007.,
Lavin, D. E. (1965). The Prediction of Academic Performance: A Theorretical Analysis in Review of
Research. New York, N. Y. : Russell Sage Foundation.
Lorrain, M. (2007). Strategies to Engage Online students and Reduce Attrition Rates. [Electronic Version].
The Journal of Educator Online. Retrieved December 2007.,
Moon, J. (1999). Learning Journals : A handbook for academics, students and professional development:
London: Kogan page.
Nunnally, J. (1978). Psychometric Theory. New York: McGraw-Hill.
Oye , N. D., Salleh, M., & Iahad, N. A. (2010). Holistic E-learning in Nigerian Higher Education Institutions.
Journal of Computing, 2(11), 20-26. Oye , N. D., Salleh, M., & Iahad, N. A. (2011). Challenges
130 Based on the Experience of Developed Countries.
International Journal of Managing Information Technology, 3(2), 39-48.
Rodgers, T. (2008). Student Engagement in the E-learning process and impact on their Grades:. International
Journal of Cyber Society and Education., 1(2), 143-156.
Soyemi, J., Ogunyinka, O., & Soyemi, O. B. (2012). Integrating Self--paced E-learning with Conventional Classroom Learning in Nigeria Educational Sysytem. Mediterranean Journal of
Social Sciences., 3(4), 127-133. Vrasidas, C., & McIsaac, M. S. (2000). Principles of
Pedagogy and evaluation for web-based learning. Educational Media International, 37(2), 105-111. Zhang, P., Li, N., & Sun, H. (2006). Affective Quality and
Cognitive Absorption: Extending Technology Acceptance Research. Paper presented at the The
Hawaii International Conference on System Sciences.
Authors – Bibliography
[1]N.D.Oye, receive his M.Tech OR (Operations Research) degree from the Federal University of Technology Yola- Nigeria in 2002. He is a lecturer in the department of Mathematics and Computer Science in the same University (for the past 15yrs). At the moment he is a Phd student in the department of Information Systems in the Faculty of computer Science and Infor-mation systems at the Univeristi Teknologi Malaysia, Skudai, Johor, Malaysia. +60129949511,
[2] Noorminshah A. Iahad, PhD
She did her PhD at the School of Informatics, The University of Manchester. She worked with Professor Linda Macaulay from the Interactive Systems Design research section in the same school and Dr George Dafoulas from the School of Computing Science, Middlesex University. Her research is on investigating interaction patterns in asynchronous computer-mediated-communication. Her work includes analysing threaded discussion transcripts from the discussion feature of a well known Leaning Management System: WebCT. FSKSM, UTM 81310 Skudai, Johor, Malaysia.Email : [email protected] ,
[email protected],Office : +607 5532428 [3] Madar, M. J.
Master Student in the Department of Information Systems. UTM, Skudai, 81310, Johor Malaysia. +60177112525, [email protected]