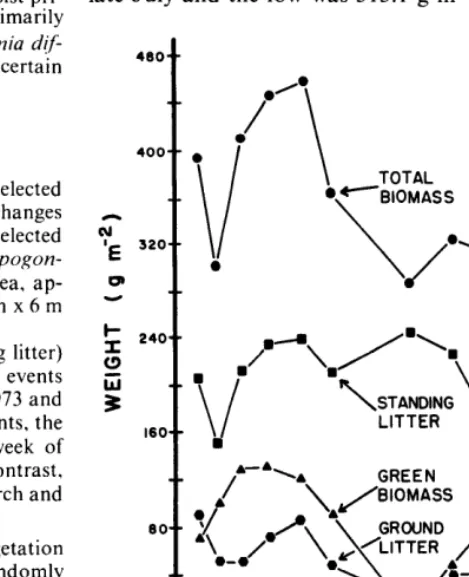
Net aerial primary production of an Andropogon Paspalum grassland ecosystem.
Full text
Figure


Related documents
The proximal portion of the left main bronchus appears compressed (white arrow), however the distal portion appears normal. Collapse-consolidation of the left lower lobe
[5] reported that in 145 female patients, including anorexia nervosa patients, obese pa- tients, and healthy normal weight subjects, the plasma irisin levels are significantly
Indeed, we found that participants with self-reported depressive symptoms had higher inflammation and oxidative stress biomarkers, and poorer sleep quality compared to those
1 Image of the agarose gel of genomic DNA (gDNA) ran by electrophoresis extracted from 17 tissue samples of Opuntia Mill., using the improved extraction method (Promega ™ 1 kb
This study demonstrates that regulation of SCD1 gene expression may play a role in control of obesity by citrus flavonoids and that rat primary hepatocytes are
The protein expression levels of c-Jun and c-Fos were significantly lower in the DHA/ EPA groups compared to the HFC group ( p < 0.01), meanwhile supplementation with a DHA/EPA
Series of 3-[Benzimidazo- and benzothiadiazoleimidazo-(1,2-c)quinazolin-5-yl]-2H-chromene- 2-ones 6a-6f & 7a-7f of Chapter-II, Section-A was evaluated for their
From the three graphs integral result with midpoint rieman sum method can be seen the smaller value of Δt generate integration resolution and data acquisition from the
