Volume 2008, Article ID 867959,13pages doi:10.1155/2008/867959
Research Article
Maximising the System Spectral Efficiency in
a Decentralised 2-Link Wireless Network
Sinan Sinanovi´c,1Nikola Serafimovski,2Harald Haas,1and Gunther Auer3
1Institute for Digital Communications, School of Engineering and Electronics, The University of Edinburgh, Edinburgh EH9 3JL, UK
2School of Engineering and Science, Jacobs University Bremen, 28759 Bremen, Germany 3DoCoMo Euro-Labs, 80687 M¨unchen, Germany
Correspondence should be addressed to Sinan Sinanovi´c,[email protected]
Received 1 June 2007; Revised 19 November 2007; Accepted 13 February 2008
Recommended by Ivan Cosovic
This paper analyses the system spectral efficiency of a 2-link wireless network. The analysis reveals that there exist three operating
points that possibly maximise the system spectral efficiency: either both links transmit with maximum power simultaneously or
one single link transmits with maximum power while the other is silent. The impact of the chosen multiple access scheme on the
system spectral efficiency is also studied: simultaneous transmission or sequential access where the two links share the medium
by dedicated time/frequency slots without causing interference. An exhaustive numerical search over a wide range of channel
realisations quantifies the gains in system spectral efficiency when choosing either the optimal, single, simultaneous, or sequential
medium access. Furthermore, issues regarding the power efficiency are addressed. Finally, the restriction to a 2-link network is
relaxed by introducing background interferers, reflecting a multiple link scenario with one dominant interferer. Simulation results indicate that increasing background interference reduces the advantage of sequential over simultaneous transmission.
Copyright © 2008 Sinan Sinanovi´c et al. This is an open access article distributed under the Creative Commons Attribution License, which permits unrestricted use, distribution, and reproduction in any medium, provided the original work is properly cited.
1. INTRODUCTION
While spectrum is typically regarded as a scarce resource,
leading to tremendous efforts to efficiently utilise the
dedicated spectrum, measurements indicate that major parts of the spectrum are greatly underutilised [1]. This dilemma, which is attributed to the static and exclusive allocation of dedicated frequency bands to specific systems and/or operators by governmental regulators, has inspired
a new research field of dynamic spectrum sharing [2].
However, with various operators sharing the same spectrum, interference mitigation through sophisticated frequency and network planning may no longer be feasible.
One of the key challenges for wireless systems that are decentralised in nature and/or operate in license exempt spectrum is the potential of excessive interference caused by simultaneous transmissions of two (or more) competing radio links [3–5]. In particular, [3] identifies transmit-power control and interference management as one of the three fundamental spectrum-sharing tasks.
In light of the above, the capacity analysis of wireless networks has often been based on asymptotic bounds, idealised assumptions, or implementation of particular transmission schemes. In this paper, we consider a simple case of two simultaneously communicating links, so to derive the optimum power allocation that maximises the sum capacity in a closed form. We demonstrate that there exist three operation modes that possibly maximise the
system-spectral efficiency: either both links communicate
simultaneously all with maximum power, or one single link transmits with maximum power while the other link is silent. This extends the findings of [9] in the way thatexact
conditions are derived that determine the optimum selection of active links, as a function of the channel characteristics and the maximum available transmit power. To this end, an important observation reported in this paper is that the maximum available transmit power significantly impacts the particular resource allocation strategy that maximises the network capacity. Simulation results, averaged over a wide range of channel realisations, quantify the attainable
system spectral efficiency considering the optimum
trans-mission mode that chooses between single and simultaneous transmission. As the optimum selection between single and simultaneous transmission requires full system knowledge about the channel conditions, we also assess the performance when transmitters have partial or no channel knowledge.
As power allocation affects not only the mutual interfer-ence to/from competing links, but also the connectivity of the network, resource allocation and link adaptation should be jointly optimised, across the traditional boundaries of system layers [12]. To this end, the problem of accessing one resource unit, where the wireless medium can be either accessed simultaneously or one link is refused access to the channel, is extended to a multiple access scenario, where transmissions may also be scheduled sequentially in mutually orthogonal time-frequency slots. Moreover, issues regarding power-constrained wireless networks are also addressed. One interesting result is that, in case all nodes transmit with the same power, sequential transmission is always more power efficient than simultaneous transmission in terms of system spectral efficiency per Watt in bit/s/Hz/W, irrespective of the channel conditions and the available transmit power.
The restriction to a 2-link network is relaxed in the final part of this work. As a scenario where two links compete for resources in perfect isolation from any other transmission is unlikely to occur in practice, a number of additional links are inserted to produce background interference. By doing so, the findings for the 2-link network are extended to reflect a more realistic multiple link scenario with one dominant interferer.
The remainder of this paper is organised as follows. After introducing the optimisation problem inSection 2, the optimum power allocation that maximises the system spec-tral efficiency is derived inSection 3. Furthermore, optimal
transmission modes in terms of the spectral efficiency per
Watt, as well as under a constant total power constraint, are investigated. In Section 4, the distribution of channel realisations for users that are uniformly distributed on a disk is derived. To complement the analysis, simulations
Interference
Rx1
Tx1
Rx2
Tx2 L11
L12
L21
L22
Figure1: 2-link wireless network. Solid and dashed arrows indicate intended communication links and interference, respectively.
are carried out over a wide range of channel realisations in Section 5, including a study of background interferers. Finally,Section 6draws the conclusions, and relates our work to dynamic spectrum sharing as well as power-constrained networks.
2. PROBLEM STATEMENT
We consider a 2-link communication scenario where nodes Tx1 and Rx1 as well as nodes Tx2 and Rx2 form a link, as
shown inFigure 1. If two links transmit with powersxand
y at the same time, their communication is corrupted not
only by noise, but also by mutual interference. It is assumed that the two receivers treat interference as additive Gaussian noise. As the utility for the sum capacity, we choose the system spectral efficiency, which is given by
C(x,y)=log21 +γ1
+ log21 +γ2
, (1)
where
γ1=L21 L11 ·
x
y+NL21, γ2= L12 L22·
y
x+NL12 (2)
denote the signal-to-interference-plus-noise ratio (SINR) at receivers Rx1 and Rx2. Moreover,Li j denotes the path loss
between transmitter Txiand receiver Rxj,i,j ∈ {1, 2}, and
Naccounts for additive white Gaussian noise (AWGN).
In case the transmit powers of both links are different from zero,x,y > 0, the system spectral efficiencyC(x,y) in (1) applies forsimultaneous accesswhere both links are active at the same time. When eitherx=0 ory=0, one single link is active, referred to assingle transmission. The corresponding spectral efficiency becomesC(x, 0) orC(0,y).
The objective is to find values of transmit powers,x,y∈
[0,P], whereP is the maximum available power, for which
C(x,y) in (1) is maximised:
Cmax= max
x,y∈[0,P]C(x,y). (3)
sequential transmission the optimum power allocation is to
transmit with maximum power, x = y = P, its spectral
efficiency is given by
The total available system powers, for simultaneous mission on the one hand and single and sequential trans-missions on the other, are 2PandP, which implies that the comparison in their performance is not fair. To address this issue, a fixed power constraint is introduced, in the way that the power allocation for simultaneous transmission is to be optimised such that the overall system power is constant:
x+ y = P. This translates to the following utility for the selection of the optimum multiple access scheme for equal time-sharing scenario:
where ε > 0 accounts for the minimum transmit power
for simultaneous medium access, so that single transmission
with C(0,P) or C(P, 0) is not allowed. The minimum
transmit powerεis introduced to make the comparison (5)
meaningful, as ε > 0 ensures that both links are served
simultaneously.
3. SYSTEM SPECTRAL EFFICIENCY ANALYSIS
In the following, the power allocation that maximises the system spectral efficiency (3) is derived inSection 3.1. Exact conditions for which simultaneous and single transmissions are preferable are derived in Section 3.2, and constraints for a constant system power are considered inSection 3.3. Finally, the problem of choosing between sequential and simultaneous transmission (5) is addressed inSection 3.4.
3.1. Optimum power allocation
In order to determine the power allocation such thatC(x,y),
x,y∈[0,P] is maximised, it is convenient to cast the sum of
Since log is a monotonically increasing function it is sufficient to maximise the argument inside the log of (6). As the first and second derivatives produce an intractable system of nonlinear equations, we attempt to solve (3) by variable transformation. We first show that for a fixed power of one of the transmitters, the other should use either none or full power to maximiseC(x,y). Specifically, we show that for a fixedy= y0,C(x,y0) is maximum only ifx = {0,P}.
solution,z−, is not physically valid and is therefore discarded.
AsA1 >0, stationary pointsz+ only exist forD1 >0. With D1>0 andz+>0, the second derivative is positiveg(z+)=
2D1/z3>0, which means thatz+is a minimiser. Hence,g(z)
is always maximised at boundary values of z. This implies that the maximum ofC(x,y0) in (1), withy0fixed, is attained
for eitherx=0 orx=P.
Similar reasoning can be applied if we fixx=x0to show
that the argument inside the log of C(x0,y) is maximised
when y = {0,P}. Therefore, the system spectral efficiency can possibly reach maximum only at the three corner points (x,y): (0,P), (P, 0), and (P,P), as the point (0, 0) is obviously a minimiser. We note that this finding is generally valid for arbitrary channel conditions, transmit, and noise power levels.
3.2. Choosing between simultaneous and single transmissions
In order to maximise the system spectral efficiency, nodes must transmit with maximum power. The next step is to derive conditions to choose between simultaneous and single transmissions. The three remaining candidates that maximise (1) areC(P, 0),C(0,P) for single transmission, and
C(P,P) for simultaneous transmission.
0
Conditions (10) and (11) indicate that the higher the
available transmit power P, the more favourable single
transmission becomes. This is intuitively clear by bearing in mind that single transmission is noise limited while simultaneous transmission is interference limited: unlike the SNR, the SINR may not increase when both links increase their power.
Figure 2 plots the system spectral efficiency region
C(x,y) over the available power domain x,y = [0,P] for
the path loss values L11 = 80 dB, L21 = 90 dB, L22 =
70 dB, and L12 = 90 dB. Note that the same path loss
values are used in both plots inFigure 2. Dependent on the maximum available transmit powerP, as well as the channel
conditions, the system spectral efficiency is maximised by
one of the three corner points,C(P,P),C(0,P), andC(P, 0). As shown inFigure 2(a)the maximum occurs at (P,P) when powers are relatively low, so that both (10) and (11) are not met. In the considered network, the switching points where single is preferred over simultaneous transmission are
P = 0.11 W forC(P, 0) ≥ C(P,P) according to (10), and
P = 9.1 mW for C(0,P) ≥ C(P,P) according to (11). As
the available power P increases, the maximum occurs at
(0,P), as shown inFigure 2(b). In this case, simultaneous transmission is inferior, due to the lack of interference for single transmission. This illustrates how changing the maximum transmit power influences the choice for the optimal transmission scheme.
Figure 3shows the plot of the system spectral efficiency region over the available power domain for a different set of path loss values. It is seen that the maximum occurs at (P,P) when interference path losses (L12andL21) are large relative
to path losses of the intended links (L11andL22).
As illustrated by Figures2(a)and3, in case (P,P) is the optimal operating point, power control (i.e., transmitting
with less than maximum power P) does not significantly
degrade system spectral efficiency. This observation is
important from a practical point of view, especially for power-constrained mobile terminals; although the spectral
efficiency is only maximised by transmitting with maximum
10
Figure3: System spectral efficiency versus transmit powers where C(P,P)> C(P, 0) andC(P,P)> C(0,P) with max. powerP=3 W.
power, gains tend to be marginal for simultaneous transmis-sion. The reason is that the increase of transmit power on the intended link in turn increases the interference on the other link. This is particularly true in case the system spectral efficiencyC(P,P) is dominated by mutual interference.
3.3. Single versus simultaneous transmission under constant system power
The discussion in Section 3.2 inherently assumes that the
−10
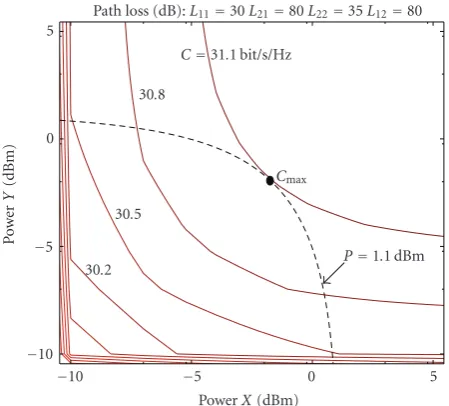
Figure4: Contour plot of the system spectral efficiency over the
power domain (x,y). The dashed line depicts the spectral efficiency
for constant powerP=1.1 dBm.
WithC(x,P−x)=log2h(x) and since log is monotoni-cally increasing function, it is sufficient to maximise
h(x)= −A2+ B2x
provides at most two distinct solutions:
x1,2= −C2 is at most one maximiser. This implies that there is at most one point along the liney=P−x, other than the end points
x= {0,P}, which maximisesh(x).
Figure 4, shows a contour plot of the spectral efficiency versus transmit powers. This plot illustrates how to maximise the spectral efficiency for a given overall powerP=x+y. The
optimal operating point for a particular power line segment
y=P−xis the crossing point or tangent to the contour that corresponds to the highest spectral efficiency.
Unfortunately, the possible maximiser of h(x) in (12) has fairly complicated functional dependence on the system parameters. For ease of analysis, we therefore choose the
middle point of the line segment, x = y = P/2, as
an approximation of the optimum power allocation for simultaneous transmission. By observing that C(x,P −x) is often almost constant in the middle part of the diagonal
y = P −x, as illustrated in Figure 4, this approximation appears justified. With this approximation, there are three transmission modes that need to be checked: (P, 0), (0,P), and (P/2,P/2). The selection between (P, 0) and (P/2,P/2) translates to the following condition:
C(P, 0)≥C
After some algebraic transformations, condition (15) results in
LetP1,2denote solutions to the quadratic formula, which are
given as
From the above solution, there are a number of cases that need to be distinguished. Bearing in mind thatP1 ≤ P2in
(17), these five cases are the following:
(i) fora2<2L
so that (15) is always met, as the transmit power
Pmust always be positive;
(b)a ≥ 0 andL22 ≤ L11: onlyP2is non-negative
which implies that (15) only holds true forP≥ P2;
(c)a <0 andL22 > L11: both solutions of (17) are
positive, which implies that (15) is satisfied for
P < P1orP > P2;
(d)a <0 andL22≤L11: onlyP2is non-negative, so
(15) is only met forP≥P2.
To check for which cases transmission mode (0,P) is
which holds when the other mode of the single transmission pair is optimal, so we have
P1,2 derived above, by first noting thatL11 > L22 and therefore C(0,P)> C(P, 0). Then from (21), we haveb= −1.25·1020<
0 andb2−2L
21L22L12(L22−L11)=1.57·1040>0. AsL22< L11,
the solutionsP1andP2are both positive. Thus, the inequality
(19) does not hold sinceP1 < P < P2withP1 = −30 dBm,
P2=57 dBm, andP=35 dBm.
3.4. Sequential versus simultaneous transmission
Having derived the conditions for choosing between single and simultaneous transmissions, we now substitute single by sequential transmission and compare it to simultaneous transmission. Although sequential transmissions is inferior from a system spectral efficiency point of view, sinceCseq ≤
max{C(0,P),C(P, 0)} where Cseq is defined in (4), this is
nevertheless an interesting case to consider. Unlike single transmission, sequential transmission maintains fairness, as even the user with inferior link quality is served.
Another important aspect is the power efficiency of
the network, which is critical for power-constrained mobile terminals, as well as from a regulatory point of view.
3.4.1. Power efficiency of the network
In order to assess the power efficiency, the capacity nor-malised to the total transmit power, with unit bit/s/Hz per Watt, is introduced. Provided that both nodes transmit
with equal power P, we wish to show that, in spectral
efficiency per Watt sense, sequential transmission always
outperforms simultaneous transmission. In mathematical terms, we wish to show that the following condition always holds:
Cseq P >
C(P,P)
2P . (22)
After some algebraic manipulation, (22) can be transformed to
which always holds since all variables are positive.
We note that on the left-hand side of (22), one link
transmits with powerP, while on the right-hand side two
links are active so that the total power amounts to 2P.
As demonstrated in the following, relaxing the constraint
of equal transmit powers per node affects the selection
criterion for the optimum multiple access scheme in power-constrained networks.
3.4.2. Sequential versus simultaneous transmission
under constant system power
We attempt to identify which multiple access scheme, either sequential or simultaneous transmission, maximises the system spectral efficiency under the constant system power
constraint, as formulated in (5). As the optimum power
allocation for simultaneous transmission was approximated by (P/2,P/2) inSection 3.3, the utility (5) translates to the
We note that condition (24) imposes an average transmit
power ofP/2 to individual users, as well as an overall constant power ofP to the network. Therefore, condition (24) also applies to the spectral efficiency per Watt, as introduced in
Section 3.4.1.
Condition (24) may be transformed to
1
After algebraic manipulation, (25) is expressed as a fifth order polynomial condition:
a5P5+a4P4+a3P3+a2P2+a1P+a0≥0 (26)
where a5,a4,a3,a2,a1,a0 ∈ R. Therefore, an analytical
solution, similar to the conditions presented earlier, is not possible due to the well-known fact that the fifth order poly-nomials, in general, have no solutions in terms of radicals (this is a consequence of Abel’s impossibility theorem [13]). To complicate matters further, eachak,k = {0,. . ., 5}, is a
function of the four path losses,Li j withi,j ∈ {1, 2}, and
additive white Gaussian noise. This simple example shows that even for the apparently simplistic scenario where only two users compete for resources, mathematical analysis may become intractable. We therefore attempt to characterise the selection of the optimum multiple access scheme that approachesComain (5) through simulations.
The findings of the system spectral efficiency analysis are briefly summarised in the following.
(i) The optimum power allocation that maximises the system spectral efficiencyC(x,y) withx,y∈[0,P] in (1) was derived inSection 3.1. There exist only three
these are either both links transmits with maximum
power simultaneously (P,P), or one single link
transmits with maximum power while the other is silent, (P, 0) or (0,P).
(ii) Exact conditions (9)–(11) are derived inSection 3.2
that identify the transmission mode (either simul-taneous or single transmission), as a function of the path losses Li j, i,j ∈ {1, 2}, that maximises
the system spectral efficiency (3). Generally, higher
available transmit powers P tend to favour single
transmission.
(iii) A constant system power constraint ofPis imposed inSection 3.3. It was shown that there exist also three operating points that possibly maximiseC(x,P−x),
x ∈ [0,P]: apart from single transmission at (P, 0)
and (0,P), there exists at most one other power
allocation along the linex+ y = P that maximises
the system spectral efficiency. As the exact operating point for simultaneous transmission that maximises
C(x,P − x), with x /= {0,P}, produces unwieldy expressions, a close approximation is obtained by settingx=y=P/2.
(iv) To grant both links access to the channel, single trans-mission is substituted by sequential transtrans-mission in
Section 3.4. Assuming that the available power per nodeis fixed toP, sequential transmission was shown to be always more power efficient than simultaneous transmission, in spectral efficiency per Watt sense.
On the other hand, imposing an constant overall
system power constraint of P, sequential transmis-sion may not always be superior. Unfortunately, a closed form solution for the optimum multiple access scheme that chooses between sequential and simultaneous transmissions to maximiseComain (5)
does not exist.
4. PATH LOSS DISTRIBUTION FOR USERS UNIFORMLY DISTRIBUTED ON A DISK
The analytical results obtained in the previous section apply to one particular channel realisation in terms of the path losses, Li j,i,j ∈ {1, 2}. In order to assess the system level
performance of the considered 2-link network, the average system spectral efficiency depends on the chosen location of transmitters and receivers in the network. In the following, the path loss distribution is derived, assuming that users are uniformly distributed within a disk. The disk represents an idealised model for an area with clear-cut boundary such as an airport terminal building or an office space. Specifically, from a set of uniformly distributed users on a disk of radius
R, four nodes are randomly selected: two transmitters and two receivers.
In the Appendix the probability density function (pdf) between any two users of distanceron a disk of radiusRis derived as follows:
Given the distance pdf between two nodes on a disk,
f(r), the corresponding path loss distribution (without log-normal shadowing) is derived by variable transformation as described in the following. Distance-dependent path loss is considered, described by
l=α+β log10(r) [dB], (28)
wherelis the path loss in dB,β=10ηwithηbeing the path loss exponent,r is the distance between the transmitter and receiver, andαis a constant. Then expressing the distancer
as a function ofl, we obtain
r=ρ(l)=10(l−α)/β∈[0, 2R]. (29) The path loss pdf is computed according to the random variable transformation given by
fL(l)=
From (32) it is seen that increasing the disk radiusRresults in a shift of the path loss pdf fL(l) to the right.
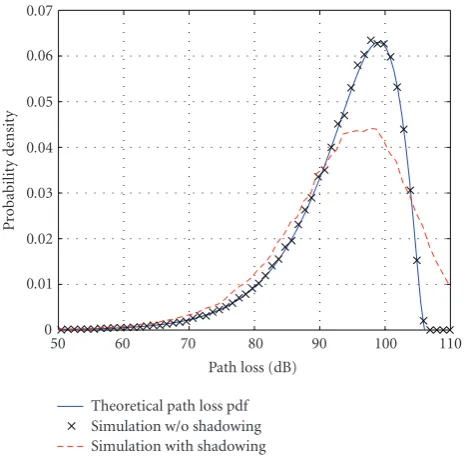
Theoretical and simulated (with 105iterations) path loss pdfs between two randomly placed nodes on a disk with
radiusR=100 m, path loss constantα=37 dB and a path
loss exponentη=3, are plotted inFigure 5.
To make the studies more realistic, log-normal shadow-ing is added to the path loss model (28). The corresponding path loss pdf is obtained by convolving the pdf of a normal distribution with the pdf (32). To the best of our knowledge, it is not possible to integrate that convolution integral is closed form. The convolution results in the broadening and lowering of the peak of the pdf (32). This is illustrated in Figure 5, where the path loss pdf is plotted, including log-normal shadowing with a standard deviation of 6 dB generated through simulations.
5. PERFORMANCE EVALUATION
5.1. Assessment methodology
In order to supplement the theoretical analysis, the system spectral efficiency of various transmission schemes is elab-orated, averaged over the path lossesLi j,i,j ∈ {1, 2}. The
0 0.01 0.02 0.03 0.04 0.05 0.06 0.07
P
robabilit
y
d
ensit
y
50 60 70 80 90 100 110
Path loss (dB) Theoretical path loss pdf Simulation w/o shadowing Simulation with shadowing
Figure5: Path loss pdf between two randomly chosen nodes on
a disk with radius R = 100 m, drawn from a uniform node
distribution. The theoretical pdf is shown to agree with the pdf excluding log-normal shadowing obtained via simulation.
from a uniform distribution on a confined circular area, as described inSection 4.
As the analysis showed that the system spectral effi cien-cies are maximised at the corner points, only the power allocations (0,P), (P, 0), and (P,P) need to be considered. The optimal transmission scheme selects between single and simultaneous transmissions using (9), (10), and (11), such that the maximum system spectral efficiencyCmax in (3) is
achieved.
AlthoughCmaxmaximises the system spectral efficiency,
perfect system knowledge is required, which involves mea-surements of all path losses Li j, i,j ∈ {1, 2}, and
sig-nalling of these locally generated measurements throughout the network. As this involves sophisticated protocols for measurements and signalling, it may not always be
fea-sible to operate the network such that Cmax is achieved.
Therefore, the expectations of the system spectral effi cien-cies of simultaneous transmission, E[C(P,P)], and single transmission, E[max{C(P, 0),C(0,P)}], are also evaluated and compared to E[Cmax]. Unlike simultaneous
transmis-sion which does not require any system knowledge, single transmission requires partial channel knowledge to compute max{C(P, 0),C(0,P)}. Ensuring that the link with superior spectral efficiency is selected as active link, according to (9), involves measurements and signalling of the pathlosses of the intended linksL11andL22.
The expectation of the system spectral efficiency of
different multiple access schemes that allow both links to be served is also investigated: sequential transmission,E[Cseq],
is compared with simultaneous transmission under a con-stant system power constraint,E[C(P/2,P/2)]. Furthermore, the gap in spectral efficiency to the optimum multiple access
schemeComa =max{C(P/2,P/2),Cseq}(which corresponds
to (5) withε=P/2) is also elaborated.
WhileSection 5.2assumes a 2-link wireless network, this restriction is relaxed inSection 5.3by considering additional background interferers.
5.2. Simulation for nodes uniformly distributed on a disk
In this section, channel realisations , that resemble uniformly distributed nodes within a disk, are drawn.Figure 5shows the corresponding path loss pdf between two nodes (32). To evaluate the average system spectral efficiency, Monte Carlo simulations are conducted assuming an AWGN power of
N = −90 dBm. Distance-dependent path loss (28), with a
path loss constantα=37 dB, a path loss exponent ofη=3, and log-normal shadowing with standard deviationσ =6, is assumed.
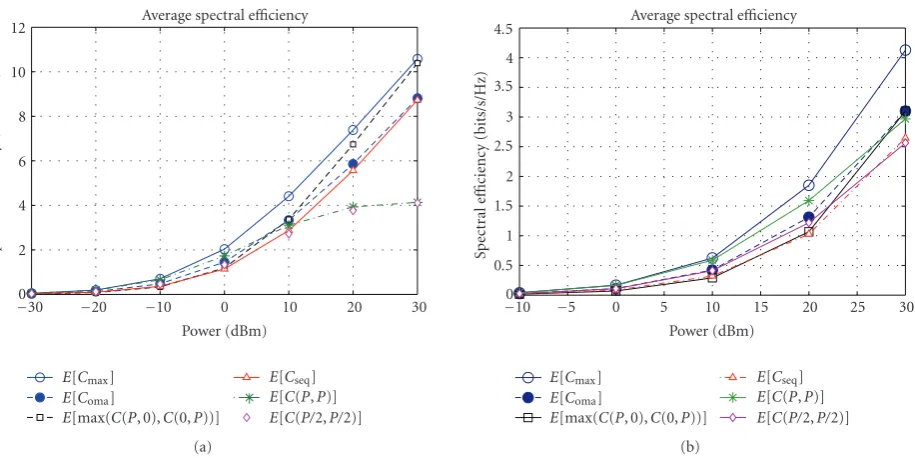
In Figure 6, the average system spectral efficiency of
various transmission schemes are compared for different
power levels P and disk radii R. High transmit power
levels P generally favour single transmission, while low
P favour simultaneous transmission. Furthermore,
com-paring Figure 6(a) with Figure 6(b), single transmission,
E[max(C(P, 0),C(0,P))], is preferred in small areas (radius
R = 100 m inFigure 6(a)), and approaches the maximum
E[Cmax] for high powers P. On the other hand, a larger
area (radius R = 500 m in Figure 6(b)) is beneficial for
simultaneous transmissions andE[Cmax] is approached for
low powers P. As larger areas imply higher path losses,
interference is only significant for higher transmit powers. Hence, the crossing point where single and simultaneous transmissions have the same spectral efficiency is shifted
towards a higher power level P. Similar conclusions can
be drawn when comparing sequential transmissionE[Cseq]
with simultaneous transmission under the constant system power constraintE[C(P/2,P/2)]: sequential transmission is
superior for large powers P and small disk radii R, and
approaches the optimum multiple access schemeE[Coma]= E[max{C(P/2,P/2),Cseq}]. The opposite is true for low P
and largeR, here simultaneous transmission gets close to the optimum, soE[C(P/2,P/2)]≈E[Coma].
Table 1 elaborates how the choice of the transmission
scheme affects the performance if knowledge about channel
conditions (i.e., the path losses between all nodes) is not available. Specifically, the probability that simultaneous transmission achieves a larger system spectral efficiency than single or sequential transmission is determined through
simulations. Table 1 indicates that for lower power P,
simultaneous transmission tends to be favourable. Likewise,
for higher maximum transmit powers P, sequential and
single transmissions are superior. Interestingly, sequential transmission,Cseq, provides better system spectral efficiency
than simultaneous transmission under the constant system power constraint,C(P/2,P/2), even at very low power levels
P. This can be explained by the path loss distribution
between the transmitter-receiver pairs shown in Figure 5.
Table1: Single and Sequential Transmissions versus Simultaneous Transmission. Disk RadiusR=100 m.
Power [dBm] −30 0 10 20 30
Pr(max{C(P, 0),C(0,P)}> C(P,P)) [%] 6 60 81 93 98
Pr(Cseq> C(P,P)) [%] 0 22 51 79 94
Pr(Cseq> C(P/2,P/2)) [%] 52 54 64 82 95
0 2 4 6 8 10 12
Spect
ral
e
ffi
ciency
(bits/s/Hz)
−30 −20 −10 0 10 20 30
Average spectral efficiency
Power (dBm) E[Cmax]
E[Coma]
E[max(C(P, 0),C(0,P))]
E[Cseq]
E[C(P,P)] E[C(P/2,P/2)] (a)
0 0.5 1 1.5 2 2.5 3 3.5 4 4.5
Spect
ral
e
ffi
ciency
(bits/s/Hz)
−10 −5 0 5 10 15 20 25 30
Average spectral efficiency
Power (dBm) E[Cmax]
E[Coma]
E[max(C(P, 0),C(0,P))]
E[Cseq]
E[C(P,P)] E[C(P/2,P/2)] (b)
Figure6: Average system spectral efficiencies for various transmission schemes. Channel realisations are drawn from a uniform distribution
of users on a disk with radiusR. (a) Disk radiusR=100 m, (b) Disk radiusR=500 m.
value, which means that intended and interfering links have similar path losses. This gives rise to higher average interference levels, which particularly penalises simultaneous transmission.
While Table 1 indicates the rate of occurrence when
a certain transmission scheme is superior, nothing is said about the actual improvement. In order to quantify the attainable gains, we define the normalised increase in system
spectral efficiency when simultaneous transmission under
the constant system power constraint is preferred over sequential transmission:
μ=C
(P/2), (P/2)−Cseq
Cseq .
(34)
Figure 7 shows that the gains provided by simultaneous transmission are rather modest, especially at low transmit
powers of P = −30 dBm. Here in only about 3% of the
cases, the improvement in spectral efficiency exceeds 10%
(see pointμ = 0.1 fromFigure 7). The largest difference is
observed forP =0 dBm, even though only for 15% of the
points the gains exceed 50%.
InFigure 8the opposite case is investigated: how much is gained in spectral efficiency if sequential is preferred over simultaneous transmission? The attainable gains are quantified by the normalised increase in overall spectral
efficiency when sequential is preferred over simultaneous
transmission under the constant system power constraint, defined by
ν=Cseq−C
(P/2), (P/2)
C(P/2), (P/2) . (35)
As shown in Figure 8, in case sequential outperforms
simultaneous transmission, it does so significantly. This is because for sequential transmission, there is no interference to disturb the communication of the intended links. ForP=
0 dBm, over 24% of the points show at least 100% increase in spectral efficiency over simultaneous transmission (see point
ν=1 fromFigure 8). Moreover, for larger transmit powers,
P = 30 dBm, the gains further increase; over 66% of the
points exhibit at least 100% increase in spectral efficiency.
Finally, at very low power levels of P = −30 dBm, the
performances of sequential and simultaneous transmissions are rather similar, due to excessive AWGN which dominates the sum capacity (1).
5.3. Including background interference to the 2-link network
0 Normalised increase ofC(P/2,P/2) relative toCseq
μ
P= −30 dBm P=0 dBm P=30 dBm
Figure7: Normalised increase in overall spectral efficiency when
simultaneous is preferred over sequential transmission,μas defined
in (34). Disk radiusR=100 m.
transmission, since sequential transmission is only limited by noise, while simultaneous access is interference limited. However, a scenario where two links compete for resources in perfect isolation from any other transmission is unlikely to occur in practice. In order to embed the 2-link network into a more realistic setting, a background interferers scenario is introduced with a number of interferers outside a minimum
distance Rex away from the receivers Rx1 and Rx2, as
illustrated inFigure 9. Through the background interferers, the SINRs at the two intended receivers (2) are adjusted as
γ1= x/L11
where Nint denotes the number of background interferers
all of which transmit with power P. For Nint = 0 the
original 2-link network is retained and (36) becomes (2). Furthermore, Lj1 andLj2, j = 3,. . .,Nint+ 2, denote the
path losses between the background interferers to the two intended receivers. Since the received interference is related to the distance by the path loss (28), an exclusion range
Rex around a vulnerable receiver effectively avoids excessive
interference of these additional links. The larger Rex the
smaller the impact of background interferers, and forRex →
∞ the 2-link network studied in Section 5.2 is retained.
When both intended transmitters Tx1 and Tx2 access the
channel simultaneously, there will be several interferers, but only one of which is dominant. For sequential transmission,
Tx1 and Tx2 are orthogonally separated in time and/or
frequency, so that both Rx1 and Rx2 are only exposed to
background interferers. One way of imposing an exclusion region around active receivers is provided by the busy signal concept [14,15], where receivers broadcast a busy burst in
0 Normalised increase ofCseqrelative toC(P/2,P/2)
ν
P= −30 dBm P=0 dBm P=30 dBm
Figure8: Normalised increase in overall spectral efficiency when
sequential is preferred over simultaneous transmission,νas defined
in (35). Disk radiusR=100 m.
Figure9: Background interferers scenario: additional transmitters
are added with a minimum distanceRexto the intended receivers
Rx1 and Rx2 . Intended transmitters and receivers are drawn
from a disk of radiusR = 100 m (not shown), while interfering
transmitters are drawn from a larger concentric disk of radius
Rbi=1000 m. Receivers and transmitters are shown as cylinders and
rectangular boxes. Solid and dashed arrows account for intended and interfering communication links, respectively.
an associated minislot, and each potential transmitter must sense this minislot prior to accessing the channel.
Figures 10 and 11 show results for different number
of additional background interferers, power levels P, and
exclusion radiiRex. Intended transmitters and receivers are
drawn from a disk of radiusR = 100 m, while interfering
transmitters are drawn from a larger concentric disk of radius
Rbi=1000 m (seeFigure 9).
As shown inFigure 10, an increasing number of
back-ground interferers modestly degrades the advantage of
single transmission at high powers P. By reducing the
exclusion range from Rex = 500 m in Figure 10(a) to
10
Figure10: Percentage of points where single outperforms simultaneous transmission at different power levels and number of background
interferersNint. The effect of background interference is only noticeable for high power levelsP, and further diminishes by increasing the
exclusion regionRex. (a) Exclusion radiusRex=500 m, (b) Exclusion radiusRex=50 m.
50
Figure11: Percentage of points where sequential outperforms simultaneous transmission at different power levels and different number of
background interferersNint. Of note is the significant effect of background interference at high power levelsP >10 dBm. (a) Exclusion radius
Rex=500 m, (b) Exclusion radiusRex=50 m.
InFigure 11, sequential transmission is compared with simultaneous transmission under the constant system power constraint. It is seen that sequential always outperforms simultaneous transmission irrespective of the power level
P and the number of background interferers. However,
as the number of background interferers increases, the superiority of sequential transmission significantly degrades at P > 10 dBm. Moreover, decreasing the exclusion range
fromRex = 500 m inFigure 11(a)to 50 m in Figure 11(b)
amplifies the effect of additional interferers and therefore compromises the advantage of sequential transmission.
6. SUMMARY AND CONCLUSIONS
obtained. It is analytically shown that transmitting with maximum power always maximises the system spectral efficiency; either both links transmit simultaneously, or only the link with favourable channel conditions is allowed to transmit. Furthermore, exact conditions, which are functions of path losses, power and noise levels, are established that determine the optimum switching point between single and simultaneous transmissions.
Generally, single transmission compromises fairness. Some level of fairness is introduced by the consideration of sequential transmission, where both links are active on orthogonal resources. Similar to single transmission, sequential transmission tends to outperform simultaneous transmission in an interference limited environment. For example, the average system spectral efficiency of sequential transmission is more than doubled (from 4 bit/s/Hz to 8.8 bit/s/Hz, at transmit powerP=30 dBm), when the four nodes are uniformly distributed within a circular area with
radiusR = 100 m. On the other hand, as the node density
decreases, simultaneous transmission tends to outperform sequential transmission. Extending the circular region toR=
500 m, simultaneous transmission outperforms sequential transmission for all transmit powers considered. However, even in this case the attainable gains of simultaneous over sequential transmission are not significant, especially when the overall transmit power is fixed. When background interferers are considered (up to nine interferers separated by a circular exclusion regions from the two intended receivers), the benefit of sequential transmission somewhat degrades, but remains superior in the majority of cases.
Local knowledge about the interference statistics may be utilised for the choice of the appropriate transmission scheme. As a consequence, power allocation and resource assignment should not be treated independently, giving rise for cross-layer approaches. In this context, it is shown that the higher the maximum transmit power and/or the observed interference, the more advantageous sequential transmission becomes. It is further demonstrated that the available transmit power and the node density impact the
interference statistics, and therefore affect the optimum
resource allocation strategy. As the available transmit power and/or the node density increase, the SINR tends to be dominated by interference, which typically favours single transmission. These findings are envisaged to provide valu-able input for adaptive and interference aware resource allocation algorithms. In the context of dynamic spectrum sharing, it can be concluded that appropriate measures to mitigate interference are not only beneficial to maintain fairness to users with poor channel conditions, but are also meaningful from a spectral efficiency point of view.
Considering the system spectral efficiency per Watt
in bit/s/Hz/W, sequential transmission was shown to be always better than simultaneous transmission, regardless of the actual path losses and transmit powers. This particular result suggests that in the case of power-constrained sensor networks, which are mostly characterised by limited available energy and comparably low data rates per node, it may be advantageous to employ resource allocation algorithms that minimise the simultaneous use of radio resources. In
r θ
CP x
R
Figure12: Node CP is shown at distancexfrom the centre of the
disk. Other nodes at distancerare on the ringr+drcentred at CP.
The part of the ring outside the disk depicted with the dashed line
corresponds to the angleθ.
case simultaneous transmission is preferred, transmit power levels can often be significantly reduced by hardly sacrificing spectral efficiency.
APPENDIX
The pdf of the distance between two nodes on a disk drawn from a uniform distribution is derived, which is utilised in
Section 4. Let point CP be at distance x from the centre of a disk as shown onFigure 12. The probability of having
another point at distance r from CP is given by the area
of an infinitely thin ring, r + dr centred at CP, which is 2πrdr, divided by the disk area, πR2. Considering all the
possibilities, the distance distributions are within the range
x ∈ [0,R] andr ∈ [0, 2R]. As r andx vary, parts of the ring might extend outside the confined circular area (the disk), as indicated by the dashed line inFigure 12, which is to be taken into account for the distance distribution. The arc which corresponds to the part of the circle that protrudes outside the area of consideration is expressed asθr, whereθis the angle corresponding to the arc. Then probability density function (pdf) that determines the occurrence of another point at distancer from point CP with distancexfrom the centre is in the form
f(r|x)= ⎧ ⎪ ⎪ ⎨ ⎪ ⎪ ⎩
2r
R2, x≤R−r, 0≤r≤R,
(2π−θ) r
πR2, x≥R−r, 0≤r≤2R
(A.1)
with
θ=2 arccos
R2−r2−x2
2rx
. (A.2)
on a disk, which results in
f(r)= ⎧ ⎪ ⎪ ⎪ ⎨ ⎪ ⎪ ⎪ ⎩
R−r
0
4rx R4 dx+
R
R−r(2π−θ)
2rx
πR4dx, 0≤r≤R, R
r−R(2π−θ)
2rx
πR4dx, R≤r≤2R.
(A.3)
After integration and algebraic manipulations, the following expression is obtained for the distance probability distribu-tion
f(r)= 4r
πR2arccos
r
2R
− 2r2 πR3
1−
r
2R 2
(A.4)
as the final result in (27).
ACKNOWLEDGMENTS
The authors would like to thank the anonymous reviewers for their constructive and valuable comments and sugges-tions. The comments clearly helped to improve the manu-script. This paper was presented in part at IEEE Globecom
2007 [16], and at IEEE Vehicular Technology Conference
(VTC 2008 spring) [17].
REFERENCES
[1] T. A. Weiss and F. K. Jondral, “Spectrum pooling: an
innova-tive strategy for the enhancement of spectrum efficiency,”IEEE
Communications Magazine, vol. 42, no. 3, pp. S8–S14, 2004. [2] J. Mitola, “Cognitive radio: an integrated agent architecture
for software defined radio,” Ph.D. dissertation, Royal Institute of Technology, (KTH), Stockholm, Sweden, 2000.
[3] S. Haykin, “Cognitive radio: brain-empowered wireless
com-munications,”IEEE Journal on Selected Areas in
Communica-tions, vol. 23, no. 2, pp. 201–220, 2005.
[4] I. F. Akyildiz, W.-Y. Lee, M. C. Vuran, and S. Mohanty, “NeXt generation/dynamic spectrum access/cognitive radio wireless
networks: a survey,”Computer Networks, vol. 50, no. 13, pp.
2127–2159, 2006.
[5] N. Bambos, “Toward power-sensitive network architectures in wireless communications: concepts, issues, and design
aspects,”IEEE Personal Communications, vol. 5, no. 3, pp. 50–
59, 1998.
[6] M. Weiser, “The computer for the twenty-first century,”
Scientific American, vol. 265, no. 3, pp. 94–104, 1991. [7] T. Robertazzi and P. Sarachik, “Self-organizing
communica-tion networks,”IEEE Communications Magazine, vol. 24, no. 1,
pp. 28–33, 1986.
[8] C. Prehofer and C. Bettstetter, “Self-organization in
commu-nication networks: principles and design paradigms,” IEEE
Communications Magazine, vol. 43, no. 7, pp. 78–85, 2005. [9] A. Behzad and I. Rubin, “High transmission power increases
the capacity of ad hoc wireless networks,”IEEE Transactions
on Wireless Communications, vol. 5, no. 1, pp. 156–165, 2006. [10] R. Negi and A. Rajeswaran, “Capacity of power constrained
ad-hoc networks,” inProceedings of the 23rd Annual Joint
Con-ference of the IEEE Computer and Communications Societies (INFOCOM ’04), vol. 1, p. 453, Hong Kong, March 2004. [11] P. Gupta and P. R. Kumar, “The capacity of wireless networks,”
IEEE Transactions on Information Theory, vol. 46, no. 2, pp. 388–404, 2000.
[12] A. J. Goldsmith and S. B. Wicker, “Design challenges for
energy-constrained ad hoc wireless networks,”IEEE Wireless
Communications Magazine, vol. 9, no. 4, pp. 8–27, 2002.
[13] M. Artin,Algebra, Prentice-Hall, Englewood Cliffs, NJ, USA,
1991.
[14] P. Omiyi, H. Haas, and G. Auer, “Analysis of TDD cellular
interference mitigation using busy-bursts,”IEEE Transactions
on Wireless Communications, vol. 6, no. 7, pp. 2721–2730, 2007.
[15] G. Auer, H. Haas, and P. Omiyi, “Interference aware medium
access for dynamic spectrum sharing,” inProceedings of the 2nd
IEEE International Symposium on New Frontiers in Dynamic Spectrum Access Networks (DySPAN ’07), pp. 399–402, Dublin, Ireland, April 2007.
[16] S. Sinanovi´c, N. Serafimovski, H. Haas, and G. Auer, “System
spectral efficiency analysis of a 2-link ad hoc network,” in
Proceedings of the 50th Annual IEEE Global Communications Conference (GLOBECOM ’07), pp. 3684–3688, Washington, DC, USA, November 2007.
[17] S. Sinanovi´c, N. Serafimovski, H. Haas, and G. Auer,
“Opti-mum spectral efficiency of horizontally spectrum sharing
2-link system,” in Proceedings of the 67th IEEE Vehicular
![Figure 2: System spectral efficiency C(x, y) versus transmit powers x, y = [0,P]. (a) Max](https://thumb-us.123doks.com/thumbv2/123dok_us/923033.1111869/4.600.311.548.299.449/figure-spectral-eciency-c-versus-transmit-powers-max.webp)