1307-143 Eighth Street, Etobicoke, Ontario, Canada M8V 3C8
2Universidade do Vale do Paraiba (UNIVAP), Sao Jose dos Campos, Sao Paulo, Brazil
(Received June 17, 2011; Revised July 29, 2011; Accepted August 9, 2011; Online published July 27, 2012)
Observations of the F2-layer critical frequency (foF2), peak height F2-layer (hmF2) and propagation factor
(M3000F2) recorded near dip-equator Ouagadougou, Burkina Faso (12.4◦N, 358.5◦E; dip latitude: 1.5◦N) have
been validated against the International Reference Ionosphere (IRI-2007) model during low (1987) and high (1990) solar activity and undisturbed conditions for four different seasons, with a view to enhance the predictabil-ity of the IRI. The results illustrated that URSI option forhmF2and CCIR option forM3000F2portray remarkably
well the morphological trends and replicate mostly the diurnal salient features of the experimental data at low and high solar activity periods. In contrast, both URSI and CCIR models of foF2also reproduce diurnal and seasonal
patterns and outstanding features of observational data surprisingly well for solar minimum conditions except July; whereas we found considerable disparities between model and data during solar cycle maximum. The total model error ranging from approximately 6–8% (hmF2), 13–38% (foF2) and 8–29% (hmF2), 12–44% (foF2),
re-spectively for low and high flux year, but roughly comparable at 3–7% forM3000F2at low and high solar activity.
Our observations indicate higher values of foF2deviations compared to prior calculated differences obtained for
the low-latitude region over Indian and Asian.
Key words:Equatorial-ionosphere,F2-layer, IRI-model, solar minimum-maximum.
1.
Introduction
The International Reference Ionosphere (IRI) is the inter-national standard for the specification of ionospheric den-sities, temperatures, and composition (e.g., Bilitza et al., 1979; Bilitza, 2001). The IRI (Bilitza, 2003) offers a valu-able and evolving synoptic description of the average iono-sphere, accounting well for the seasonal, spatial, and diur-nal changes (Wilkinson, 2004). IRI has been used for a wide range of applications (e.g., Milleret al., 1990; Bilitza
et al., 1995; Huanget al., 1996; Coetzee, 2004).
The F2-region is the most important part of the
iono-sphere for propagation of high frequency (HF) signals. The keyF2-layer characteristics are the critical frequency (foF2)
and height of the F2 peak electron density (hmF2). It is
important to state thathmF2values are not directly scaled
from ionograms as are other ionosphericF2-region
param-eters. As a result of group retardation of the radar wave, a practical approach to inferhmF2 values is to use
empir-ical formulas that connect hmF2 to the maximum usable
frequency (MUF) factor, M3000F2 parameter, rather than
working with the virtual height read from the ionogram (Bradley and Dudeney, 1973). Thus, the derivation of the
F2 altitude using M3000F2 parameter requires use of
semi-empirical models (Bradley and Dudeney, 1973; Bilitzaet al., 1979).
Copyright cThe Society of Geomagnetism and Earth, Planetary and Space Sci-ences (SGEPSS); The Seismological Society of Japan; The Volcanological Society of Japan; The Geodetic Society of Japan; The Japanese Society for Planetary Sci-ences; TERRAPUB.
doi:10.5047/eps.2011.07.017
M3000F2is also a valuable ionospheric parameter defined
as the ratio of the maximum usable frequency (MUF) at a distance of 3000 km to the F2 layer critical frequency.
M3000F2 is also called propagation factor. This
parame-ter, in theory, represents the optimum frequency at which to broadcast a signal that is to be received at a distance of 3000 km (Oyekola, 2010). MUF can be routinely scaled from ionograms. International Radio Consultative Commit-tee (CCIR) coefficients forM3000F2have been obtained in
the same way as for foF2.
There are numerous reports on experimental discrepan-cies between IRI model predictions and ionosonde obser-vations from different longitude sectors around the globe, for reviews see Obrouet al.(2003); Adeniyiet al.(2003); Sobralet al.(2003); Araujo-Pradereet al.(2004); Abduet al.(2006); Zhang et al.(2004a, b); Bertoniet al. (2006); Lee and Reinisch (2006); Rioset al. (2007); Sethi et al.
(2008); Yadavet al.(2010). However, except for the study by Bertoniet al.(2006), the quantitative areas of agreement and disagreement between model and data has not yet re-ceived much attention.
In this paper, we report a comparative analysis between IRI model-predicted ionosphericF2-layer peak parameters
from ionospheric observations obtained with an ionospheric sounder operated on a routine basis at a near equatorial sta-tion located at Ouagadougou (Burkina Faso: Geographic: 12.4◦N, 358.5◦E; dip latitude: 1.5◦N). The disparities, which are observed to exist, will be helpful for advance-ment of the IRI model and of the CCIR numerical maps at sub-equatorial latitudes, mostly for the longitude sector
554 O. S. OYEKOLA AND P. R. FAGUNDES:F2-LAYER PARAMETERS OBSERVATIONS AND COMPARISONS OVER OUAGADOUGOU
considered in this study, where ground-based observations are limited.
In the following sections, we first describe the base data used for this study together with information on the solar and geophysical conditions. We also highlight the “Bilitza” empirical formula used in calculating hmF2 (Section 2).
In the observations section, a direct comparison between the observed and calculated ionospheric characteristics with their IRI model-predicted values is given in Subsection 3.1. A variation in the percent deviations of ionosonde-derivedhmF2 and measured foF2 and M3000F2 from their
IRI model-predicted values is our focus in Subsection 3.2. This is followed by quantitative analyses of model per-formance (Subsection 3.3). Our results are discussed in Section 4. This paper is concluded with a summary of our key findings (Section 5).
2.
Data Analysis
Ionosonde measurements were collected from Oua-gadougou during 1987 low and 1990 high solar activity pe-riods for low magnetic activity defined asKp less or equal
to 3. The yearly averaged smoothed sunspot numbers for the low and high solar activity periods were about 29, and 142.6, respectively. Four seasons were chosen: Decem-ber solstice, March equinox, June solstice, and SeptemDecem-ber equinox are represented by January, April, July, and Oc-tober, in that order. Note that the inclusion of the two equinox seasons in our study rather than one will enable us to examine the differences between March and Septem-ber equinoxes. The monthly averaged smoothed sunspot numbers, R12for each of these months were 17.6 (January
1987), 24.4 (April 1987), 31.3 (July 1987), and 43.6 (Octo-ber 1987) for the low solar activity period, whereas for the high solar activity period the corresponding mean values of the R12were 150.6 (January 1990), 149.3 (April 1990),
140.6 (July 1990), and 142.1 (October 1990).
The foF2 and M3000F2 data were from monthly tables
of routinely scaled parameters for the station. The values of hmF2 were derived from “MUF factor” M3000F2 using
the formula proposed by Bilitzaet al.(1979). The “Bilitza formula”, which allows for the effect of ionization below theF2layer, takes the form:
hmF2≡
The correction termM (Eq. (2)) thus includes the influ-ence of underlying layers through the ratio foF2/foE and
the dependence on solar activityR12(the averaged monthly
smoothed value of sunspot number). foEis the critical
fre-quency ofE-layer, andis the geomagnetic latitude of the
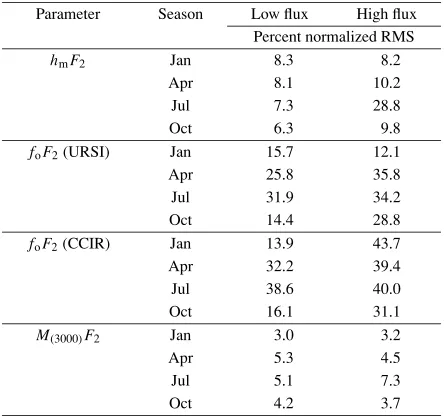
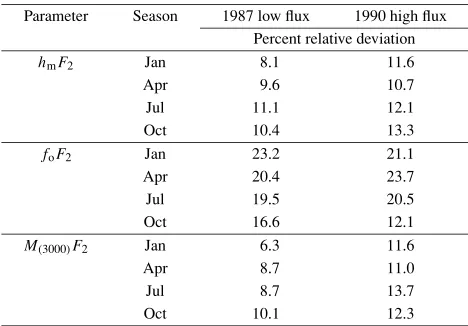
Table 1. Percent normalized RMS errors for the altitude of theF2peak,
F2critical frequency and propagation factor during 1987 low and 1990
high flux conditionsa.
Parameter Season Low flux High flux
Percent normalized RMS
aNormalized RMS error is computed by taking the RMS of the data
sub-tracted from the model results and then divided by the RMS of the data.
location in question, for Ouagadougou,=15.4◦N. The observed foF2 and foE values were used in calculation of
hmF2. Hourly monthly medians values were used for each
case. F2 peak height obtained this way is known as
calcu-latedhmF2.
IRI-2007 model values of hmF2, foF2, and
M3000F2 were downloaded from the IRI2007 website:
http://nssdc.gsfc.gov/space/model/models/iri.html. The following IRI model options were considered for this study: IRI-URSI option forhmF2, IRI-URSI and IRI-CCIR
options for foF2, and IRI-CCIR maps forM3000F2.
The overall model error is estimated using normalized root-mean-square error for maximum height, maximum electron concentration, and propagation factor following the example of Pawlowskiet al.(2008):
E =
(Fmodel −Fdata)2 Fdata2
, (3)
whereEis normalized RMS error, thesymbolizes taking a mean, F and observational data. AtE = 0, the model and data agree perfectly, while at E =1, the model could be replaced by a zero line. With the value of E > 1, the model results are diverging from the data, and most likely the model does not trend the data. The results are set out in Table 1, as we shall see later.
3.
Results
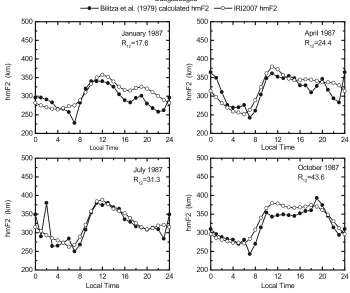
Fig. 1. Diurnal and seasonal variations of monthly median values ofhmF2, compared with the IRI-2007 predictions at Ouagadougou during solar cycle
minimum of 1987.
necessary for application purposes will be addressed in this section also.
3.1 Comparisons of ionosonde-inferred hmF2,
mea-suredfoF2andM3000F2and IRI model predictions
for Ouagadougou
A direct comparison is made between calculatedhmF2,
measured foF2 and M3000F2 with model predictions for
four different seasons during solar cycle minimum and maximum for quiet-time in Figs. 1–6. The 12-month run-ning mean value of the sunspot number for each month is shown in each panel. Each figure contains four panels of plots representing the month of January (left top), April (right top), July (bottom left), and October (bottom right). In order to aid comparison, observed and predicted values of F2-region peak parameters are plotted together for four
different seasons in Figs. 1–6.
Figure 1 displays the comparisons between calculated and IRI model-predictedhmF2values during low solar flux
for four seasonal periods. As can be seen, the figure in-dicates a rough uniform behavior of hmF2 for the four
seasons, with early morning minima, pre-noon, post-dusk peaks, respectively. There is also an apparent midnight measured peak, in all months, even though it is small in Oc-tober. Post-dusk peaks are not apparent in equinoxes, but very small peaks are obvious during December solstice in IRI representation ofhmF2. Post-sunset maximum are
com-pletely absent for both model and estimatedhmF2 during
the month of July. PostsunsethmF2enhancements are much
intensified during equinoxes for calculatedhmF2. One may
also note that the discrepancy between model and calcu-latedhmF2seems to be larger between about local midday
and 2300 LT in January. In general, IRI slightly overesti-mates the calculatedhmF2for all seasons, except for month
of July, where the model nearly matches with the observed data for the periods 0800–2200 LT.
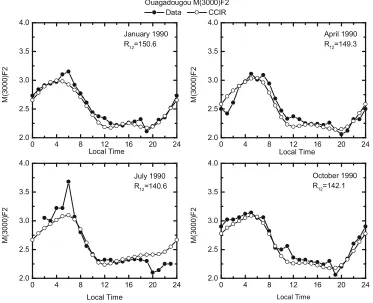
Figure 2 compares “Bilitza”hmF2with those of IRI
val-ues during high solar flux conditions of the year 1990. It is clear from Fig. 2 that the modeledhmF2follow the behavior
of the estimated data for each season. The striking features in the diurnal cycle given in Fig. 2 are near sunrise minima and a sharp increase during daytime to reach well-defined post-sunset maxima at about 2000 LT for all seasons for calculatedhmF2data. It is interesting to see that IRI-URSI
2007 model does replicate the postsunset peaks in hmF2
and indeed it is precisely at those peaks where experimen-tal and modeled curves coincide except July. The fact that IRI peaks look smooth as compared with those measured is ought to overestimations at previous local times before the occurrence of postdusk peaks. In addition, post-midnight maximum is evident only in April. There is also a good fit between the calculatedhmF2 and IRI curves during
post-midnight sector. Here the model results largely overesti-mate the calculatedhmF2during the daytime, except for the
month of July, where disparities are somewhat large around postsunset hours.
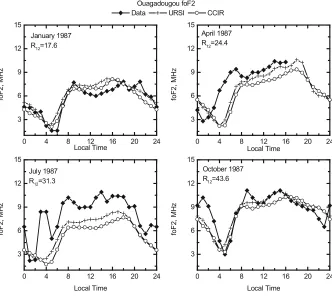
In Fig. 3, diurnal and seasonal cycles of measured and modeled foF2values are presented for 1987 low solar
min-imum conditions. Apparently, both the URSI and CCIR op-tions follow the experimental foF2 curves in January and
October. Experimental foF2 is lower in value between
val-556 O. S. OYEKOLA AND P. R. FAGUNDES:F2-LAYER PARAMETERS OBSERVATIONS AND COMPARISONS OVER OUAGADOUGOU
Fig. 2. Results similar to those of Fig. 1, but for the solar activity maximum year 1990.
Fig. 3. Diurnal and seasonal variations of monthly median values offoF2, compared with the IRI-2007 predictions at Ouagadougou during solar cycle
minimum of 1987.
ues. Notice that in April, we do not have complete data. The data exist between 0000 and 1600 LT. However in July, ionosonde measurements indicate substantial fluctu-ations with several peaks with magnitude consistently and
Fig. 4. Results similar to those of Fig. 3, but for the solar activity maximum year 1990.
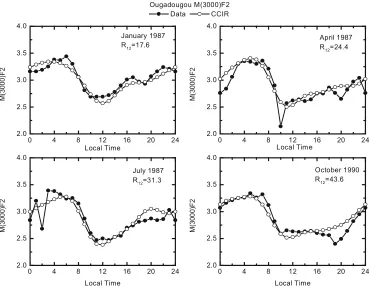
Fig. 5. Diurnal and seasonal variations of monthly median values ofM3000F2, compared with the IRI-2007 predictions at Ouagadougou during solar
cycle minimum of 1987.
midnight and 0500 LT. Notice that October curves indicate deep minima for both ionosonde and the IRI model. These minima occur at about 0300 LT in IRI and roughly 1-hour later for ionosonde. One other interesting feature found in
underrep-558 O. S. OYEKOLA AND P. R. FAGUNDES:F2-LAYER PARAMETERS OBSERVATIONS AND COMPARISONS OVER OUAGADOUGOU
Fig. 6. Results similar to those of Fig. 5, but for the solar activity maximum year 1990.
resented by both URSI and CCIR options for foF2 during
the daytime and nighttime periods. This result is consis-tent with Bertoni et al.(2006) who found foF2 to be
un-derestimated for the station Palmas (10.17◦S, 48.20◦W, dip:
−10.80◦) during low solar activity period of 2003–2004. Figure 4 compares the observed monthly median foF2
and IRI model results for four seasonal periods during high solar flux and magnetically quiet times. In January IRI-URSI foF2 provides a better fit, except for the periods
0800–1600 and 1800–2000 LT. The three curves agree between about 1800 and 2000 LT in April. During the month of July, IRI-URSI prediction curve is closer to the ionosonde curve between 0400 and 0600 LT and again be-tween 1900 and 2000 LT. In October, URSI and CCIR
foF2values and the observed data are in reasonable
agree-ment between about 1100 LT and local midnight. A care-ful inspection of Fig. 4 reveals the following outstand-ing characteristic features of the diurnal variation of foF2,
e.g., the appearance of sunrise or early morning minimum, the forenoon, postnoon and evening ionization maxima, midday “bite-out”, as well as postsunset and postmidnight peaks of foF2. These characteristic features are much more
pronounced at high solar activity than at low solar activity. Some features are not distinct in the model; some are not reproduced by the IRI. For instance, post-midnight peaks are not noticed in model curves for all seasons. Also, early morning minimum of foF2 does not occurs at the same
time, the occurrence time differs by about 1–2 hours with model diurnal cycle minimum appears earlier for all sea-sons. Generally, poor agreement is obtained for F2-layer
critical frequency during high solar activity. Our results
contrast the report of Batista and Abdu (2004) who found good agreement between the IRI predictions and observed mean foF2for the Brazilian equatorial station of Sao Luis
(2.3◦S, 44.2◦W; dip angle:−2.7◦) during high solar activity period.
Figure 5 shows the measured and modeledM3000F2
val-ues for low solar activity for four different seasons. As can be seen the overall diurnal cycle ofM3000F2 is well
repre-sented by the CCIR model, but some vital features such as the minimum at 1000 LT (April), 0200 LT (July), and 1900 LT (October) are not portrayed by the model curves. A di-rect comparison between the observed and IRI-CCIR pre-dicted values of propagation factor during a period of high solar activity are given in Fig. 6 for four seasonal periods. We find a remarkable agreement betweenM3000F2and the
CCIR maps, apart from observed peaks seen in the experi-mental curves at about 0600 LT (January), midday (April), 0700 LT (July), and 1100 LT (October). July model curve does not indicate the dawn maximum and postsunset min-imum clearly demonstrated by the ionosonde curve. Our data (observations 5 and 6) are in good agreement with the work of Obrouet al.(2003) but disagree to a large extent with the results given by Adeniyiet al.(2003), even for the same African longitude sector.
3.2 Variations in the percent deviations of ionosonde-derived hmF2, measured foF2, andM3000F2 from
IRI model predictions
In this subsection, we now examine the deviations of measured and calculated characteristics of the F2 region
ter (measured: foF2andM3000F2, calculated:hmF2).
Figure 7(a) shows the percent deviations between the IRI-URSI model results and the calculated values of theF -region peak height,hmF2as a function of time of day and
season for low sunspot period for Ouagadougou according to Eq. (3). Obviously, there is a trend of positive difference, implying that the model overestimateshmF2values between
0500 and 2200 LT (January), 0700–1300 LT, 1600–1900, 2100–2300 LT (April), in most of the hours in July and from 0700 and 1800 LT (October). The deviation dhmF2 is as
high as∼20% in January and as low as∼25% in July. Sea-sonal differences are observed for all local time, where the percent absolute deviations are largest (∼0–22.9%) for July and smallest (1.4–16.1%) for April, with a medium value of 0.8–16.4% and 0.2–20.8% for October and January, respec-tively. The seasonal averaged absolute deviation is from a near zero value to 19% during low solar activity period.
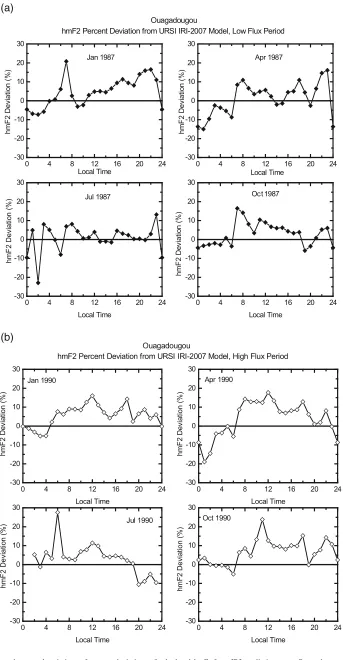
Figure 7(b) presents the diurnal and seasonal cycles of the percent deviations between IRI-URSIhmF2and
calcu-latedhmF2for high solar flux and quiet geomagnetic
activ-ity conditions for Ouagadougou. Again, it is quite obvious that IRI model consistently overestimates ionosonde curves shown in Fig. 2, apart from local midnight to 0400 LT (Jan-uary), 0000–0600 LT (April), 2000–2300 LT (July), and 0400–0600 LT (October) time intervals. We note that the model drastically overpredicts ionosonde-derivedhmF2by
about 30% during sunrise hour in the month of July. The trend in the percent deviation clearly varies with season. The strongest effects are seen in July, 0–27.6%, and Octo-ber, 0–23.8%, while the variations in January and April are not as large. The smallest variations are seen in January: 0.2–16%, with a medium value of 0–19% in April. Overall, the deviation ranges from 0–22%. Thus, the disparities be-tween calculatedhmF2and IRI model-predictedhmF2
val-ues during high solar activity are found to be insignificantly smaller (∼3%) than those differences observed for low so-lar activity period.
Figure 8(a) displays the typical characteristics of the di-urnal and seasonal percent deviations between IRI-URSI
foF2 (solid circle) and IRI-CCIR foF2 (open circle) and
observed foF2 during low solar activity year of 1987
un-der quiet magnetic activity conditions. We do not have observational data for April 1987 for the periods 1700– 2300 LT, so there is no comparison within these local time intervals. The percent relative deviation is dominated by negative trend in April and July, implying that the mea-sured values of foF2 are constantly higher than the
mod-eled foF2 values (see observation 3). The model
overesti-mates the measured value from 0400–0700 LT and 1100– 1600 LT (January), 0000–0200 LT (April), 0100–0200 LT (July), and 0500–0600 LT (October). The modeledF2-layer
critical frequencies closely follow the behavior of the data during October month from 1100 and 2100 LT. We also
and broad range of seasonal disparity. The largest effect is typically observed in January (∼1.2–138.7%) and small-est occurred in October (0–40%), with April (4.5–67%) and July (7.7–72%) lying between the two extremes. On the contrary, IRI-CCIR largest seasonal dissimilarity is found in July (16–79%), January (0–76%), and April (10–74%), with the lowest value found in October (0–35%). In gen-eral, the percent deviation of about∼3–80% (URSI) and
∼7–66% (CCIR) are found for 1987 low solar activity year. Figure 8(b) gives the local time and seasonal variations of percent deviations between IRI-URSI foF2(solid circle)
and IRI-CCIR foF2 (open circle) and the measured foF2
during solar maximum of 1990 for low magnetic activity. Figure 8(b) indicates clearly that both IRI options for crit-ical frequency of F2-layer appear to be less accurate for
equatorial region in Africa. Again, in January the deviation curve shows a relatively sharp increase in foF2with typical
value near 125% for URSI model, indicating that IRI-URSI option overpredicts foF2data by that significant amount at
sunrise. The URSI model percent deviation,d foF2 shows
strong seasonal changes with largest value found in Decem-ber solstice (0–124%), and lowest value occurred in June solstice (3–65%) with equinoxes (April: 0–70%, October: 0–67%) lying between the solstices extreme, whereas CCIR model indicates largest value in June solstice (July: 2–76%), December solstice (January: 9–70%), and March equinox (April: 0–71%), with the smallest value seen in September equinox (October: 0–67%). On average, absolute deviation of modeled foF2 from observational data ranging from 0–
80% and∼3–70% for URSI and CCIR model, respectively for 1990 high solar activity year. Putting Figs. 8(a) and 8(b) together, we infer that overall deviations during solar mini-mum and maximini-mum years are comparable for URSI option, but are marginally difference for CCIR model.
Figures 9(a) and 9(b) present the diurnal variations of percent discrepancies between the measured M3000F2
and the IRI-CCIR model-predicted M3000F2 for four
sea-sonal phases in 1987 (Fig. 9(a)) solar minimum and 1990 (Fig. 9(b)) solar maximum year, in that order. As can be seen, there exist marked seasonal differences for the two levels of solar phases. During low solar activity, we found that the model overpredicts the measured value consider-ably by∼21% in April at 1000 LT,∼17% in July at 0200 LT, and∼13% in October at 1900 LT. Here the deviation ranges from 0–14% over the four seasonal periods. At high solar activity year, Fig. 9(b), the morphological patterns of percent deviations exhibit positive and negative trends. The variation is obviously erratic. The changes indicate a rel-atively sharp increase of about 12% in April at 0100 LT,
560 O. S. OYEKOLA AND P. R. FAGUNDES:F2-LAYER PARAMETERS OBSERVATIONS AND COMPARISONS OVER OUAGADOUGOU
Fig. 7. (a) Local time and seasonal variations of percent deviations of calculatedhmF2from IRI predictions over Ouagadougou during low solar flux
Fig. 8. (a) Local time and seasonal variations of percent deviations of measured foF2from IRI predictions over Ouagadougou during low solar flux
562 O. S. OYEKOLA AND P. R. FAGUNDES:F2-LAYER PARAMETERS OBSERVATIONS AND COMPARISONS OVER OUAGADOUGOU
Fig. 9. (a) Local time and seasonal variations of percent deviations of measuredM3000F2from IRI predictions over Ouagadougou during low solar flux
from 0–7%, 0–12%, 0–16%, and 0–11% in January, April, July, and October, respectively.
The results of comparative analysis forhmF2 and foF2
presented above agree qualitatively and contrast quantita-tively the recent observations obtained for low-latitude re-gions in the Indian and Southeast Asian longitude sectors. Chuo and Lee (2008) used observed foF2andhmF2 made
from the northern crest of equatorial ionization anomaly (EIA) station, Chung-Li (Taiwan: 24.9◦N, 121.1◦E; dip 35◦) and compared with IRI-2001 model predictions for the pe-riod from 1994 to 1999. They showed that the percent-age deviation of the observed foF2 (hmF2) values with
re-spect to the IRI model varies from 5–80% (0–25%) dur-ing nighttime and 2–17% (0–20%) at daytime, respectively. Sethiet al.(2008) used measuredhmF2derived from
digi-tal ionosonde measurements at a low to middle latitude sta-tion, New Delhi (India: 28.6◦N, 77.2◦E; dip 42.4◦N) for the period from January 2003 to December 2003 and January 2004 to December 2005, reported that the percentage devi-ation of the observedhmF2 values with respect to the
IRI-2001 model, in general, remains within 15% and 10% in all seasons during moderate and low solar activity, respec-tively. The deviations found in the present analysis are gen-erally much greater than the deviations reported by Sethi
et al.(2008). Yadavet al.(2010) used observed foF2and
hmF2, and calculatedhmF2from modern digital ionosonde
observations, again at EIA region, Bhopal (India: 23.2◦N, 77.6◦E; dip 18.5◦N) during solar minimum year of 2007. The authors indicated that ionosonde measured hmF2
val-ues show a good agreement with the calculatedhmF2
val-ues. They found IRI to exhibit a better agreement forhmF2
than for foF2. Also, they pointed out that the percent
differ-ence between the model and observations remains less than 25% for all seasons, while percentage deviations for both measured and “Bilitza” calculatedhmF2values are less than
15%, in partial agreement with our observations. 3.3 Quantitative analysis
To quantitatively describe the visual agreement between the IRI model-predicted results and our ionosonde observa-tions, we conducted normalized root mean square (RMS) error according to Eq. (3). The results are shown in Table 1. We can see that the normalized RMS error varies with sea-son and the phases of solar cycle. The normalized RMS for altitude of theF2peak is from 6.3–8.3% (low solar activity
year) and 8.2–28.8% (high solar activity year). We note that the error during high solar flux June solstice periods is ex-aggerated compared to low solar activity value, where there is a difference of nearly a factor of 4. Also shown in Table 1 are the errors in the critical frequency of F2-layer for both
URSI and CCIR options. For IRI-URSI foF2, the
differ-ences between the errors for the ranges of solar flux val-ues are not much, except for the month of October, where the high solar flux error doubled the low flux error. On the
Jul 11.1 12.1
and October high solar activity is a factor of 3 and 2 higher than those errors found in foF2 during similar months of
low solar activity, respectively. The normalized RMS errors for propagation factor show no significant changes to solar variability.
Hence, quantitatively, there exist good agreement be-tween CCIR model and the measuredM3000F2values with
a fluctuations level of about 5% for both level of solar activ-ity. The agreement between modeled and calculatedhmF2
is also good with overall model error of less than 10% dur-ing low solar activity year of 1987. At high solar activity, model error is within approximately 8–10%, except for the month of July which is∼29%, implying the agreement is comparatively good. As expected, the averaged normal-ized RMS errors for foF2 are from 22–39%, which
indi-cates poor agreement between observed and expected value of foF2.
We further examine the percent standard relative devia-tions of the data from their respective medians. The results are given in Table 2 for both low and high solar activity peri-ods. Interestingly, we found no substantial change between seasonal and solar cycle variations of the percent relative deviation for all the parameters. Taking Tables 1 and 2 to-gether, for example,hmF2 value in January, for low solar
activity year, the overall model error is estimated at 8.3%, whereas the relative deviation ofhmF2 from the median is
found to be 8.1%. So the model error is 0.2% less than the data scatter around median.
It is interesting, however, to contrast F2-layer critical
frequency analysis results obtained from the present study with the recent results presented by Oyekola (2011) within West-African sector, Ouagadougou, Burkina Faso (12◦N, 1.5◦W; dip latitude: 1.5◦N) and Ibadan, Nigeria (7.4◦N, 3.9◦E; dip latitude: 2.3◦S). Using observational data col-lected from Ibadan during very high solar activity year of 1958, yearly-averaged sunspot number R12 = 184.8 for
quiet geomagnetic conditions. CCIR model of foF2 was
chosen. The hourly percent deviation (%foF2) varies
564 O. S. OYEKOLA AND P. R. FAGUNDES:F2-LAYER PARAMETERS OBSERVATIONS AND COMPARISONS OVER OUAGADOUGOU
model error ranges between about 50–125% over the four selected months, with maximum error occurring in the month of June. On the other hand, the present analysis utilizes ionosonde data acquired from Ouagadougou dur-ing high solar activity year of 1990, yearly mean sunspot number R12 = 142.6 for quiet-day F2-layer. Both URSI
and CCIR models of foF2 were used for the study. The
hourly percent deviation is as follows: January: −30% to 124% (URSI) and−70% to−9% (CCIR), April:−70% to 15% (URSI) and−70% to near zero % (CCIR), July:−65% to−3% (URSI) and−76% to−2% (CCIR) and October:
−67% to 11% (URSI) and−67% to 17% (CCIR). Here, the total normalized root mean squared difference is typi-cally within approximately 12% to 35% (URSI) and 30% to 44% (CCIR). On the basis of these results, the follow-ing main points are in order: (1) CCIR foF2 model
con-sistently presents substantial hour-to-hour and season-to-season percent deviation over Ouagadougou compared to that of Ibadan, while Ibadan demonstrates higher values and wider range of model error than those of Ouagadougou for similar undisturbed geomagnetic conditions but apprecia-bly different yearly-averaged sunspot number, ∼23% dif-ference inR12values. (2) The substantial disparity in value
offoF2is partly probably due to peculiarity in magnetic
hemisphere, even though the stations are almost close to dip magnetic equator. (3)F2-layer critical frequency results
in such a narrow longitudinal range represent the compli-cated behaviors of the foF2parameter derived from
equato-rial ionograms and hence equatoequato-rial ionosphere.
4.
Discussion
The current research pays so much attention to see how far the quiet-day ionosonde-inferred equatorial F2-layer
characteristics parameters compare with their IRI represen-tations for eventual improvement of IRI forecasting capa-bility. Almost all previous studies have typically focused on the F2 peak characteristics provided by ionosondes, in
particular critical frequency of F2 layer and F2 maximum
height of electron density seem to be heavily compared with the IRI model compared to other ionospheric parame-ters such as ionospheric propagation factor. Semi-empirical models interconnect the three ionospheric peak parameters analyzed here and as such their individual variations and comparison with global empirical model such as IRI must not be assumed. There exists also an obvious gap in that thorough quantitative comparison analysis between model and measurement of ionospheric parameters are limited.
The overall model error, that is the mean square root de-viation of the model from the data over the representative month ranging from about 6–8% (hmF2),∼13–38% (foF2)
and ∼8–29% (hmF2), ∼12–44% (foF2), respectively for
low and high flux year, but approximately comparable at
∼3–7% for M3000F2 during solar minimum and maximum
conditions. Accordingly, the largest error is clearly seen in foF2 and smallest in hmF2, while error in M3000F2 is
not evident. The CCIR model reproduced well the propa-gation factor. The CCIRM3000F2 model uses a low order
of spherical harmonics and therefore cannot reproduce the sunrise and sunset peaks (D. Bilitza, personal communica-tion, 2011).
There exist noticeable seasonal differences between the data and the model results. The largest percent disparity occurs in foF2 (URSI: 3–80%, CCIR: 7–66%), lowest in
M3000F2(0–14%), and medium value inhmF2(0–19%)
dur-ing low solar activity year. Durdur-ing solar maximum year, the seasonal variation is also prominent in foF2 with percent
difference, 0–82% (URSI) and 3–70% (CCIR), the small-est in M3000F2, 0–12%. The percent discrepancy noted in
hmF2 is 0–22%. We immediately observe that solar
activ-ity seems to play less significant role in percent deviations. The sharp post-midnight increase inhmF2during low solar
activity in July 1987 at 0200 LT (see observation 1) corre-spond to a deep minimum inM3000F2at the same time and
month (see observation 5), sunrise minimum noted inhmF2
during high solar activity of July 1990 also corresponds to a sharp increase inM3000F2at the same time and season of
high solar flux year (see observation 6) confirm the strong anti-correlation that exists betweenhmF2andM3000F2.
It is hypothesized that theF2-layer in low magnetic
lat-itudes is strongly influenced by electric fields, the “foun-tain effect” described by Hanson and Moffett (1966) and many others. The vertical drift is upward by day and downward by night. This upward daytime flow, combined with poleward meridional transport and eventual downward diffusion, leads to a redistribution of plasma referred to as the “fountain effect”. Consequently, we expect to see strong signature of this behavior in the key equatorial iono-sphericF2-layer parameters. Also due partly to the
day-to-day variability of the detailed electrodynamics and dynam-ics processes in the equatorial ionosphere; both foF2 and
hmF2 have peculiarities in the equatorial region, magnetic
hemispheric and longitudinal behaviors. Thus, these com-plex processes that influenced ionospheric characteristics over equatorial region provide unique challenges for em-pirical modeling of the region. Another reason for remark-able differences between model and observational results is that the data coverage in the IRI model is limited to cer-tain geographical locations and there is scarceness of iono-spheric data at other locations, especially in global equa-torial zones. A further complication arises owing to our limited understanding of the interplay between production, recombination, dynamics and electrodynamics processes in the equatorial F2-layer. However, F2-layer is presumably
connected in some ways with the magnetospheric processes from above and processes from lower atmosphere, in this way, the upper ionosphere is intricate to predict.
5.
Summary
In this research, we have analyzed ionosonde measure-ments recorded at a near equatorial station, Ouagadougou in order to validate ionosondeF2-layer parameters against the
global empirical International Reference Ionosphere (IRI-2007; Bilitza and Reinisch, 2008) at the low and high levels of solar activity and magnetically quiet conditions for four distinct seasonal periods in the equatorial F-region in the West-African sector. The major highlights of our investiga-tion are delineated as follows:
URSI option in January 1990.
2. The magnitudes of the calculated differences for both low and high solar flux periods essentially exhibit sig-nificant percent deviations, particularly forhmF2 and
foF2. Comparisons of the hourly percent deviation
of foF2 with comparative analysis recently reported
by Oyekola (2011) for Ibadan, Nigeria (7.4◦N, 3.9◦E; dip latitude: 2.3◦S) within West African longitude sec-tor show marked longitude differences at equasec-torial zone. These must be due to some longitude-dependent factor, most probably connected in several ways with the detailed electrodynamics and dynamics of equato-rial ionosphere. The highlighted longitude and mag-netic hemispheric disparities between Ibadan and Oua-gadougou will be valuable for the improvement of the predictability of IRI model in one hand, and update of IRI model on the other hand, for equatorial region. 3. Our results show good reasonable agreement between
the IRI predictions and theM3000F2measurements for
all seasons at low and high sunspot periods. Although dawn maximum and post-sunset minimum clearly seen in observationalM3000F2data are not followed by the
model.
4. This analysis provides further important clues towards a better understanding of the occurrence of post-midnight equatorial F-region irregularities (EFIs), which are known to develop mainly during solar mini-mum June solstice periods over African longitude sec-tor (Li et al., 2011). Thus, this work confirms the dominant role of day-to-day variability in the electro-dynamic processes in causing large deviations of the measured foF2and estimatedhmF2from the modeled
results.
5. Our observations present higher values of foF2
devi-ations from the model compared to the earlier results obtained for the low-latitude longitude sectors over In-dian and Southeast Asian quoted in this paper. 6. Lastly, the study sum up the appreciable success of
the IRI simulations in explaining prominent observed characteristic diurnal and seasonal features and other phenomena of equatorial ionosphere.
Acknowledgments. We thank the referees for their helpful re-marks and suggestions, particularly pointing out scientific and technical and language observations in the paper. Of course, the great job they have done together with insightful comments of Dr. Dieter Bilitza (guest editor) on the original draft of this paper made this work the way it appears now. We gratefully acknowledge United State National Oceanic and Atmospheric Administration (NOAA) for providinghmF2, foF2, and M3000F2 data from the
IRI2007 model website.
Araujo-Pradere, E. A., T. J. Fuller-Rowell, and D. Bilitza, Ionospheric vari-ability for quiet and disturbed conditions,Adv. Space Res.,34, 1914– 1921, 2004.
Batista, I. S. and M. A. Abdu, Ionospheric variability at Brazilian low and equatorial latitudes: comparison between observations and IRI model,
Adv. Space Res.,34, 1894–1900, 2004.
Bertoni, F., Y. Sahai, W. L. C. Lima, P. R. Fagundes, V. G. Pillat, F. Becker-Guedes, and J. R. Abalde, IRI-2001 model predictions compared with ionospheric data observed at Brazilian low latitude stations,Ann. Geo-phys.,24, 2191–2200, 2006.
Bilitza, D., International reference ionosphere 2000,Radio Sci.,36(2), 261–275, 2001.
Bilitza, D., International reference ionosphere 2000: Examples of improve-ments and new features,Adv. Space Res.,31(3), 757–767, 2003. Bilitza, D. and B. W. Reinisch, International reference ionosphere 2007:
Improvements and new parameters,Adv. Space Res.,42(4), 599–609, doi:10.1016/j.asr.2007.07.048, 2008.
Bilitza, D., N. M. Sheikh, and R. Eyfrig, A global model for the height of the F2-peak using M3000 values from the CCIR numerical maps,
Telecomun. J.,46(9), 549–553, 1979.
Bilitza, D., C. Koblinsky, B. Beckley, S. Zia, and R. Williamson, Using IRI for the computation of ionospheric corrections for altimeter data analysis,Adv. Space Res.,15(2), 113–120, 1995.
Bradley, P. A. and J. R. Dudeney, A simple model of the vertical distri-bution of electron concentration in the ionosphere,J. Atmos. Sol.-Terr. Phys.,35, 2131–2146, 1973.
Chuo, Y. J. and C. C. Lee, Ionospheric variability at Taiwan low latitude station: Comparison between observations and IRI-2001 model,Adv. Space Res.,42, 673–681, 2008.
Coetzee, P. J., Applications of the IRI in South Africa,Adv. Space Res.,34, 2075–2079, 2004.
Hanson, W. B. and R. J. Moffett, Ionization transport effects in the equa-torial F-region,J. Geophys. Res.,71, 5559–5572, 1966.
Huang, C., C. Liu, H. Yeh, W. Tsai, C. Wang, K. Yeh, K. Lin, and H. Tsai, IRI model application in low latitude ionospheric topography,Adv. Space Res.,18(6), 237–240, 1996.
Lee, C.-C. and B. W. Reinisch, Quiet-condition hmF2, NmF2, and Bo vari-ations at Jicamarca and comparison with IRI-2001 during solar maxi-mum,J. Atmos. Sol.-Terr. Phys.,68, 2138–2146, 2006.
Li, G., B. Ning, M. A. Abdu, X. Yue, L. Liu, W. Wan, and L. Hu, On the occurrence of postmidnight equatorial F region irreg-ularities during the June solstice, J. Geophys. Res., 116, A04318, doi:10.1029/2010JA016056, 2011.
Miller, K., A. Hedin, P. Wilkinson, D. Torr, and P. Richards, Neutral winds derived from IRI parameters and from the HWM87 wind model for the Sundial campaign of September 1986,Adv. Space Res.,10(8), 99–102, 1990.
Obrou, O. K., D. Bilitza, J. O. Adeniyi, and S. M. Radicella, Equatorial F2-layer peak height and correlation with vertical ion drift and M(3000)F2,
Adv. Space Res.,31(3), 513–520, 2003.
Oyekola, O. S., Variation in the ionospheric propagating factor M(3000)F2 at Ouagadougou, Burkina Faso,Adv. Space Res.,46(1), 74–80, 2010. Oyekola, O. S., Comparisons of foF2 with IRI model and
equa-torial vertical drifts, Adv. Space Res., 48(8), 1318–1326, doi:10. 1016/j.asr.2011.06.027, 2011.
Pawlowski, D. J., A. J. Ridley, I. Kim, and D. S. Bernstein, Global model comparison with Millstone Hill during September 2005,J. Geophys. Res.,113, A01312, doi:1029/2007JA012390, 2008.
Rios, V. H., C. F. Medina, and P. Alvarez, Comparison between IRI pre-dictions and digisonde measurements at Tucuman,J. Atmos. Sol.-Terr. Phys.,69, 569–577, 2007.
Sethi, N. K., R. S. Dabas, and K. Sharma, Comparison between IRI predic-tions and digital ionosonde measurements of hmF2 at New Delhi during low and moderate solar activity,J. Atmos. Sol.-Terr. Phys.,70, 756–763, 2008.
566 O. S. OYEKOLA AND P. R. FAGUNDES:F2-LAYER PARAMETERS OBSERVATIONS AND COMPARISONS OVER OUAGADOUGOU
versus IRI representation,Adv. Space Res.,31, 569–575, 2003. Wilkinson, P. J., Ionospheric variability and the international reference
ionosphere,Adv. Space Res.,34, 1853–1859, 2004.
Yadav, S., R. S. Dabas, R. M. Das, A. K. Upadhayaya, K. Sharma, and A. K. Gwal, Diurnal and seasonal variation of F2-layer ionospheric param-eters at equatorial ionization anomaly crest region and their comparison with IRI-2001,Adv. Space Res.,45, 361–367, 2010.
Zhang, M. L., J. K. Shi, X. Wang, and S. M. Radicella, Ionospheric vari-ability at low latitude station: Hainan, China,Adv. Space Res.,34, 1860–
1868, 2004a.
Zhang, M. L., J. K. Shi, X. Wang, S. Z. Wu, and S. R. Zhang, Compara-tive study of ionospheric characteristic parameters obtained by DPS-4 digisonde with IRI2000 for low latitude station in China,Adv. Space Res.,33, 869–873, 2004b.