R E S E A R C H
Open Access
A coherent data filtering method for large scale
RF fingerprint Wi-Fi Positioning Systems
Jae-Hoon Kim
1and Woon-Young Yeo
2*Abstract
The rapid growth of mobile communication and the proliferation of smart phones have drawn significant attention to location-based services (LBS). The Wi-Fi positioning system (WPS) is a newly attractive method as a widely applicable positioning technique in LBS. In WPS, the received signal strength indication (RSSI) data of all Wi-Fi access points (APs) are measured, and stored in a huge database, as a form of radio fingerprint map. Because of the millions of APs in urban areas, radio fingerprint data are seriously contaminated. Therefore, we present a coherent filtering method for radio fingerprint data. All fingerprints used in the developed test bed are harvested from actual radio fingerprint measurements taken throughout Seoul, Korea. This demonstrates the practical usefulness of the proposed methodology.
Keywords: Location based service; Fingerprint; Data filtering; Wi-Fi positioning system
1. Introduction
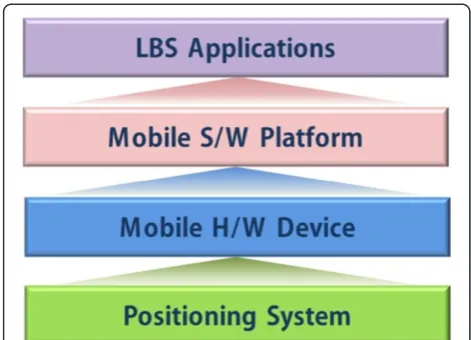
To improve its relevance, context, and economic value, a location-based service (LBS) coordinates user location with various end-user applications. Despite the many possibilities offered by LBS, its market penetration has been slow. Most early-stage services failed to spread to the mass market. Moreover, monetization of the services is limited to some special purpose markets, such as car map/navigation. The limitations of LBS are related mainly to the insufficient precision of position estima-tion. The general mean error of position estimation is in the order of many tens of meters, while the deviation can be of the order of hundreds of meters. The demon-stration of Figure 1 shows the layered technical structure for LBS. Among technical layers, the position quality is essentially determined by the positioning system.
The positioning system measures the estimated pos-ition of a moving object (usually a mobile handset), and then minimizes the difference between the actual and es-timated position. A well-eses-timated position can reduce the practical and emotional disjunction caused by the position difference.
The global positioning system (GPS) provides very precise positioning estimation [1,2]. Owing to current advances in GPS technology, GPS receivers can acquire GPS signals with power levels as low as −160 dBm. However, the GPS signal should be attenuated signifi-cantly when it travels through construction materials, or any other obstacle (note that signal strength of at least−145 dBm is needed to acquire ephemeris data; the unobstructed GPS signal strength on Earth is measured at about −130 dBm.) This attenuation of a GPS signal makes it difficult to find a sufficient number of GPS satellites for each receiver in the urban environment (in GPS triangulation, at least three satellites are required to identify a current position). Presently, LBS are mainly used in urban areas, even in indoor environments. Social networking, friend finders, and local search applications need extremely wide coverage of positioning technology with a very short time to first fix (TTFF). LBS applica-tions are shifting from rural areas, highways, and arterial roads, to urban and metropolitan areas.
With the rapid increase in Wi-Fi access points (APs) in metropolitan areas, Wi-Fi can be used as a viable al-ternative positioning infrastructure [3,4]. Each Wi-Fi AP generates a radio signal with a unique identifier or media access control (MAC) address every second, which enables mobile devices to identify the specific AP. The millions of public/private Wi-Fi APs can be used for * Correspondence:[email protected]
2
Department of Information and Communications Engineering, Sejong University, Seoul, Republic of Korea
Full list of author information is available at the end of the article
Wi-Fi-based positioning. On the basis of the received signal strength from each valid AP, and embedded algo-rithms, the typical accuracy of Wi-Fi positioning is in the order of tens of meters in metropolitan areas, which is more accurate than other cellular positioning tech-nologies, because Wi-Fi APs are more closely spaced than cellular network base stations. The TTFF can be as short as 100 ms. Compared with GPS, Wi-Fi positioning works better in urban canyons or indoor environments, than in rural area. It works well in dense metropolitan areas, both outdoors and indoors, owing to its greater-received signal strength and lower attenuation. The two major approaches that implement Wi-Fi positioning are AP triangulation, and radio frequency (RF) fingerprint. Triangulation is simple to implement [3,5,6]. As seen in
Figure 2a, three reference APs with already known coor-dinates are needed. After measuring the distance from the APs and a target point, three circles can be drawn. The circles intersect at one point, which is the target point. The coordinate of the target point can easily be calculated by the distance from, and the known coordi-nates, of the APs.
The main difficulty of this approach is measuring the distance from each AP to the target point. The typical path loss models (such as COST231, Okumura-Hata) are generally applied to measure the distance. However, it is extremely difficult to build a good and general model for distance measurement, which coincides with the actual field situation. RF fingerprinting [7,8] consists of two phases - training and positioning - demonstrated in Figure 2b. In the training phase, a reference finger-print database (DB) is constructed. The reference DB contains the signal strength measurements of the APs at all reference points. Usually, the entire area should be divided into a set of grids, and the centers of grids are usually considered the reference points. During the posi-tioning phase, the position of a target point can be iden-tified by comparing its measured fingerprint with the pre-stored reference fingerprint DB. The main advantage of RF fingerprinting is algorithmic simplicity. Simple comparing algorithms, such as pattern matching, can be easily applied to the practical process of position estima-tion. Then the RF fingerprinting is currently more pre-ferred than triangulation [9]. The most advancement for RF fingerprinting has been searched in the area of pos-ition estimation algorithms. A pattern matching algo-rithm is used to determine the geographical position of a Figure 1Layered technical structure for LBS.
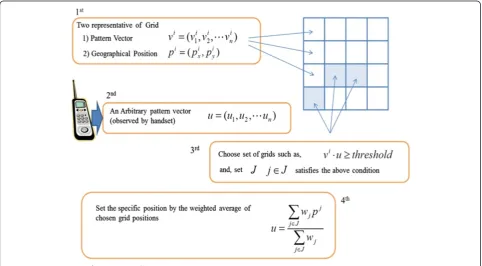
target point. When a fingerprint pattern of the test point is measured by a portable device (usually a handset), an algorithm compares the measured fingerprint with elements of the reference fingerprint DB. The most well-known pattern-matching algorithm is nearest neighbor (NN) [7]. As an enhanced version of the NN algorithm, the K nearest neighbor (KNN) algorithm can be taken into account [7]. The average of coordinates of k-reference grids can be used to determine the estimated position of the target point (see Figure 3 for a detailed procedure of pattern matching). Various variations, such as smallest polygon [10] and neural networks [11], are applied in the framework of KNN pattern matching. Another type of algorithm for positioning adopts a prob-abilistic framework. The idea of the probprob-abilistic frame-work is to compute the conditional probabilistic density function (pdf) of an estimated position given the measured fingerprint pattern at the target point. The probabilistic likelihood can be modeled by Histogram [12], Gaussian [11], Log-normal [13], or Kernel [12].
The main challenge related to RF fingerprinting is the creation and maintenance of an up-to-date reference fingerprint DB, which is especially difficult, due to the dynamic character of APs: they are often moved, or in some cases are temporary, with new APs being continu-ously deployed. The huge numbers of APs, both indoor and outdoor, are generally deployed in the urban envir-onment. These cause serious complexity to the finger-print DB management. In addition, the RSSI (measured
in dB unit) of each AP is an element of pattern vector. The difference between reference pattern and measured pattern determines the similarity of two patterns. Usu-ally, lots of information (i.e., number of elements in pat-tern vector) provides confidence to similarity estimation. However, we should consider the measurement error and characteristics of radio signal strength. Because of environmental interference, the measurement error is inevitable. We can observe usually ±3 dB or higher sig-nal strength fluctuation. The important thing is that the unit ‘decibel (dB)’ has log scale. That is, the difference between −75 and −87 dB means not just ‘12 (= −75 to−87)’degree separation. But, the signal power of−87 dB is 1/16 (i.e., 6.25%) of that of−75 dB. Same fluctuation on electromagnetic field gives extremely higher effect to low RSSI. Small signal power change on low RSSI makes a large change on the dB scale. AP information with low RSSI should be filtered (i.e., zero or very low weight on the AP with low RSSI) to guarantee estimation quality. A set of data filtering methods should be applied as a key manage-ment framework in a complex fingerprint DB.
The most popular common data filtering method is the Kalman filter [14]. The historically measured data can be unified with newly measured data, to eliminate data noise. However, the Kalman filter can just be ap-plied to statistical outliers, by comparing the historic and current data. It is too complicated to apply to practical large-scale fingerprint DB, and also, it cannot make any common cutover threshold for consistent
filtering in RF fingerprinting (the importance of consistent filtering in fingerprint WPS is described in Section 3).
Therefore, we propose a coherent data-filtering frame-work for standard RF fingerprint DB. The sufficiently valid fingerprint data are maintained by the proposed fil-tering framework. The number of APs for each reference fingerprint is maintained, with an effective level. The en-tire framework is described by an integer programming model. Moreover, we simultaneously propose a practical procedure for filtering, as a form of dynamic algorithm using an iterative function. As a result of a coherent fil-tering framework, we can make a standard RF finger-print DB, which is full of effective and valid data sets. All fingerprint data used in the developed test bed are harvested from actual radio fingerprint measurements taken throughout Seoul, Korea. This demonstrates the practical usefulness of the proposed framework.
2. RF fingerprint map
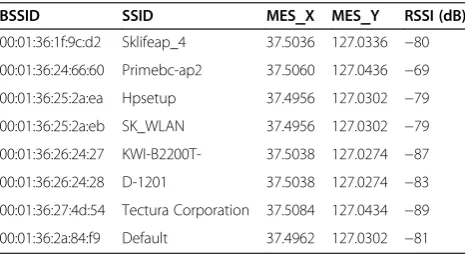
A reference RF fingerprint DB constitutes the funda-mental basic information of the proposed WPS. Most position estimation systems that use Wi-Fi APs require prior knowledge of the Wi-Fi RF fingerprint. The usual Wi-Fi fingerprints are collected in the form of Table 1.
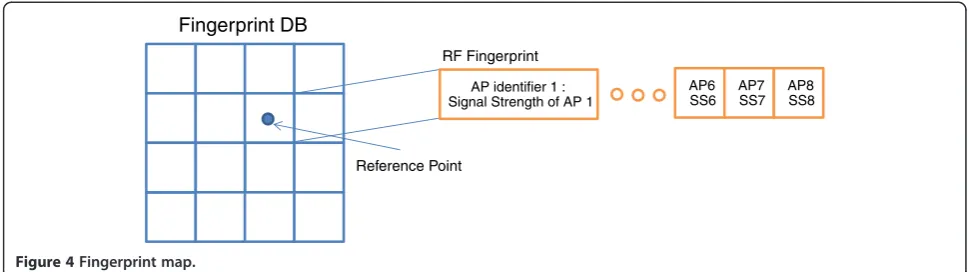
The Wi-Fi fingerprint consists of base station identifica-tion (BSSID; i.e., MAC address), service set identificaidentifica-tion (SSID), measurement X-axis (MES_X, i.e., Longitude), MeasurementY-axis (MES_Y, i.e., Latitude), and Received Signal Strength Index (RSSI). When an AP is detected by an automatic scanning device, the fingerprint data (i.e., BSSID, SSID, RSSI) are stored with its position (i.e., MES_X, MES_Y). These fingerprint data should be stored and handled as a DB map. A conventional reference fin-gerprint DB map consists of many grids. Each grid has RF fingerprint data consisting of AP identifiers (usually the MAC address of an AP), and the signal strength of each AP (see Figure 4).
In general, fingerprint data for reference DB are col-lected by wardriving. Wardriving is a data acquisition method for a position estimation system using Wi-Fi, and it is suitable for collecting fingerprint data over a
wide range [15]. We collected the entire fingerprint data of the Seoul Gangnam urban area, which contains about 110,000 grids. Figure 5 shows a sample of a reference fingerprint DB map, with grid representation.
An up-to-date reference fingerprint DB should be main-tained for precise position estimation. The segmented rescanning can be a promising way to update reference DB. The entire area is segmented into unit areas. Each unit area has distinguishable geographical characteristics, such as commercial, residential, and industrial or so. Then, a sample set of reference points is selected in a respective unit area. In general, the number of sample reference points is very small compared to total reference points, and the sample reference points are scattered uniformly throughout the unit area. We monitor the fingerprints of sample reference points periodically. The proportion of sample reference points, which have significantly different fingerprint pair for two time-consecutive monitoring epochs, is the determinant of area rescanning. If the pro-portion of significantly different fingerprint pairs is higher than a pre-specified ratio, we can conclude that the stored fingerprints of a unit area are not ‘valid’ (i.e., data is outdated), and we need to replace all fingerprints of the unit area by rescanning. Otherwise, the fingerprints of the unit area are verified as still valid, and remained to the reference fingerprint DB. Note that RF fingerprint DB is not stored in each handset in real applications. All applica-tions send requests of position estimation to a location server which contains entire RF fingerprint DB.
A reference fingerprint DB map gives two types of in-formation:‘the number of APs per grid’, and‘the cover-age of an AP’. The number of APs per grid determines the size of fingerprint DB map. The size of the map has a strong relationship with both the calculation speed and accuracy of position estimation. A set of APs that have relatively low RSSI values has limited effect for pos-ition estimation. The valuable fingerprint data are ob-tained from the APs that have higher RSSI values. The higher RSSI value means closer location from a refer-ence point of the fingerprint DB map. Figure 6 shows the coverage of an AP. The coverage is shown as a set of detected grids of the AP. By the change of RSSI cutover threshold from −90 to −55 dB, the coverage of an AP shrinks to a smaller range.
The proper cutover threshold filters out the ineffect-ive APs, decreases the number of detected APs per grid, and then finally restricts the coverage of the APs. The restricted AP coverage guarantees the higher likelihood for fixation of position estimation. There-fore, the determination of a cutover threshold for each AP is the essential point for reference fingerprint DB management. The key of the proposed coherent data filtering framework is the determination of the cutover threshold.
Table 1 Example of the Wi-Fi AP fingerprint
BSSID SSID MES_X MES_Y RSSI (dB)
00:01:36:1f:9c:d2 Sklifeap_4 37.5036 127.0336 −80
00:01:36:24:66:60 Primebc-ap2 37.5060 127.0436 −69
00:01:36:25:2a:ea Hpsetup 37.4956 127.0302 −79
00:01:36:25:2a:eb SK_WLAN 37.4956 127.0302 −79
00:01:36:26:24:27 KWI-B2200T- 37.5038 127.0274 −87
00:01:36:26:24:28 D-1201 37.5038 127.0274 −83
00:01:36:27:4d:54 Tectura Corporation 37.5084 127.0434 −89
3. Coherent data filtering and compensation In our experiment in the Gangnam district of Seoul, we collected 0.6 million fingerprint patterns in a single col-lection cycle. Moreover, a single measured fingerprint pattern contains more than 30 AP identifications (i.e., BSSID) and RSSI measurement data, on average. The total data volume collected in our single collection cycle
exceeds hundreds of megabytes. This huge volume of fingerprint data has a significant negative effect on both the running speed of the positioning estimation algo-rithm, and reference fingerprint DB map maintenance. Moreover, the dimension of fingerprint should be re-stricted, for practical pattern matching type position es-timation algorithms (the dimension of a fingerprint is
Fingerprint DB
Reference Point
AP identifier 1 : Signal Strength of AP 1
AP6 SS6
AP7 SS7
AP8 SS8
RF Fingerprint
Figure 4Fingerprint map.
the number of (AP identification and RSSI value) pairs, as shown in Figure 7). For the entire domestic national data collection and efficient position estimation, the fil-tering mechanism should be widely applied, in any form whatsoever.
Figure 7 shows the general filtering structure of the pro-posed method. To maintain the consistency of filtering, cut-over RSSI thresholds are applied to both the ‘reference fingerprint DB’and‘fingerprint measured by handset in po-sitioning stage’. The simultaneous application of common cutover thresholds gives consistency to the fingerprint pat-tern matching in the actual positioning stage. The entire
framework to determine the proper cutover threshold can be mathematically described as the following integer pro-gramming models (1), (2), (3), (4), and (5).
Minimize ∑
jjgj−mjj ð1Þ
S:T: mj¼∑
iyij ð2Þ
yij≤oij ð3Þ
ðoij−yijÞrij≤yijrij ð4Þ Figure 6Coverage change of an AP.
Common Fingerprint Filter
Fingerprint Map
AP1 RSSI
AP3 RSSI
AP8 RSSI
AP9 RSSI Measured Fingerprint Pattern by Handset
Common Filtering Threshold for AP1 AP1
RSSI AP5 RSSI
AP7 RSSI
AP9 RSSI
Common Filtering Threshold for AP9
Dimension of Fingerprint Dimension of Fingerprint
Synchronous Dimension for Fingerprints
yij;oij¼f0 or 1g ð5Þ
where gj is the desired number of APs in grid j. Note thatgjdetermines the numerical dimension in a position estimation algorithm. A typical position estimation algo-rithm uses a pattern-matching method. The synchron-ous and proper dimensioning of pattern matching is important for the significance and running speed of esti-mation. The practical value ofgjcan be fixed as differen-tiated numbers, according to the regional characteristics, such as residential or commercial areas (i.e., smaller values for residential and larger ones for commercial). mj denotes the number of APs offered for grid j in the reference fingerprint DB map, after filtering. Thus, the objective function (1) minimizes the difference between the desired and offered number of APs, for all grids in the reference DB map. Equation 2represents the calcu-lation ofmj. yij is determined as 1, if APi in grid j sur-vives after the filtering, otherwise as 0. The summation ofyijfor allis in a gridj(i.e.,∑
i yij) can make the value of mj. oij means the original existence of APi in grid j. When APiis originally detected in grid j, the value ofoij is determined as 1, otherwise as 0. The inequality (3) shows the existence of APi in gridjbefore and after fil-tering. The candidate APs for filtering should be selected among the originally detected APs by the inequality (3). The inequality (4) guarantees that all survived AP RSSIs are greater than the RSSIs of filtered APs. (oij−yij) has value 1 (i.e., (oij−yij) = 1), if APi in grid j is filtered. Thus, (oij−yij)rij means RSSIs of filtered APs. (oij−yij)rij should be less than theyijrij, the RSSIs of survived APs. rijis the measured RSSI of APiin gridj. For arithmetical consistency, we slightly modify the RSSI of AP in our model, in the form of rij=−1/RSSIij(RSSIij is the actual measured value of RSSI for APiin gridj(unit: dB)).
The proposed mathematical model determines the cutover RSSI threshold for each AP in each grid. Then, it can select optimal significant APs for each grid. The
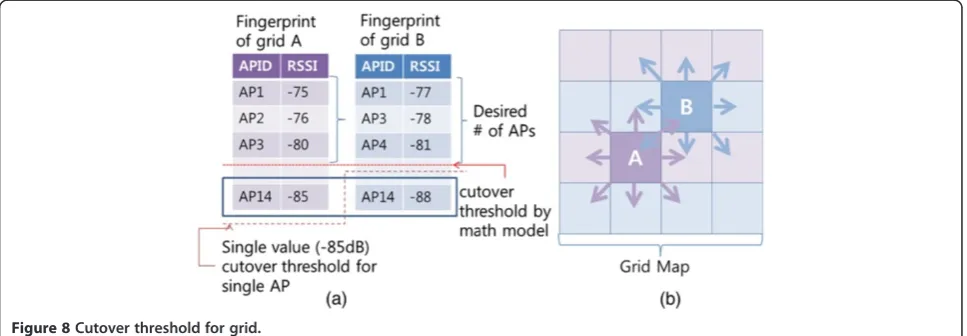
determined RSSI threshold guarantees the minimum dif-ference between the desired and offered number of APs. However, for coherent application of common cutover threshold to both the‘reference DB map’and‘measured fingerprint by handset’, the practical cutover threshold should be given for each AP as a single value, not for each grid (a mobile handset does not know its current grid position in the positioning stage). The determined RSSI cutover threshold by the mathematical model can make multiple thresholds for a single AP. Figure 8a shows the discrepancy of RSSI thresholds for a specific AP (i.e.−85 and−88 dB for AP14) in the mathematical modeling approach.
To get a practical cutover RSSI threshold for each AP, we should determine a single value threshold for a single AP, such as−88 dB for AP14 in Figure 8a, or−85 dB for AP14. This single-value threshold determination cannot maintain the optimality of the aforementioned mathemat-ical model, but it can give the common cutover threshold to both the reference DB map building and handset positioning. Because of the dynamic interaction between adjacent grids, as presented in Figure 8b, a single-value threshold should be determined, under the harmonization among grids. The decrement or increment of single-value threshold can make for a different offered number of APs among grids. We suggest a dynamic type of algorithm to determine a harmonized single-value threshold for each AP.
Equation 6 shows the single-value RSSI threshold de-termination for APi. |gĵ(k)−mĵ(k)(RSSIAPi)| has the same
meaning in function (1), except that mĵ(k)(RSSIAPi)
de-notes the offered number of APs for grid ĵ(k) under the given RSSIAPi(a gridĵ(k) is in a grid setĵwhich has APi as a detected AP in its fingerprint; k is the ordering index for each grid in a setĵ). RSSIAPiis the determined single-value RSSI threshold for APi. The RSSIAPi guar-antees the minimum difference between the desired and offered number of APs for grids ĵ. The RSSIAPi values are determined by an iterative Equation (7):
fnþ1 RSSIAPnþi1
¼ g^j nþð 1Þ−m^j nþð 1Þ RSSIAPnþi1
þfnRSSIAPn i ð7Þ
The functionfn* in Equation 7 denotes the summation
of difference between the desired and offered number of APs from the 1st to thenth grid, under the given current RSSI threshold for APi, RSSInAPi *. The fn+1 can be
ob-tained by the summation of ‘the nthfunction value (i.e. fn*(RSSInAPi*))’and‘difference between the desired and
of-fered number of APs for the n+ 1th grid (i.e., |gĵ(n+1)−
mĵ(n+1)(RSSInAP+1i)|)’. The difference between the desired
and offered number of APs for then+ 1th grid is calcu-lated under the RSSI threshold of APiin then+ 1th grid. Now, we compare the fn+1(RSSInAP+1i) and fn+1(RSSInAPi*). If
the gap between fn+1(RSSInAP+1i) and fn+1(RSSInAPi*) is lower
than a pre-specified range, the current RSSI threshold for
APiis maintained at the same value for thenth grid, (i.e., RSSInAP+1i* = RSSInAPi*). Otherwise, we configure the new
current RSSI threshold as RSSInAP+1i. Note that the RSSI
threshold (i.e., RSSInAPi for all i and n) is ideally obtained
from the integer programming models (1) ~ (5). However, we have a candidate RSSI range, namely RSSInAPi=
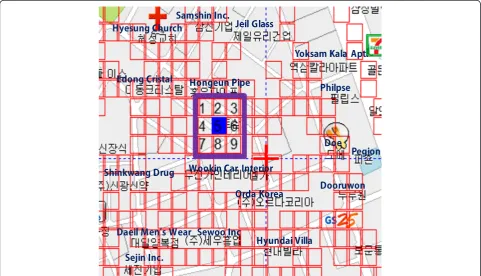
{min-RSSIAPi,…, maxRSSIAPi}, for calculation convenience. The complexity of the proposed dynamic algorithm is O(nC),n is the number of neighboring grids of target grid and C is the scale factor of RSSI measure. To specify all APs in a grid (if we assumek APs per grid), we need maximumk implementations of the dynamic algorithm of O(nC) com-plexity (i.e., total O(nkC) complexity of implementations). The selection of APs in online positioning stage is totally based on the common cutover RSSI threshold of specific AP. The process of online positioning stage is relatively simple. Just applying the common cutover RSSI threshold can give the simplicity in practical application in online po-sitioning process. Figure 9 shows the sample grid area for calculation of the proposed filtering method. A total of nine neighbor grids are selected for applying the filtering method. We assume the desired number of APs as a single value of 10, for simplicity (the determination of desired number of APs (i.e.,gj) is described in the Appendix).
By applying the filtering method, we obtain the follow-ing results (Table 2), which show the offered numbers of
APs for each grid. The average offered numbers of APs are very close to the desired number. The difference is reduced from 7.67 to 2.56.
After the filtering by single-value cutover RSSI thresh-old, we perform a fingerprint compensation process in the building of reference DB, based on a coherence test. The collected fingerprint data have empirical fluctua-tions on RSSI caused by environmental factors. The hu-man movement makes a short-range fluctuation of RSSI (The human body is a sort of radio wave absorber. Approximately 3 dB is attenuated throughout the single human body). We can compensate imperfectly measured RSSI values by the compensated ones. Figure 10 shows the concept of compensation. First, we find the temporal fluctuation on RSSI. Because of human movement, RSSI
can be fluctuated temporally. Thus, we collect RSSI meas-urement data from several different time bands at each col-lection point. If the difference of RSSI measurements is greater than a certain level, we select vertical and horizon-tal neighbor grids and apply a smoothing technique. By the curve fitting (linear or exponential) with neighboring RSSI values, the two newly compensated RSSI values (i.e., verti-cal and horizontal) are obtained according to both the ver-tical and horizontal axis”.
Using the filtering and compensation mechanism, the volume of fingerprint data is significantly reduced, and the data quality is highly enhanced, for precise position estimation. The common RSSI threshold for both the reference fingerprint DB and handset-measured finger-print gives effective dimension of the fingerfinger-print, which imparts good estimation quality, with sufficiently fast running speed for position estimation algorithms.
4. Numerical results
To show the applicability of the proposed filtering and compensation methods, we collected all the fingerprint data from the Seoul Gangnam urban district, which con-tains about 110,000 grids. A single scanning process usu-ally generates approximately 600,000 fingerprint data. This is a huge amount of data, and a relatively large area is not
Table 2 Results for sample filtering
Grid# 1 2 3 4 5 6 7 8 9
Before filteringa 25 19 18 21 13 18 7 8 20
|gj‐mj| 15 9 8 11 3 8 3 2 10
After filteringb 11 10 9 15 9 9 5 6 15
|gj‐mj| 1 0 1 5 1 1 5 4 5
a
Average difference 7.67, average offered APs 16.56;b
Average difference 2.56, average offered APs 9.889.
RSSI Filter Threshold Setup Area
Setup
Color tone by measured number of APs. Dark Red shows greater number of APs
compared to Light Red
Figure 11Snapshot of analyzing tool.Note: All Korean characters indicate names of places. The imported map uses Korean geographical interface.
(a)
(b)
Figure 13Comparison of before/after filtering. (a)Area 14.(b)Area 19.Table 3 Single-value thresholds for APs
AP index Cutover threshold (dB) AP index Cutover threshold (dB) AP index Cutover threshold (dB)
952 −95 976 −79 1,000 −60
953 −69 977 −76 1,001 −85
954 −40 978 −73 1,002 −95
955 −95 979 −81 1,003 −95
956 −84 980 −79 1,004 −85
957 −79 981 −84 1,005 −77
958 −85 982 −81 1,006 −81
959 −76 983 −77 1,007 −76
960 −78 984 −75 1,008 −75
961 −81 985 −78 1,009 −83
962 −67 986 −54 1,010 −95
963 −95 987 −40 1,011 −95
964 −84 988 −95 1,012 −95
965 −95 989 −79 1,013 −95
966 −79 990 −79 1,014 −76
967 −61 991 −81 1,015 −55
968 −61 992 −95 1,016 −95
969 −85 993 −95 1,017 −76
970 −64 994 −61 1,018 −87
971 −80 995 −84 1,019 −76
972 −79 996 −83 1,020 −76
973 −79 997 −83 1,021 −85
974 −81 998 −79 1,022 −51
suitable for testing and enhancing the details of the filtering method. Thus, we constructed a Windows-based perform-ance analysis tool, as shown in Figure 11. The analysis tool shows the density of APs by different coloring (Light red means relatively light density of APs; dark red means relatively high AP density.). We applied the proposed fil-tering method and evaluated its performance in a rela-tively restricted area as the first step.
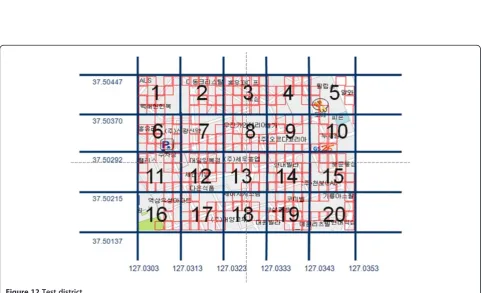
The test area shown in Figure 12 is a square district (320 m × 500 m) in Gangnam, Seoul. This district is classified as a commercial area in Seoul. It includes many commercial buildings and dense foot traffic. There are 248 grids. A total of 1,267 APs are detected. Each grid has one fingerprint, which has 26.6 APs and their RSSI measure-ment value, on average. A total of 6,566 (AP identification
and RSSI value) pairs are used to build the reference fingerprint DB.
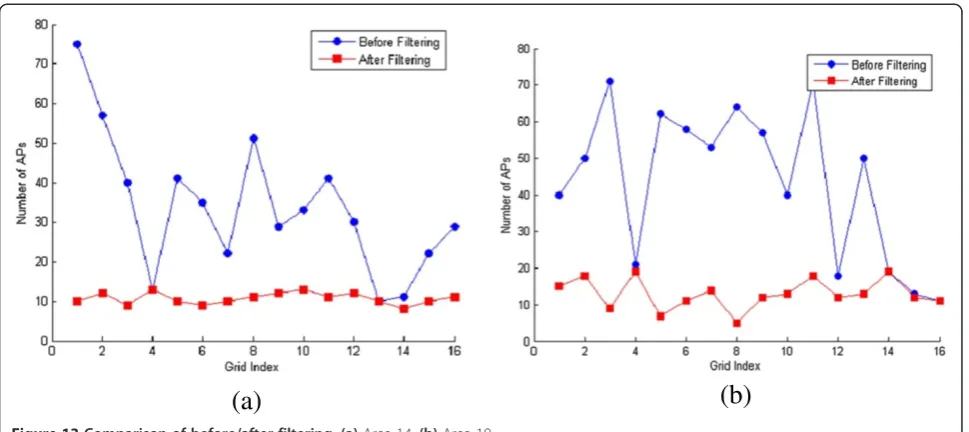
The proposed filtering method greatly reduces the vol-ume of data: from 6,566 measurement pairs (26.6 APs per grid on average), to 2,751 (10.9 APs per grid on average). Approximately 60% of the measurement data are filtered out by the proposed method. Figure 13 shows the differ-ence of the originally measured APs and offered APs by the filtering method, for areas 14 and 19 of Figure 13. The offered numbers of APs are in the range of the desired number of APs per grid (we set the desired number of APs to 10 for the test).
Table 3 shows the single-value RSSI thresholds for APs. We list a part of the whole list of thresholds for reference.
Figure 14Test districts in Gangnam, Seoul.
Table 4 Position estimation error for test districts
Test district Commercial/ residential
Average error without filtering (m)
Average error with unified RSSI filter (m)
Average error with coherent filtering and compensation (m)
Coherent filtering only
Coherent filtering and compensation
1 65:35 64 63 52 49
2 25:75 49 47 42 41
3 60:40 72 72 53 53
4 30:70 56 55 43 42
5 70:30 81 79 57 55
6 40:60 47 46 42 41
7 55:45 59 58 44 41
8 70:30 74 71 54 51
9 75:25 76 73 61 58
10 50:50 62 61 50 49
Average - 64.0 62.5 49.8 48
Next, we extended coherent filtering and compensa-tion in a large area. Ten test districts (see Figure 14) in Seoul Gangnam were selected to prove the applicability of the proposed filtering method. The area of Gangnam district is 39.55 km2. The range of area for test districts is 0.10 ~ 0.17 km2. Each district has 50 ~ 60 target points for position estimation.
We apply the well-known and widely used the KNN pattern matching algorithm [7]. The results prove the ef-fectiveness of the proposed method, in various diversified environments of an urban area. For comparison purposes, Table 4 includes the results of ‘W/O filtering’and the‘ uni-fied RSSI filter’. In the unified RSSI filter, we apply the same RSSI cutover threshold for all APs, of−85 dBm.
The results show the effect of the proposed method. An average of 22% enhancement (for coherent filtering only) and 25% enhancement (for coherent filtering and compen-sation) are measured for 10 different districts. Most of the enhancement depends on coherent filtering. The contribu-tion of compensacontribu-tion is somewhat limited. We also attach
the ratio of land utilization (commercial/residential) for test districts. Each test district has its differentiated ratio for commercial and residential areas. The enhancement is diversified with the range (5 ~ 24 m). We can observe the relatively higher enhancement for commercial-oriented dis-tricts. The commercial-oriented districts have approxi-mately 18-m (range 12 ~ 24 m) enhancement, whereas approximately 8-m (range 5 ~ 13 m) enhancement for residential-oriented districts. Figure 15 directly shows the effectiveness of the proposed method by a graphic chart.
Note that the majority of test points belong to the out-door environment. The automatic scanning vehicle has an access problem to the indoor environment. The most of in-door fingerprints are collected by human power. Thus, our experiment has a limitation for the applicability on indoor environment. However, our proposed framework are ap-plicable both on indoor and outdoor environments. The radio signal fluctuation and structure complexity are more serious in an indoor environment. The proposed coherent filtering framework has relative advantage on the complex Figure 15Error difference between before/after filtering.
and fluctuated environment (see the comparison between commercial and residential). We carefully expect the ef-fective application to the indoor environment.
5. Conclusion
The rapid growth of mobile communication and the proliferation of smart phones have drawn significant at-tention to location-based services. One of the most im-portant factors in the vitalization of LBS is the accurate position estimation of a mobile device. Traditional tri-angulation has an inevitable weakness, in estimating an AP's exact position. Moreover, significant technical ad-vances are not shared publicly by solution providers. RF fingerprint WPS is an alternative valuable way to pene-trate the positioning solution provider market. Even by indiscriminate fingerprint collection, providers can build a fingerprint DB and apply a simple pattern-matching al-gorithm for position estimation. However, to build a competitive fingerprint WPS solution, we should focus on fingerprint data management, and precise estimation algorithms. The essential factor of radio fingerprint map is the data integrity of RSSI. Because of millions of APs in the urban area, RSSI measurement data are seriously contaminated. Therefore, we present a coherent filtering method for RSSI measurement data. In our method, we built a new fingerprint filtering method. Based on the sin-gle cutover threshold and data coherency, collected finger-prints are filtered and compensated. A new fingerprint data filtering for position estimation can strengthen the ad-vantages of RF fingerprint WPS. Compared to the existing approaches for fingerprint filtering, our method achieves a better performance, in both average error of estimation, and deviation of errors. Furthermore, all the fingerprint data were harvested from the actual measurement of RF fingerprints in Seoul's Gangnam district. We built an ef-fectively filtered fingerprint DB for the entire area of Seoul and applied position estimation. These trials show the practical usefulness of the proposed methodology.
Appendix
The higher number of gjprovides more information for
precise position estimation. On the other hand, it also generates larger deviation (i.e., the deviation is gradually increased according to increment of gj). The following
statistical implication shows the negative effect (i.e., large deviation on position estimation) by the increment ofgj.
The similarity of two patterns is usually determined by the Euclidian distance of two different patterns. That is, the statistical difference between two fingerprints is based on the square of the Euclidean distance (d2(i, j)) between two fingerprint pairs (fi,fj) as d2(i, j) = (fi−fj)2,
where fi= {RSSIAPi 1, RSSIAPi 2,…, RSSIAPni }, fj= {RSSIAPj 1,
RSSIAPj 2,…,RSSIAPnj }. Each value ofRSSIAPki (RSSI for APk
in fingerprint fi) is a random variable and has a
measurement error that tends to follow a normal distri-bution. Thus, each element of vectorfi−fjalso follows a
normal distribution. By transforming the elements of vector fi−fj to the standard normal distribution, d2(i, j)
tends to follow a chi-square distribution with a degree of freedomn(i.e., d2ð Þi;j eχ2ð Þn ). Generally, the χ2(n) has a mean n and variance 2n. The value of n is determined bygj, then, deviation of position error is increased by the
increment ofgj(i.e., ifnis increased, variance (2n) is also
increased).
Now, we have to find the tradeoff relation between
‘deviation caused by higher gj’ and ‘information density obtained by higher gj’. We adopt an empirical experi-ment to find the proper number of gj. Figure 16 shows
three representative illustrations for position estimation error.
This figure shows the position estimation error for three test districts: (1) residential-oriented district (district 2 in Table 4), (2) commercial-oriented district (district 5 in Table 4), and (3) neutral district (district 10 in Table 4). Despite of small difference, significant range of gj can be
found; 9 ~ 11 APs are sufficient numbers for position esti-mation. From the knowledge of empirical experiments, we can apply propergjto practical reference DB management.
Note that this empirical experiment cannot give an abso-lute value ofgjfor all cases. The repetitive experiments are
required to guarantee the effectiveness of the empirical method.
Competing interests
The authors declare that they have no competing interests.
Acknowledgements
This research work is supported by SK Telecom in South Korea. All collected data are obtained using the facility of SK Telecom. This work was also supported by the National Research Foundation of Korea (NRF) grant funded by the Korean Government (2013–025572).
Author details
1
Department of Industrial Engineering, Ajou University, Suwon, Republic of Korea.2Department of Information and Communications Engineering, Sejong University, Seoul, Republic of Korea.
Received: 7 June 2013 Accepted: 12 January 2014 Published: 21 January 2014
References
1. Y Masumoto,Global positioning system, US Patent 5,210,540, 11, May 1993 2. JM Watters,Combining GPS with TOA/TDOA of cellular signals to locate
terminal, US Patent 5982324, 14, May 1998
3. S Wireless,Estimation of positioning using WLAN access point radio propagation characteristics in a WLAN Positioning System, US Patent 7515578, World Intellectual Property Organization, 22, Nov 2007
4. J del Prado Pavon, Link adaptation strategy for IEEE 802.11 WLAN via received signal strength measurement, inWireless Communication and Networking Conference, (New Orleans, 16–20 March 2003)
6. S Wireless,Location beacon database and server, method of building location beacon database, and location based service using same, US 62310804, World Intellectual Property Organization, 29Oct 2004
7. B Li, J Salter, AG Dempster, C Rizos, Indoor positioning techniques based on Wireless LAN, inThe First IEEE International Conference on Wireless Broadband and Ultra Wideband Communications, (Sydney, Australia, 13–16 March 2006) 8. B Li, IJ Quader, AG Dempster, On outdoor positioning with Wi-Fi. Journal of
GPS7, 1 (2008)
9. S Das, T Teixeira, SF Hasan, Research issues related to Trilateration and fingerprinting methods. Int J Res Wireless Systems1, 33–35 (2012) 10. D Pandya, R Jain, E Lupu, Indoor location estimation using multiple wireless
technologies, inProceedings of the 15th IEEE International Symposium on Personal Indoor and Mobile Radio Communication (PIMRC), (Beijing, China, 7–1 Sept 2003)
11. R Battiti, TL Nha, A Villani,Location-aware computing: a neural network model for determining location in wireless LANs, Technical Report DIT-02-0083
(University of Trento, 2002). http://eprints.biblio.unitn.it/233/
12. A Haeberlen, E Flannery, AM Ladd, A Rudys, DS Wallach, LE Kavraki, Practical robust localization over large-scale 802.11 wireless networks, inProceedings of the 10th annual international conference on Mobile computing and networking (MobiCom’04), (Philadelphia, 26 Sept - 1 Oct 2004)
13. K Kaemarungsi,Distribution of WLAN received signal strength indication for indoor location determination, 2006 1st International Symposium on Wireless Pervasive Computing, Phuket, Thailand, 16–18, Jan 2006
14. G Welch, G Bishop,An Introduction to the Kalman Filter(University of North Carolina, Technical Report, 2006)
15. H Yoshida, S Ito, N Kawaguchi, Evaluation for pre-acquisition methods for position estimation system using Wireless LAN, inProceedings of the Third International Conference on Mobile Computing and Ubiquitous Networking (ICMU 2006), (London, UK, 11–13 Oct 2006), pp. 148–155
doi:10.1186/1687-1499-2014-13
Cite this article as:Kim and Yeo:A coherent data filtering method for large scale RF fingerprint Wi-Fi Positioning Systems.EURASIP Journal on Wireless Communications and Networking20142014:13.
Submit your manuscript to a
journal and benefi t from:
7 Convenient online submission
7 Rigorous peer review
7 Immediate publication on acceptance
7 Open access: articles freely available online
7 High visibility within the fi eld
7 Retaining the copyright to your article