An economic evaluation of vector control in
the age of a dengue vaccine
Christopher Fitzpatrick1
*, Alexander Haines1,2¤
, Mathieu Bangert1, Andrew Farlow3, Janet Hemingway4, Raman Velayudhan1
1 Department of Control of Neglected Tropical Diseases, World Health Organization, Geneva, Switzerland, 2 National Guideline Centre, Royal College of Physicians, London, United Kingdom, 3 Oxford Martin School,
University of Oxford, Oxford, United Kingdom, 4 Department of Vector Biology, Liverpool School of Tropical Medicine, Liverpool, United Kingdom
¤ Current address: Toronto Health Economics and Technology Assessment Collaborative, University Health Network, Toronto, Canada
Abstract
Introduction
Dengue is a rapidly emerging vector-borne Neglected Tropical Disease, with a 30-fold increase in the number of cases reported since 1960. The economic cost of the illness is measured in the billions of dollars annually. Environmental change and unplanned urbaniza-tion are conspiring to raise the health and economic cost even further beyond the reach of health systems and households. The health-sector response has depended in large part on control of the Aedes aegypti and Ae. albopictus (mosquito) vectors. The cost-effectiveness of the first-ever dengue vaccine remains to be evaluated in the field. In this paper, we exam-ine how it might affect the cost-effectiveness of sustaexam-ined vector control.
Methods
We employ a dynamic Markov model of the effects of vector control on dengue in both vec-tors and humans over a 15-year period, in six countries: Brazil, Columbia, Malaysia, Mexico, the Philippines, and Thailand. We evaluate the cost (direct medical costs and control pro-gramme costs) and cost-effectiveness of sustained vector control, outbreak response and/ or medical case management, in the presence of a (hypothetical) highly targeted and low cost immunization strategy using a (non-hypothetical) medium-efficacy vaccine.
Results
Sustained vector control using existing technologies would cost little more than outbreak response, given the associated costs of medical case management. If sustained use of existing or upcoming technologies (of similar price) reduce vector populations by 70–90%, the cost per disability-adjusted life year averted is 2013 US$ 679–1331 (best estimates) rel-ative to no intervention. Sustained vector control could be highly cost-effective even with less effective technologies (50–70% reduction in vector populations) and in the presence of a highly targeted and low cost immunization strategy using a medium-efficacy vaccine.
a1111111111
Citation: Fitzpatrick C, Haines A, Bangert M, Farlow
A, Hemingway J, Velayudhan R (2017) An economic evaluation of vector control in the age of a dengue vaccine. PLoS Negl Trop Dis 11(8): e0005785.https://doi.org/10.1371/journal. pntd.0005785
Editor: Olaf Horstick, University of Heidelberg,
GERMANY
Received: January 3, 2017
Accepted: July 6, 2017
Published: August 14, 2017
Copyright:©2017 Fitzpatrick et al. This is an open access article distributed under the terms of the Creative Commons Attribution License, which permits unrestricted use, distribution, and reproduction in any medium, provided the original author and source are credited.
Data Availability Statement: All code and data
necessary to run the code are available from https://bitbucket.org/who_ntd/den_cea_plos/src.
Funding: The authors received no specific funding
for this work.
Competing interests: The authors have declared
Discussion
Economic evaluation of the first-ever dengue vaccine is ongoing. However, even under very optimistic assumptions about a highly targeted and low cost immunization strategy, our results suggest that sustained vector control will continue to play an important role in mitigat-ing the impact of environmental change and urbanization on human health. If additional ben-efits for the control of other Aedes borne diseases, such as Chikungunya, yellow fever and Zika fever are taken into account, the investment case is even stronger. High-burden endemic countries should proceed to map populations to be covered by sustained vector control.
Author summary
Transmitted by theAedesmosquito, dengue affects more than 100 countries and is rapidly emerging as the leading vector-borne disease. There has been a 30-fold increase in the number of cases reported since 1960. The cost of the illness to the health system and to society at large is estimated at several billions of dollars annually. The health sector response has depended in large part on controlling mosquito populations during out-breaks. Recently, the first-ever dengue vaccine received regulatory approval for use in sev-eral countries. However, its roll-out and long-term impact still needs to be evaluated in the field. In this paper, we examine how the introduction of this vaccine might alter the investment case for sustained effort to control mosquitoes. To our knowledge, this is the first economic evaluation of mosquito control in the era of the dengue vaccine. We model the cost and effects of mosquito control in Brazil, Columbia, Malaysia, Mexico, the Philip-pines, and Thailand. We evaluate the cost-effectiveness of mosquito control in the pres-ence of a vaccine that does not offer full protection to all individuals. Our results suggest that sustained mosquito control will continue to be cost-effective, even if roll-out of the current vaccine is highly targeted and low-cost. These results support current global poli-cies and strategies for the prevention and control of dengue.
Introduction
Dengue is a rapidly emerging disease endemic in more than 100 countries, with evidence of transmission reported in 128 countries [1]. Today, hundreds of thousands of severe dengue cases arise every year, including about 20 000 deaths. The economic cost of the illness in the Americas and South-East Asia is already measured in the billions of dollars annually, including costs such as work and school days lost [2][3][4]. In the Western Pacific, between half and two-thirds of affected households have incurred debt as a result of the care they received [5] [6]. Environmental change and unplanned urbanization are conspiring to raise the cost of den-gue infection further beyond the reach of health systems and households. In 2014, Southern China suffered the worst outbreak of dengue fever in more than two decades; Japan saw autochthonous transmission in its first outbreak of the disease since 1945 [7,8].
disability-adjusted life year (DALY) averted by vector control at US$ 1992–3139 (presumably in 2005 US $). Since then, the dengue economics literature suggests lower cost-effectiveness ratios ranging from 2005 US$ 227 (2013 US$ 344) per DALY averted by larval control in Cambodia to 2009 US$ 615–1267 (2013 US$ 802–1652) per DALY averted by adult mosquito control in Brazil [9] [10].
A recent systematic review concluded that results were not easily comparable due to differ-ences in methodological assumptions, and that combined control strategies remained largely unexplored [11].
The authors note that “there is growing interest in combining vector control with vaccina-tion once a dengue vaccine becomes widely available, which recognizes that one intervenvaccina-tion is insufficient to effectively reduce the burden of disease.” They cite results from studies with malaria and lymphatic filariasis that support the impact of simultaneously targeting vectors and pathogens.
Prior to 2015, the absence of a dengue vaccine did not preclude efforts to model the condi-tions under which such an immunization strategy might be cost-effective [12][13][14][15]. Prospects for a viable immunization strategy have since improved, though not without compli-cations [16]. In December 2015, the first-ever dengue vaccine, known as chimeric yellow fever virus-dengue virus tetravalent dengue vaccine or CYD-TDV (Dengvaxia), was approved for use in the Philippines. A strategy consisting of one year of catch-up vaccinations targeting chil-dren 9–15 years of age, followed by regular vaccination of 9-year-old chilchil-dren, may be cost-effective at costs up to $72 from a health-care perspective and up to $78 from a societal per-spective [17]. However, a review of the results of eight independent modelling groups con-cluded that “the potential risks of vaccination in areas with limited exposure to dengue as well as the local costs and benefits of routine vaccination are important considerations” [18].
It has been argued that, even in the era of a vaccine, the health sector response to dengue is expected to continue to depend in large part on vector surveillance and control [19,20]. In this paper, we undertake a comprehensive review and synthesis of the evidence on the cost and cost-effectiveness of dengue control interventions from the health system perspective. We appraise the cost-effectiveness of sustained vector control (including outbreak response) in the presence of a (hypothetical) highly targeted and low-cost immunization strategy using a (non-hypothetical) medium-efficacy vaccine. We consider also outbreak response and/or medical case management alone. We model a zero-cost or null scenario in which no intervention at all is implemented (not even medical case management).
We generate cost and cost-effectiveness estimates for six middle-income countries: Brazil, Columbia, Malaysia, Mexico, the Philippines, and Thailand. These countries were the focus of recent systematic reviews of epidemiological trends and make up an estimated 15% of the global burden of dengue [21]. Our approach is deliberately conservative. As the focus of the study is assessing the cost-effectiveness of vector control in the age of a dengue vaccine, a con-servative approach means making generous assumptions about the efficacy and cost of the vac-cine and ungenerous assumptions about the efficacy and cost of vector control.
Methods
percentiles across all iterations. For cost-effectiveness, we report uncertainty using cost-effec-tiveness acceptability curves and a Net Monetary Benefit (NMB) approach.
Baseline model with outbreaks, urbanization and climate change
The model runs two probabilistic Markov chains in parallel–one each for vector and human populations. The model is depicted in Supporting InformationS1 Fig. In every cycle, the prob-ability of a vector being infected with the dengue virus, thus moving from susceptible (SV) to
infected (IV), is dependent on the number of infected humans in the previous cycle. Likewise
the probability of a susceptible human (SH) being infected is dependent on the number of
infected vectors. However, susceptible humans are separated into two categories, denoted SH1
and SH2,representing susceptibility to first and second infections respectively, or DH1and
DH2.
New-borns enter the model in state NBH. New-borns have maternal immunity and
there-fore remain immune from dengue infection for a period of time. As maternal immunity wanes, new-borns enter the susceptible population (SH1). When a human recovers from their
first infection (DH1), they enter a state of recovery from first infection (RH1). In state RH1,
humans are assumed to have cross-immunity and cannot contract dengue, after which they become susceptible to a second infection (SH2) from a different dengue serotype. If a human
contracts dengue for a second time (DH2)–that is, contracts a different dengue serotype–they
may progress to severe dengue (SDH). In SDH, there is an elevated probability of mortality
(Death). If an individual recovers from DH2or SDHthey are assumed to no longer be
suscepti-ble (RH2).
The baseline model therefore allows for the effect of herd immunity (and loss thereof). As individuals move through the states, contracting dengue, the proportion of individuals that are still susceptible decreases and the population as a whole builds up herd immunity. If new indi-viduals entering the model are less likely to contract dengue for reasons other than acquired immunity (for example, the introduction of sustained vector control, as described below), herd immunity wanes over time, at the rate of population replacement, and the probability of transmission increases.
We model symptomatic or apparent cases only. The number of cases of asymptomatic or unapparent cases is potentially much larger [22]. Several studies have demonstrated high levels of asymptomatic infection in endemic countries [23][24], leading to more severe primary symptomatic infections in those individuals [25]. Recent evidence suggest that asymptomatic viraemic individuals can infectAedes aegypti[26], although there is no evidence as to whether these are then able to infect humans. We have not estimated the effect of asymptomatic infec-tion in our models due to the limited literature available.
The (biting) female vector population is assumed to be proportional to the human popula-tion. The average number of female vectors per host is 1.0–6.0, with a sine function of period length 2πand a standard deviation of 20% [27]. In addition to seasonal variation, there is also a probability in every cycle of switching to an outbreak model of the vector population. In defining dengue outbreaks, previous studies have used moving means of the number of human cases and standard deviations of those means, but these differ between countries and even at subnational level [28].
probability of outbreak is set such that frequency of outbreak is once every 3–5 years [30]. This range is consistent with the country reviews, although somewhat conservative with regard to Malaysia [31].
Urbanization is reflected in part by increases in the new-born and susceptible human popu-lations, given by the crude birth rate and the urban population growth rate minus the crude birth rate, respectively. We model the combined effect of both unplanned urbanization and cli-mate change after the burn-in period by allowing for the frequency of outbreak to drop to as low as once every 2 years (that is, frequency follows a triangular distribution with 2 and 5 as minimum and maximum, respectively, and 3 as the most likely value). Alternatively, we could have modelled climate change as an increase in the average number of female vectors per host and/or standard deviation of the sine function. However, this alternative would suggest pre-dictable rather than unprepre-dictable variation over time in the number of vectors and, by exten-sion, a different type of outbreak response than we have defined below.
A list of the baseline model parameters and distributions of the probabilities underpinning the model are listed (with sources) inTable 1. Additional parameters for the intervention mod-els are listed inTable 2, and described here. Whenever possible, we used country-specific parameter values; in practice, these were mainly available for population at risk estimates, unit cost estimates, and basic health statistics such as population, birth rates, death rates (adult and child), life expectancy, and urban growth rates. Of note, we used country-specific probabilities of death among severe dengue cases receiving care. These were based on country-reported data, and varied considerably: from a low of 0.65% in Mexico to a high of 7% in Brazil [32].
Effect of medical case management
In the presence of medical management, the fatality rate of severe dengue cases is assumed to be 0.7–7% (range of best estimates from the six countries). The fatality rate is the same regard-less of whether there is vector control or immunization. In the absence of any medical case management, however, the fatality rate for severe dengue is assumed to be 5–20% [40][41].
Effect of sustained vector control and outbreak response
Recent reviews reveal that many existing vector control technologies have not been robustly evaluated for impact on reducing human dengue cases [57,58]. By technology, we refer to any combination of strategies and intervention tools that have been costed in the economics litera-ture; these include biological (e.g. copepods), chemical (e.g. insecticides) and environmental (e.g. screens) interventions. To our knowledge, only one study has measured the epidemiologi-cal effect of such vector control technologies. A randomized controlled trial (RCT) of commu-nity mobilization for dengue prevention demonstrated a lower risk of infection with dengue virus in children (relative risk reduction 29.5%, 95% confidence interval 3.8% to 55.3%) and fewer reports of dengue illness (24.7%, 1.8% to 51.2%) [59].
Several trials have, however, evaluated entomological impact. The above-mentioned RCT found a 51.7% (36.2% to 76.1%) reduction in the number of pupae per person (pupae found/ number of residents). An earlier systematic review and meta-analysis found that the most effective method (integrated vector control) resulted in decreases of 67–88% (best estimates) in the following indices: the number of containers with larvae per 100 houses (Breteau index), the percentage of water containers positive for larvae or pupae (Container index) and the per-centage of houses with water containers containing larvae or pupae (House index) [60].
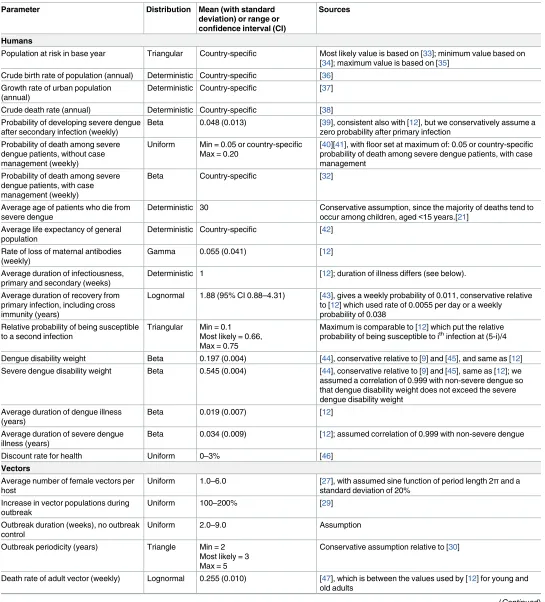
Table 1. Baseline model parameters, with distributions and sources.
Population at risk in base year Triangular Country-specific Most likely value is based on [33]; minimum value based on [34]; maximum value is based on [35]
Crude birth rate of population (annual) Deterministic Country-specific [36] Growth rate of urban population
(annual)
Deterministic Country-specific [37]
Crude death rate (annual) Deterministic Country-specific [38] Probability of developing severe dengue
after secondary infection (weekly)
Beta 0.048 (0.013) [39], consistent also with [12], but we conservatively assume a zero probability after primary infection
Probability of death among severe dengue patients, without case management (weekly)
Uniform Min = 0.05 or country-specific Max = 0.20
[40][41], with floor set at maximum of: 0.05 or country-specific probability of death among severe dengue patients, with case management
Probability of death among severe dengue patients, with case management (weekly)
Beta Country-specific [32]
Average age of patients who die from severe dengue
Deterministic 30 Conservative assumption, since the majority of deaths tend to occur among children, aged<15 years.[21]
Average life expectancy of general population
Deterministic Country-specific [42]
Rate of loss of maternal antibodies (weekly)
Gamma 0.055 (0.041) [12]
Average duration of infectiousness, primary and secondary (weeks)
Deterministic 1 [12]; duration of illness differs (see below).
Average duration of recovery from primary infection, including cross immunity (years)
Lognormal 1.88 (95% CI 0.88–4.31) [43], gives a weekly probability of 0.011, conservative relative to [12] which used rate of 0.0055 per day or a weekly
Maximum is comparable to [12] which put the relative probability of being susceptible to ithinfection at (5-i)/4
Dengue disability weight Beta 0.197 (0.004) [44], conservative relative to [9] and [45], and same as [12] Severe dengue disability weight Beta 0.545 (0.004) [44], conservative relative to [9] and [45], same as [12]; we assumed a correlation of 0.999 with non-severe dengue so that dengue disability weight does not exceed the severe dengue disability weight
Beta 0.034 (0.009) [12]; assumed correlation of 0.999 with non-severe dengue
Discount rate for health Uniform 0–3% [46]
Vectors
Average number of female vectors per host
Uniform 1.0–6.0 [27], with assumed sine function of period length 2πand a standard deviation of 20%
Outbreak periodicity (years) Triangle Min = 2 Most likely = 3 Max = 5
Conservative assumption relative to [30]
Death rate of adult vector (weekly) Lognormal 0.255 (0.010) [47], which is between the values used by [12] for young and old adults
reducing vector populations, particularly when interventions use a community-based, inte-grated approach, which is tailored to local eco-epidemiological and sociocultural settings and combined with educational programmes to increase knowledge and understanding of best practice”.
We opted to model the effect of vector control as a reduction of the vector population (or, more generally, a reduction of the vector population capable of transmitting the virus). Ento-mological effects may vary significantly between settings, not least because the choice of vector control technology is country- if not community-specific [62]. We therefore considered two broad categories of vector control technology: a medium-efficacy technology that reduces vec-tor populations by 50–70%; and a high-efficacy technology that reduces vecvec-tor populations by 70–90%. We acknowledge that such reductions in adult vectors may not have been conclu-sively demonstrated for long-term use of existing technologies.
These above reductions are applied to periods of outbreak also, such that sustained vector control limits the increase in vector populations during the initial phases of the outbreak, before the outbreak response is deployed. We define sustained vector control as vector control activities undertaken routinely throughout the year, usually monthly, regardless of changes in the number of vectors or human cases. Outbreak response activities, in comparison, are under-taken only in response to spikes in the number of vectors or human cases and only for as long as those spikes last. During outbreaks, increases in vector populations still occur in the pres-ence of vector control, but from a lower baseline level.
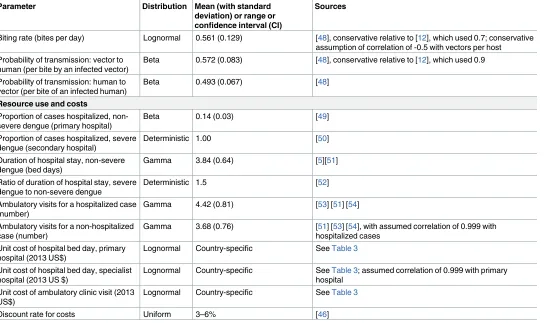
Table 1. (Continued)
Parameter Distribution Mean (with standard
deviation) or range or confidence interval (CI)
Sources
Biting rate (bites per day) Lognormal 0.561 (0.129) [48], conservative relative to [12], which used 0.7; conservative assumption of correlation of -0.5 with vectors per host Probability of transmission: vector to
human (per bite by an infected vector)
Beta 0.572 (0.083) [48], conservative relative to [12], which used 0.9
Probability of transmission: human to vector (per bite of an infected human)
Beta 0.493 (0.067) [48]
Ratio of duration of hospital stay, severe dengue to non-severe dengue
Deterministic 1.5 [52]
Ambulatory visits for a hospitalized case (number)
Unit cost of hospital bed day, primary hospital (2013 US$)
Lognormal Country-specific SeeTable 3
Unit cost of hospital bed day, specialist hospital (2013 US $)
Lognormal Country-specific SeeTable 3; assumed correlation of 0.999 with primary hospital
Unit cost of ambulatory clinic visit (2013 US$)
Lognormal Country-specific SeeTable 3
Discount rate for costs Uniform 3–6% [46]
In the baseline model of outbreak, the vector population remains high for 2–9 weeks. The effect of outbreak response is modelled by a switch of the vector population to pre-outbreak levels after a lag of 1–2 weeks–the minimum time assumed to be required to detect the increase in vector populations and deploy the outbreak response. Since we are assuming that any sus-tained vector control programme includes also an outbreak response component, this same effect is modelled for both sustained vector control and outbreak response alone. This assump-tion is optimistic with regard to outbreak response and therefore conservative with regard to demonstrating the cost-effectiveness of sustained vector control relative to outbreak response.
In the absence of sustained control, vector populations return to baseline values, whereas in the presence of sustained control, vector populations return to a level determined by the vector control technology (e.g. 70–90% below baseline values, in the case of the high efficacy technol-ogy). We assume that when sustained vector control and outbreak response are introduced, it is the susceptible (rather than infected) vector population that is immediately reduced. The number of infected vectors decreases more gradually (over their 28-day life span). This assumption is pessimistic with regard to vector control and therefore conservative with regard to demonstrating the cost-effectiveness of vector control versus immunization.
Effect of immunization
The first-ever dengue vaccine has now been licensed for use in persons aged 9–45 by countries in Asia and Latin America and is under regulatory review by others. Phase III clinical trials of CYD-TDV (Dengvaxia) have measured efficacy over 25 months from the first dose [63][64]. Pooled results (age9) suggest efficacy of 38% (3–63%) among seronegatives and 78% (65–
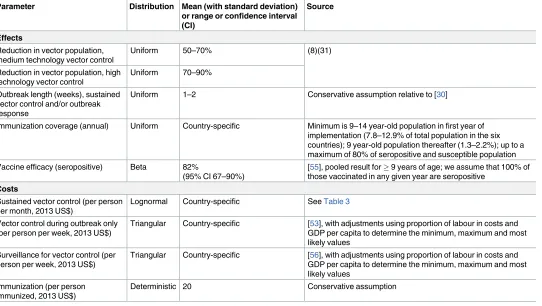
Table 2. Additional intervention model parameters, with distributions and sources.
Parameter Distribution Mean (with standard deviation)
or range or confidence interval
Uniform 1–2 Conservative assumption relative to [30]
Immunization coverage (annual) Uniform Country-specific Minimum is 9–14 year-old population in first year of implementation (7.8–12.9% of total population in the six countries); 9 year-old population thereafter (1.3–2.2%); up to a maximum of 80% of seropositive and susceptible population Vaccine efficacy (seropositive) Beta 82%
(95% CI 67–90%)
[55], pooled result for9 years of age; we assume that 100% of those vaccinated in any given year are seropositive
Costs
Sustained vector control (per person per month, 2013 US$)
Lognormal Country-specific SeeTable 3
Vector control during outbreak only (per person per week, 2013 US$)
Triangular Country-specific [53], with adjustments using proportion of labour in costs and GDP per capita to determine the minimum, maximum and most likely values
Surveillance for vector control (per person per week, 2013 US$)
Triangular Country-specific [56], with adjustments using proportion of labour in costs and GDP per capita to determine the minimum, maximum and most likely values
Immunization (per person immunized, 2013 US$)
Deterministic 20 Conservative assumption
86%) among seropositives [16]. Unfortunately, these same trials reveal high rates of hospitali-zation among those who were vaccinated when seronegative. This result suggests that the immunization strategy should target the seropositive population [55].
In our model, we consider an optimistic scenario in which the immunization strategy is perfectly effective in targeting the susceptible seropositive population (further described below). The effect of immunization is modelled as a probability among individuals susceptible to a second infection (SH2) of moving directly to the state of recovery from a second infection
(RH2). The same percentage reductions are applied to both outbreak and non-outbreak cycles
because outbreaks are modelled as changes in vector population rather than in serotype distribution.
Population targeted for vector control
The entire at risk human population is targeted for vector control. The broadest definition of the at-risk human population includes the urban population of the six countries. We also con-sidered the subset living in urban slum areas. Poor urban communities typically have environ-mental characteristics that facilitateAedes spp. breeding, including presence of refuse deposits and containers for water storage [65][66]. We also extracted from DengueMap a list of all loca-tions from which alerts of dengue cases or deaths had been issued in 2013 [67]. We obtained the latitude and longitude coordinates for these locations using the geocode program of the R packagemapproj. We then merged this dataset with the g-econ database [33].
We counted populations living within gecon-coded areas satisfying at least one of the fol-lowing two conditions: 1) population density of more than 250 per km2(non-rural settings); AND 2) average minimum temperature of no less than 5 degrees Celsius AND an average maximum temperature of no more than 36 degrees Celsius; AND 3) gross domestic product (GDP) per capita (2005 purchasing power parity) of less than US$ 10 000 (excludes areas with a level of development equivalent to a high income country); OR occurrence of a dengue alert within the 1-degree latitude by 1-degree longitude cell. These cut-offs were based on studies identified in a recent systematic review of dengue risk mapping models [68].
In PSA, the susceptible human population was represented by a triangular distribution using g-econ, urban slum and urban populations as the most likely, minimum and maximum values, respectively.
Population targeted for immunization
Mathematical models suggest that, to achieve significant reduction in the disease burden, immunization is most effective if it includes only individuals that have been already exposed to at least one dengue virus [69]. Some countries have decided to roll out immunization by tar-geting specific age groups, such as all 9–14 year olds in the first year and then all (new) 9 year olds in the second year onwards. Targeting strategies may be adapted to local settings. In the-ory, age or other individual characteristics could be selected to either minimize the number of seronegative people or maximize the number of seropositive people vaccinated.
It bears emphasizing here that the objective of this paper is to assess the cost-effectiveness of vector control in the presence of a (hypothetical) highly targeted and low-cost vaccination strategy using a (non-hypothetical) medium-efficacy vaccine; it is not to assess the cost-effec-tiveness of the medium efficacy vaccine itself.
Cost of medical case management
The cost of medical management of dengue cases is based on the utilization of general health services only, or the “hotel cost” of hospital bed days and ambulatory visits excluding any labo-ratory tests or drugs. The hospitalization rate, duration of hospitalization, and number of ambulatory visits are provided inTable 1. We assume a hospitalization rate of 14% for non-severe dengue and 100% for non-severe dengue (references are provided inTable 1). Hospitalized non-severe cases are hospitalized in primary hospitals, and severe cases are hospitalized in spe-cialist hospitals. Unit costs (best estimates and standard errors) were obtained using data and methods from WHO-CHOICE [70]. These unit cost estimates are summarized inTable 3. All symptomatic cases were assumed to receive medical management in all scenarios, regardless of whether there was sustained vector control, outbreak response and/or immunization.
Cost of sustained vector control and outbreak response
We conducted a search of the literature on the cost of sustained vector control interventions and identified eight studies with primary data, from 12 countries, considering different biolog-ical, chembiolog-ical, and environmental measures. A subsequent systematic review revealed no addi-tional studies [11]. We extracted data on costs as well as populations or households covered. Costs were converted to per capita terms and inflated to 2013 US$ using GDP deflators. These unit costs were then modelled in a multivariate log-log regression on population covered and GDP per capita. More than 50% of the variation in unit cost between the studies was explained by these two variables alone, driven by a strongly negative relationship with population. In addition to economies of scale, it is likely that higher cost biological and environmental mea-sures were only implemented at smaller scale, in targeted communities. A plot of the data and regression model results are available in Supporting InformationS2 Figand Supporting Infor-mationS1 Table.
We calculated means and standard errors for the predictions for the six countries consid-ered in this study, using their urban populations and GDP per capita. For each country, 1000 values of (log) unit cost were drawn from a normal distribution, and then exponentiated. These unit cost estimates are summarized inTable 3. The best estimates are in the range of about 2013 US$ 0.04–0.05 per person per month–similar to the cost of larviciding and/or
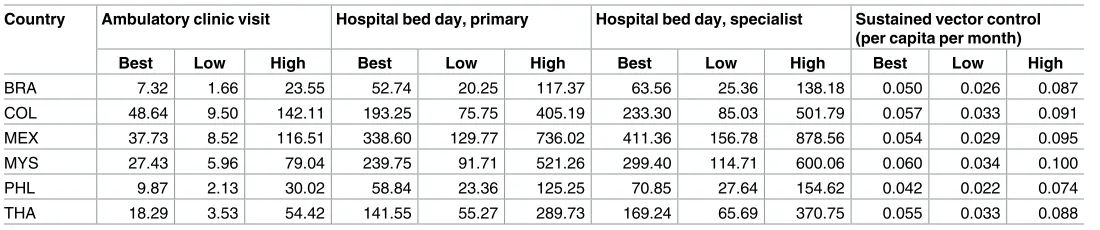
Table 3. Country-specific unit cost estimates (best and 95% uncertainty interval), 2013 US$.
Country Ambulatory clinic visit Hospital bed day, primary Hospital bed day, specialist Sustained vector control (per capita per month)
Best Low High Best Low High Best Low High Best Low High
BRA 7.32 1.66 23.55 52.74 20.25 117.37 63.56 25.36 138.18 0.050 0.026 0.087
COL 48.64 9.50 142.11 193.25 75.75 405.19 233.30 85.03 501.79 0.057 0.033 0.091
MEX 37.73 8.52 116.51 338.60 129.77 736.02 411.36 156.78 878.56 0.054 0.029 0.095
MYS 27.43 5.96 79.04 239.75 91.71 521.26 299.40 114.71 600.06 0.060 0.034 0.100
PHL 9.87 2.13 30.02 58.84 23.36 125.25 70.85 27.64 154.62 0.042 0.022 0.074
THA 18.29 3.53 54.42 141.55 55.27 289.73 169.24 65.69 370.75 0.055 0.033 0.088
Brazil (BRA), Colombia (COL), Mexico (MEX), Malaysia (MYS), Philippines (PHL) and Thailand (THA).
adulticiding programs described in studies from Brazil, Cambodia, Venezuela, and Thailand. The confidence intervals are wide, however, with highs of up to 2013 US$ 0.06–0.09 allowing for smaller scale biological and environmental measures. These unit costs are similar to those described in studies from Guatemala, Kenya, Mexico, Myanmar, and the Philippines, pub-lished prior to 2013. No costing studies have been undertaken for technologies under develop-ment using Release of Insects with Dominant Lethality (RIDL) or Wolbachia symbiont infection of vectors.
The cost of outbreak response was taken from a study from Panama [53]. That study found that the cost of vector control during an outbreak, including larviciding and adulticiding, was about 2005 US$ 0.035 per person per week. The Panama costs are conservative relative to a more comprehensive costing of outbreak response in Cuba, including health education and/or replacement of defective water tanks [71][72]. Similarly, the Panama costs are conservative rel-ative to environmental and/or chemical interventions triggered by case reports in Malaysia and Thailand [73][74]. We considered adjustments for our six countries using the proportion of labour in costs (71%) and GDP per capita relative to that of Panama in the year of the study. Minimum, most likely, and maximum values were obtained considering adjustments for GDP per capita only, or GDP per capita and the labour proportion, or no adjustment at all.
We assumed that a sustained vector control programme would implement extraordinary outbreak response interventions in the midst of an outbreak; therefore, during an outbreak, the total cost of sustained vector control includes the cost of both the sustained vector control and outbreak response interventions. To the cost of both sustained vector control and out-break response alone we also added the cost of sustained surveillance, based on a study from Brazil, at a cost of 2013 US$ 0.014 per person per week. Again we generated country-specific minimum, most likely, and maximum values using the proportion of labour in costs (39%) and relative GDP per capita [56].
Cost of immunization
Since the cost of a future vaccine is unknown, the cost per person vaccinated was assumed to be about 2013 US$ 20. This unit cost is assumed to include the cost of screening for seroposi-tivity, or whatever the cost of the perfectly effective targeting strategy, as well as administration of the vaccine itself. It is purposefully optimistic. An earlier study considered a range of US$ 10–300 per unit for the cost of vaccine production alone [12]. In most countries, US$ 20 is less than the cost of the 1–3 outpatient visits that would be required for administration alone (Table 3). It is also considerably lower than the maximum of the median willingness-to-pay results (US$ 70) from Vietnam, Thailand, and Colombia [75].
Results
Effects
variable) efforts to control dengue whereas the estimates presented inFig 1are for our baseline model (medical case management alone).
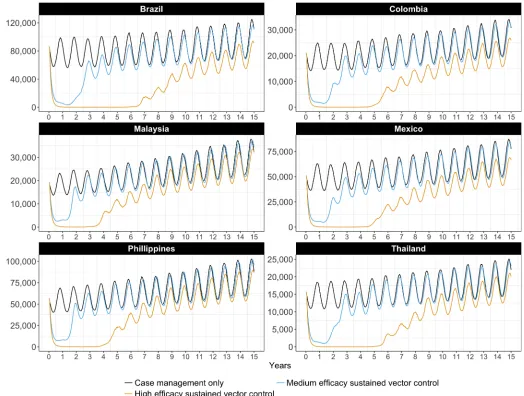
The effect of sustained vector control on the total number of dengue cases (including severe cases) is depicted over time inFig 2. Different sustained vector control technologies (medium and high efficacy) are considered, and compared to the baseline (medical case management only). Vector control technologies of low efficacy (<50% reduction in vector populations) have limited longer-term impact on transmission, and are therefore not depicted.
Initially, medium- and high-efficacy vector control technologies result in a significant decrease in the number of cases. The combination of vector control and acquired immunity push the basic reproduction number to below one. In time, the number of susceptible people waxes and herd immunity wanes. With high-efficacy vector control, the period of low trans-mission lasts from four to seven years, varying between countries. Differences between
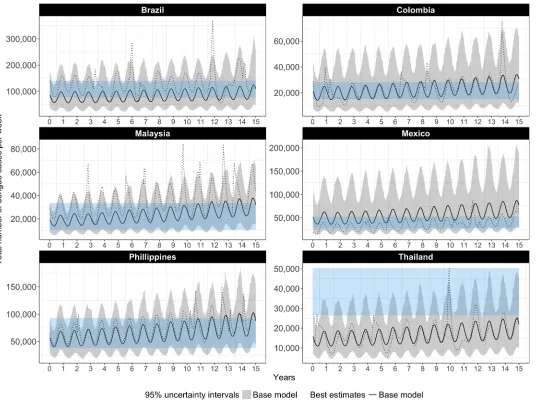
Fig 1. Weekly number of dengue cases with no vector control or immunization (case management only), our base model compared to published estimates of apparent cases, best estimates and 95% UIs. The black line and grey bands represent the best estimates and uncertainty intervals for the
number of dengue cases as projected by our base model; the dotted black line represents the number of dengue cases in a single, randomly selected iteration of the model; the blue bands represent uncertainty intervals for apparent cases, as published by Bhatt et al. (2013)
countries are explained by differences in the country-specific parameters, namely birth rates, death rates, and urban growth rates, which together determine the rate at which susceptible people are introduced into the model.
The number of cases of severe dengue follows a similar pattern, but with a somewhat lon-ger-term effect of high efficacy vector control, as can be verified in Supporting InformationS3 Fig.
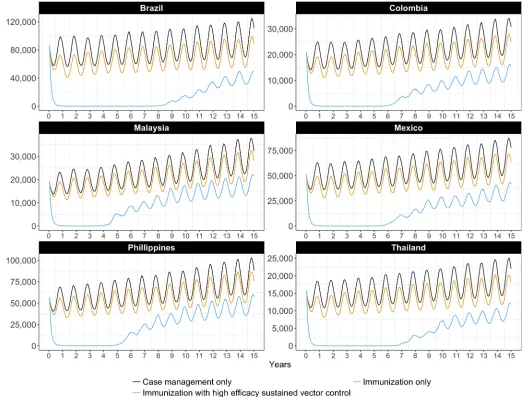
The effect of highly targeted immunization using a medium-efficacy vaccine on the number of dengue cases is depicted over time inFig 3, alone and in combination with sustained vector control (high efficacy). The total number of dengue cases is largely unaffected by immuniza-tion alone, because it is targeted at seropositives only and the number of severe dengue cases is small relative to the total. Only the combination of sustained vector control and immunization maintains the number of cases at very low levels, for between four and nine years depending on the country. Again, differences between countries can be explained by differences in the country-specific epidemiological parameters.
Fig 2. Weekly number of dengue cases with medium or high efficacy sustained vector control technologies but no immunization, best estimates.
The number of cases of severe dengue, however, exhibits a different trend, as can be seen in Supporting InformationS4 Fig. Here, because of our optimistic assumptions about how effec-tively an immunization strategy could target the seropositive population, we have a large and sustained effect of immunization, alone and in combination with sustained vector control (high efficacy). This figure should be interpreted as confirmation that our assumptions about the immunization strategy have been optimistic.
Table 4summarizes the average annual number of DALYs in the period 2015–2030 under
different intervention scenarios, compared to WHO Global Health Estimates for the year 2012. Our model suggests that medical case management alone would result in an average of 22.3–232.3 thousand DALYs per year (range of best estimates across the six countries). The uncertainty intervals on these estimates lie just above WHO estimates for the year 2012, with the exception of the Philippines (for which our uncertainty interval overlaps with the WHO estimate). Life expectancy is lower in the Philippines (69 years), than for any of the other
Fig 3. Weekly number of dengue cases with high efficacy sustained vector control and/or a highly targeted immunization strategy, best estimates.
countries (74–78 years). Note that WHO Global Health Estimates reflect variable levels of intervention across countries; they are also based on highest observed life expectancy globally.
Outbreak response has a negligible impact on the average burden, given that outbreaks occur relatively infrequently on average and that the response is triggered only with a lag after the increase in the vector population. The introduction of sustained vector control (medium efficacy) reduces the burden to an average of 18.5–167.0 thousand DALYs per year. Sustained vector con-trol (high efficacy) reduces the burden to an average of 12.0–89.6 thousand DALYs per year.
Costs and affordability
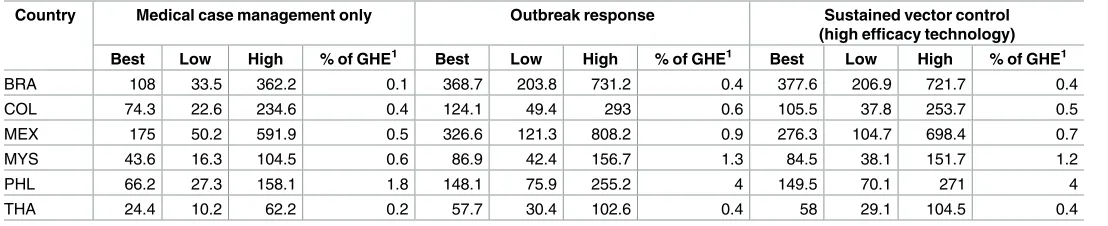
Average annual costs over the 15-year period are reported inTable 5. At current prices of exist-ing technologies, the total cost of sustained vector control (usexist-ing a high efficacy technology) including outbreak response and medical case management (2013 $US 58.0–377.6 million, range of best estimates across the six countries) is comparable to what would have to be spent on outbreak response and medical case management (2013 $US 57.7–368.7 million). This result is driven by differences in the cost of treating the cases that would not be averted by out-break response, given a minimum one week lag between the increase in vector populations and deployment of the outbreak response.
InTable 5, the best estimates of cost are expressed also as a percentage of government
health expenditure (GHE) in 2013. Sustained vector control (high efficacy) including medical
Table 4. Average annual DALYs (in thousands) implied by the model (best and 95% uncertainty interval).
Country Burden of disease1 Medical case management only
Outbreak response Sustained vector control (medium efficacy technology)
Sustained vector control (high efficacy
technology)
Best Best Low High Best Low High Best Low High Best Low High
BRA 103.0 232.3 99.4 539.7 232.2 98.9 537.2 167 18.6 427.5 89.6 1.4 341
COL 9.9 35.6 12.6 93 35.3 12.5 92.3 27.5 5.3 76.4 16.6 0.2 62.3
MEX 5.4 23.9 7.9 62.2 23.7 7.9 61 19.2 4.9 51.3 12 0.1 40.9
MYS 8.4 22.3 9.5 50.4 22.1 9.5 50.4 18.5 5 43.1 12.7 0.2 35
PHL 94.6 58.5 28.2 116.3 58.4 28.1 116.3 48.1 15.5 100 32.9 0.6 86.7
THA 9.5 26.6 9.5 67 26.4 9.4 66.9 20.2 4.2 52.7 11.9 0.2 41
1WHO’s Global Health Estimates (2014) for the year 2012 [76].
Brazil (BRA), Colombia (COL), Mexico (MEX), Malaysia (MYS), Philippines (PHL) and Thailand (THA).
https://doi.org/10.1371/journal.pntd.0005785.t004
Table 5. Average annual cost and affordability, 2013 US$ millions.
Country Medical case management only Outbreak response Sustained vector control
(high efficacy technology)
Best Low High % of GHE1 Best Low High % of GHE1 Best Low High % of GHE1
BRA 108 33.5 362.2 0.1 368.7 203.8 731.2 0.4 377.6 206.9 721.7 0.4
COL 74.3 22.6 234.6 0.4 124.1 49.4 293 0.6 105.5 37.8 253.7 0.5
MEX 175 50.2 591.9 0.5 326.6 121.3 808.2 0.9 276.3 104.7 698.4 0.7
MYS 43.6 16.3 104.5 0.6 86.9 42.4 156.7 1.3 84.5 38.1 151.7 1.2
PHL 66.2 27.3 158.1 1.8 148.1 75.9 255.2 4 149.5 70.1 271 4
THA 24.4 10.2 62.2 0.2 57.7 30.4 102.6 0.4 58 29.1 104.5 0.4
1
Best estimate divided by Government Health Expenditure (GHE).
Brazil (BRA), Colombia (COL), Mexico (MEX), Malaysia (MYS), Philippines (PHL) and Thailand (THA).
case management would cost 0.4–1.2% of GHE in five of the six countries. In the Philippines, where GHE in 2013 was much lower in per capita terms than for the other five countries, it would cost 4.0% of GHE.
Cost-effectiveness
Average cost-effective ratios (ACERs) and incremental cost-effectiveness ratios (ICERs) are presented for each country in Tables6and7, considering high- and medium-efficacy vector control technologies, respectively.
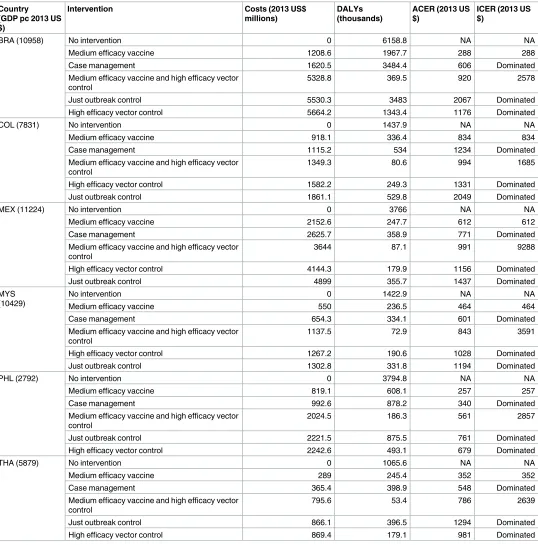
If sustained vector control is effective in reducing mosquito populations by 70–90% (high-efficacy,Table 6), the average cost per DALY averted would be US$ 679–1331 (range of best estimates across the six countries) relative to the null scenario. The combination of high-effi-cacy sustained vector control and a highly targeted and low-cost immunization strategy using a medium-efficacy vaccine dominates all other interventions except immunization alone. However, immunization alone averts far fewer DALYs. In five of the six countries, the combi-nation of vector control and immunization is very cost-effective, with an ICER well below one times GDP per capita. In the Philippines, it is cost-effective at a threshold just above one times GDP per capita. Recall that the Philippines is the country with the lowest life expectancy among the six; it is also the country with lowest GDP per capita, and therefore the country with the (presumed) lowest willingness-to-pay (WTP).
If vector control is effective in reducing mosquito populations by only 50–70% (medium-efficacy,Table 7), the average cost per DALY averted would be US$ 808–1907 (range of best estimates across the six countries) relative to the null scenario. Again, the combination of medium-efficacy sustained vector control and a highly targeted and low-cost immunization strategy using a medium-efficacy vaccine dominates all other interven-tions except immunization alone. However, again, immunization alone averts far fewer DALYs. In four of the six countries, the combination of medium-efficacy vector control and immunization is very cost-effective (the ICER is below one times GDP per capita). In Mexico and the Philippines it is cost-effective at thresholds between two and three times GDP per capita. Mexico is the country with the lowest reported death rate among severe dengue cases receiving medical management.
Uncertainty around cost-effectiveness is reflected in the cost-effectiveness acceptability curves of Figs4and5. The combination of high-efficacy sustained vector control and a highly targeted and low-cost immunization strategy using a medium efficacy vaccine (Fig 4) has the highest probability of being most cost-effective at WTP thresholds as low as one quarter of GDP per capita (per DALY averted). At a WTP threshold of one times GDP per capita, the probability that this is the most cost-effective strategy exceeds 85% in four of the six countries.
Discussion
We estimated the cost and cost-effectiveness of sustained vector control in six high-burden countries. Our model suggests that, at current prices, the cost of sustained vector control and medical case management is comparable to what would otherwise have to be spent on out-break response and medical case management. In December 2015, in its decision to approve Dengvaxia, Mexico reported that it was spending about 2.5% of its health budget on medical treatment alone [77]. Many countries have abandoned or lack effective surveillance systems to respond rapidly enough to outbreaks to make much of a dent in the number of cases requiring medical management [78].
exceeds that of sustained vector control [79]. We considered only direct medical costs and con-trol programme costs–we did not consider direct non-medical costs faced by patients during
Table 6. Best estimates of costs, DALYs, Average Cost-Effectiveness Ratio (ACER) and Incremental Cost-Effectiveness Ratio (ICER), high efficacy vector control over 15 years.
BRA (10958) No intervention 0 6158.8 NA NA
Medium efficacy vaccine 1208.6 1967.7 288 288
Case management 1620.5 3484.4 606 Dominated
Medium efficacy vaccine and high efficacy vector control
5328.8 369.5 920 2578
Just outbreak control 5530.3 3483 2067 Dominated
High efficacy vector control 5664.2 1343.4 1176 Dominated
COL (7831) No intervention 0 1437.9 NA NA
Medium efficacy vaccine 918.1 336.4 834 834
Case management 1115.2 534 1234 Dominated
Medium efficacy vaccine and high efficacy vector control
1349.3 80.6 994 1685
High efficacy vector control 1582.2 249.3 1331 Dominated
Just outbreak control 1861.1 529.8 2049 Dominated
MEX (11224) No intervention 0 3766 NA NA
Medium efficacy vaccine 2152.6 247.7 612 612
Case management 2625.7 358.9 771 Dominated
Medium efficacy vaccine and high efficacy vector control
3644 87.1 991 9288
High efficacy vector control 4144.3 179.9 1156 Dominated
Just outbreak control 4899 355.7 1437 Dominated
MYS (10429)
No intervention 0 1422.9 NA NA
Medium efficacy vaccine 550 236.5 464 464
Case management 654.3 334.1 601 Dominated
Medium efficacy vaccine and high efficacy vector control
1137.5 72.9 843 3591
High efficacy vector control 1267.2 190.6 1028 Dominated
Just outbreak control 1302.8 331.8 1194 Dominated
PHL (2792) No intervention 0 3794.8 NA NA
Medium efficacy vaccine 819.1 608.1 257 257
Case management 992.6 878.2 340 Dominated
Medium efficacy vaccine and high efficacy vector control
2024.5 186.3 561 2857
Just outbreak control 2221.5 875.5 761 Dominated
High efficacy vector control 2242.6 493.1 679 Dominated
THA (5879) No intervention 0 1065.6 NA NA
Medium efficacy vaccine 289 245.4 352 352
Case management 365.4 398.9 548 Dominated
Medium efficacy vaccine and high efficacy vector control
795.6 53.4 786 2639
Just outbreak control 866.1 396.5 1294 Dominated
High efficacy vector control 869.4 179.1 981 Dominated
Brazil (BRA), Colombia (COL), Mexico (MEX), Malaysia (MYS), Philippines (PHL) and Thailand (THA).
their care (e.g. food, transportation) nor any productivity losses (time spent away from work) of the patients or their caretakers.
Table 7. Best estimates of costs, DALYs, Average Cost-Effectiveness Ratio (ACER) and Incremental Cost-Effectiveness Ratio (ICER), medium effi-cacy vector control over 15 years.
Country
BRA (10958) No intervention 0 6158.8 NA NA
Medium efficacy vaccine 1208.6 1967.7 288 288
Case management 1620.5 3484.4 606 Dominated
Just outbreak control 5530.3 3483 2067 Dominated
Medium efficacy vaccine and medium efficacy vector control
5731.7 917.9 1094 4309
Medium efficacy vector control 6189.6 2504.8 1694 Dominated
COL (7831) No intervention 0 1437.9 NA NA
Medium efficacy vaccine 918.1 336.4 834 834
Case management 1115.2 534 1234 Dominated
Medium efficacy vaccine and medium efficacy vector control
1667.7 175.7 1321 4664
Just outbreak control 1861.1 529.8 2049 Dominated
Medium efficacy vector control 1954.4 412.9 1907 Dominated
MEX (11224) No intervention 0 3766 NA NA
Medium efficacy vaccine 2152.6 247.7 612 612
Case management 2625.7 358.9 771 Dominated
Medium efficacy vaccine and medium efficacy vector control
4308.9 151 1192 22309
Just outbreak control 4899 355.7 1437 Dominated
Medium efficacy vector control 4995.2 287.4 1436 Dominated
MYS (10429)
No intervention 0 1422.9 NA NA
Medium efficacy vaccine 550 236.5 464 464
Case management 654.3 334.1 601 Dominated
Medium efficacy vaccine and medium efficacy vector control
1274.7 139.8 994 7499
Just outbreak control 1302.8 331.8 1194 Dominated
Medium efficacy vector control 1426.1 277.7 1245 Dominated
PHL (2792) No intervention 0 3794.8 NA NA
Medium efficacy vaccine 819.1 608.1 257 257
Case management 992.6 878.2 340 Dominated
Just outbreak control 2221.5 875.5 761 Dominated
Medium efficacy vaccine and medium efficacy vector control
2241 357.5 652 5673
Medium efficacy vector control 2484.1 721.7 808 Dominated
THA (5879) No intervention 0 1065.6 NA NA
Medium efficacy vaccine 289 245.4 352 352
Case management 365.4 398.9 548 Dominated
Just outbreak control 866.1 396.5 1294 Dominated
Medium efficacy vaccine and medium efficacy vector control
886.5 124.6 942 4946
Medium efficacy vector control 982.9 303.6 1290 Dominated
Brazil (BRA), Colombia (COL), Mexico (MEX), Malaysia (MYS), Philippines (PHL) and Thailand (THA).
Our estimates of the cost per DALY averted by sustained vector control (related to doing nothing) are lower than that of the DCP2, but higher than those from studies of single settings. In those studies, cost-effectiveness ratios ranged from 2005 US$ 227 (2013 US$ 344) per DALY averted by larval control in Cambodia to 2009 US$ 615–1267 (2013 US$ 802–1652) per DALY averted by adult mosquito control in Brazil [9][10]. Taking a broader societal perspec-tive including productivity losses, the Cambodia programme cost only 2005 US$ 37 (2013 US$ 56) per DALY averted. Again, we did not consider these productivity losses–their measure-ment remains controversial, although few would argue that they are zero.
We have not (nor to our knowledge has any earlier study) considered the additional bene-fits of vector control targeted at dengue for the prevention of other diseases, such as Chikungu-nya, yellow fever and Zika fever, transmitted by the same vectors and (for all but yellow fever) lacking effective vaccines and specific treatment. These additional benefits of sustained vector
Fig 4. Probability of being most cost-effective at any given threshold, considering high-efficacy sustained vector control and a highly targeted, low-cost immunization strategy. The solid lines are cost-effectiveness acceptability curves (CEACs) representing the probability that an intervention is
cost-effective at a given threshold; the (vertical) dashed line indicates the probability that an intervention is cost-effective at a threshold equal to GDP per capita; the dotted line represents the cost-effectiveness acceptability frontier (CEAF) which represents the probability that the most cost-effective option is cost-effective at a given threshold.
control would increase its cost-effectiveness. Even with conservative assumptions, our results suggest that sustained vector control can be highly cost-effective.
Our model suggests that the introduction of highly targeted and low-cost immunization strategy using a medium-efficacy vaccine does not alter the conclusion that sustained vector control can be highly cost-effective. On the contrary, vector control may complement a medium-efficacy vaccine, or a vaccine that is highly effective but against only secondary infec-tions or only one of the four dengue serotype, or whose production is highly constrained. In these instances, sustained vector control may compensate to some extent for lower levels of coverage by immunization.
There are as yet no costing studies for dengue vaccine delivery, nor even a known price for the vaccine itself [77][80][81]. Indeed, there are still many unknowns about immunization for dengue. Overall, our assumptions for immunization can be considered conservative from the
Fig 5. Probability of being most cost-effective at any given threshold, considering medium-efficacy sustained vector control and a highly targeted, low-cost immunization strategy. The solid lines are cost-effectiveness acceptability curves (CEACs) representing the probability that an
intervention is cost-effective at a given threshold; the (vertical) dashed line indicates the probability that an intervention is cost-effective at a threshold equal to GDP per capita; the dotted line represents the cost-effectiveness acceptability frontier (CEAF) which represents the probability that the most cost-effective option is cost-effective at a given threshold.
perspective of the cost-effectiveness of sustained vector control. That is, we have been optimis-tic in our assumptions about immunization with regard to both effects and costs, in order to have the most conservative estimate of the cost-effectiveness of vector control in the presence of immunization. We have been particularly optimistic in assuming that the targeting strate-gies for immunization are perfectly effective in avoiding seronegative people. This analysis should not, therefore, be used to draw conclusions about the cost-effectiveness of the current vaccine. When new information or new vaccines become available, these model parameters should be adapted.
We accounted for many of the known sources of uncertainty within a probabilistic frame-work. In spite of considerable uncertainty, sustained vector control emerged with a high prob-ability of cost-effectiveness. Some sources of uncertainty, however, could not be accounted for and remain as more serious limitations to our study.
First, there is remaining uncertainty around particular parameter values. The serotype immunity variable (serotype composition) is assumed to be constant over time. The probabil-ity that dengue fever following a second infection develops into severe dengue is based on clin-ical paediatric data from four hospitals [39]. While the probability of death among severe dengue cases receiving medical management was based on country-reported data, the consid-erable disparity across countries raises questions. The availability of better data for these parameters would improve the precision of our model.
Second, there is remaining uncertainty about the structure of the model itself, namely with respect to outbreaks, which are modelled as increases in the vector population. Vector indices have been correlated to increases in dengue cases during outbreaks, but the strength of evi-dence is limited by a lack of well-controlled studies [82][83]. Other studies have considered spatial, meteorological, epidemiological, and entomological factors, and dengue serotype [84]. Although this study could benefit from a more sophisticated outbreak model, uncertainty remains in the choice of variables and availability of data.
Another limitation of the model structure is that we have not modelled heterogeneity in transmission. The probability of contracting dengue assumes an even distribution of vectors to humans throughout the susceptible population. However, a study from Armenia and Colom-bia found that 95% ofAe aegytpipupae were concentrated in only 5% of houses [85]. More detailed risk mapping could improve our analysis and lead to better targeting and enhanced cost-effectiveness of vector control.
Third, we have made no assumptions about the relative costs of the different vector control technologies–in fact, we have assumed the same unit cost for both medium- and high-efficacy technologies. Obviously, this analysis does not help us to choose amongst available vector con-trol technologies. Further research is needed to understand the drivers of cost and effect across current and future vector control technologies. Indeed, it is unclear whether reductions in excess of 70–90% can be sustained using existing technologies; more research on the long-term impact of both existing and upcoming technologies is needed.
Fourth, our model does not reflect uncertainty around the impact of resistance to insecti-cides in a scenario of sustained vector control. The data on this are limited, as a result of poor routine resistance monitoring [86]. New vector control technologies, such as genetic modifica-tion or symbiont infecmodifica-tion of vectors, once developed, may help in mitigating the risk of resis-tance [87]. Our results are favourable to sustained vector control in general (not to any one technology in particular) and should not discourage the development of new technologies with demonstrated efficacy and safety. Indeed, our results apply to any technology that reduces the number of vectors able to transmit disease, rather than the number of vectors per se.
Finally, our results may not be generalizable to other settings, for which we do not have good epidemiological or cost data. Low-income countries, especially those in Africa, are argu-ably more vulnerable and less prepared for the effects of unplanned urbanization and climate change, including the spread of vector-borne diseases [88]. These same countries have the poorest quality data on dengue, starting with the frequent misclassification of dengue as malaria. A regional study of the cost and cost-effectiveness of sustained vector control in low-income countries of Africa is needed.
This paper focussed on the cost-effectiveness of sustained vector control in six middle-income endemic countries representing 15% of the estimated global burden of dengue. We have shown that sustained vector control will be cost-effective in most of these countries if it succeeds in reducing mosquito populations by more than 50%. Importantly, we show that the introduction of a highly targeted and low-cost immunization strategy using a medium-efficacy vaccine does not weaken the investment case for sustained vector control. Middle-income endemic countries should proceed with mapping the populations to be covered by sustained vector control.
Supporting information
S1 Fig. Markov model of dengue infection in human and vector populations.
(PNG)
S2 Fig. Relationship between cost per capita per month (2013 US$) and population covered by sustained vector control.
(TIFF)
S3 Fig. Weekly number of severe dengue cases with medium or high efficacy sustained vec-tor control technologies but no immunization, best estimates.
(TIF)
S4 Fig. Weekly number of severe dengue cases with medium or high efficacy sustained vec-tor control and/or immunization, best estimates.
(TIF)
S1 Table. Result from meta-regression of the cost per capita per month (2013 US$) of sus-tained vector control.
(DOCX)
Author Contributions
Conceptualization: Christopher Fitzpatrick, Raman Velayudhan.
Data curation: Christopher Fitzpatrick, Alexander Haines, Mathieu Bangert.
Investigation: Christopher Fitzpatrick, Alexander Haines, Mathieu Bangert.
Methodology: Christopher Fitzpatrick, Alexander Haines.
Software: Christopher Fitzpatrick, Alexander Haines, Mathieu Bangert.
Visualization: Mathieu Bangert.
Writing – original draft: Christopher Fitzpatrick, Alexander Haines.
Writing – review & editing: Mathieu Bangert, Andrew Farlow, Janet Hemingway, Raman
Velayudhan.
References
1. Brady OJ, Gething PW, Bhatt S, Messina JP, Brownstein JS, Hoen AG, et al. Refining the global spatial limits of dengue virus transmission by evidence-based consensus. PLoS Negl Trop Dis. 2012; 6: e1760.https://doi.org/10.1371/journal.pntd.0001760PMID:22880140
2. Shepard DS, Coudeville L, Halasa YA, Zambrano B, Dayan GH. Economic impact of dengue illness in the Americas. Am J Trop Med Hyg. 2011; 84: 200–207.https://doi.org/10.4269/ajtmh.2011.10-0503
PMID:21292885
3. Shepard DS, Undurraga EA, Halasa YA. Economic and disease burden of dengue in Southeast Asia. PLoS Negl Trop Dis. 2013; 7: e2055.https://doi.org/10.1371/journal.pntd.0002055PMID:23437406 4. Shepard DS, Halasa YA, Tyagi BK, Adhish SV, Nandan D, Karthiga KS, et al. Economic and Disease
Burden of Dengue Illness in India. Am J Trop Med Hyg. 2014;https://doi.org/10.4269/ajtmh.14-0002
PMID:25294616
5. Huy R, Wichmann O, Beatty M, Ngan C, Duong S, Margolis HS, et al. Cost of dengue and other febrile illnesses to households in rural Cambodia: a prospective community-based case-control study. BMC Public Health. 2009; 9: 155.https://doi.org/10.1186/1471-2458-9-155PMID:19473500
6. Tam PT, Dat NT, Huu LM, Thi XCP, Duc HM, Tu TC, et al. High household economic burden caused by hospitalization of patients with severe dengue fever cases in Can Tho province, Vietnam. Am J Trop Med Hyg. 2012; 87: 554–558.https://doi.org/10.4269/ajtmh.2012.12-0101PMID:22826478
7. Seki N, Iwashita Y, Moto R, Kamiya N, Kurita M, Tahara N, et al. [An autochthonous outbreak of dengue type 1 in Tokyo, Japan 2014]. Nihon Koshu Eisei Zasshi Jpn J Public Health. 2015; 62: 238–250.
https://doi.org/10.11236/jph.62.5_238PMID:26118707
8. Xiao J-P, He J-F, Deng A-P, Lin H-L, Song T, Peng Z-Q, et al. Characterizing a large outbreak of den-gue fever in Guangdong Province, China. Infect Dis Poverty. 2016; 5. https://doi.org/10.1186/s40249-016-0131-zPMID:27142081
9. Luz PM, Vanni T, Medlock J, Paltiel AD, Galvani AP. Dengue vector control strategies in an urban set-ting: an economic modelling assessment. Lancet. 2011; 377: 1673–1680.https://doi.org/10.1016/ S0140-6736(11)60246-8PMID:21546076
10. Suaya JA, Shepard DS, Chang M-S, Caram M, Hoyer S, Socheat D, et al. Cost-effectiveness of annual targeted larviciding campaigns in Cambodia against the dengue vector Aedes aegypti. Trop Med Int Health TM IH. 2007; 12: 1026–1036.https://doi.org/10.1111/j.1365-3156.2007.01889.xPMID:
17875014
11. Constenla D, Garcia C, Lefcourt N. Assessing the Economics of Dengue: Results from a Systematic Review of the Literature and Expert Survey. PharmacoEconomics. 2015; 33: 1107–1135.https://doi. org/10.1007/s40273-015-0294-7PMID:26048354
12. Durham DP, Ndeffo Mbah ML, Medlock J, Luz PM, Meyers LA, Paltiel AD, et al. Dengue dynamics and vaccine cost-effectiveness in Brazil. Vaccine. 2013; 31: 3957–3961.https://doi.org/10.1016/j.vaccine. 2013.06.036PMID:23791696
13. Carrasco LR, Lee LK, Lee VJ, Ooi EE, Shepard DS, Thein TL, et al. Economic impact of dengue illness and the cost-effectiveness of future vaccination programs in Singapore. PLoS Negl Trop Dis. 2011; 5: e1426.https://doi.org/10.1371/journal.pntd.0001426PMID:22206028
14. Lee BY, Connor DL, Kitchen SB, Bacon KM, Shah M, Brown ST, et al. Economic Value of Dengue Vac-cine in Thailand. Am J Trop Med Hyg. 2011; 84: 764–772.https://doi.org/10.4269/ajtmh.2011.10-0624
PMID:21540387
16. Hadinegoro SR, Arredondo-Garcı´a JL, Capeding MR, Deseda C, Chotpitayasunondh T, Dietze R, et al. Efficacy and Long-Term Safety of a Dengue Vaccine in Regions of Endemic Disease. N Engl J Med. 2015; 373: 1195–1206.https://doi.org/10.1056/NEJMoa1506223PMID:26214039
17. Shim E. Dengue Dynamics and Vaccine Cost-Effectiveness Analysis in the Philippines. Am J Trop Med Hyg. 2016; 95: 1137–1147.https://doi.org/10.4269/ajtmh.16-0194PMID:27601519
18. Flasche S, Jit M, Rodrı´guez-Barraquer I, Coudeville L, Recker M, Koelle K, et al. The Long-Term Safety, Public Health Impact, and Cost-Effectiveness of Routine Vaccination with a Recombinant, Live-Attenu-ated Dengue Vaccine (Dengvaxia): A Model Comparison Study. PLoS Med. 2016; 13: e1002181.
https://doi.org/10.1371/journal.pmed.1002181PMID:27898668
19. Achee NL, Gould F, Perkins TA, Reiner RC, Morrison AC, Ritchie SA, et al. A critical assessment of vec-tor control for dengue prevention. PLoS Negl Trop Dis. 2015; 9: e0003655.https://doi.org/10.1371/ journal.pntd.0003655PMID:25951103
20. Webb JLA. Aedes aegypti suppression in the Americas: historical perspectives. The Lancet. 2016; 388: 556–557.https://doi.org/10.1016/S0140-6736(16)31225-9
21. L’Azou M, Brett J, Marsh G, Sarti E. Reviewing the Literature for Epidemiological Trends of Dengue Dis-ease: Introduction to a Series of Seven National Systematic Literature Reviews. Horstick O, editor. PLoS Negl Trop Dis. 2014; 8: e3260.https://doi.org/10.1371/journal.pntd.0003260PMID:25375830 22. Bhatt S, Gething PW, Brady OJ, Messina JP, Farlow AW, Moyes CL, et al. The global distribution and
burden of dengue. Nature. 2013; 496: 504–507.https://doi.org/10.1038/nature12060PMID:23563266 23. Burke DS, Nisalak A, Johnson DE, Scott RM. A prospective study of dengue infections in Bangkok. Am
J Trop Med Hyg. 1988; 38: 172–180. PMID:3341519
24. Endy TP, Anderson KB, Nisalak A, Yoon I- K, Green S, Rothman AL, et al. Determinants of inapparent and symptomatic dengue infection in a prospective study of primary school children in Kamphaeng Phet, Thailand. PLoS Negl Trop Dis. 2011; 5: e975.https://doi.org/10.1371/journal.pntd.0000975
PMID:21390158
25. Iturrino-Monge R, Avila-Agu¨ero ML, Avila-Agu¨ero CR, Moya-Moya T, Cañas-Coto A, Camacho-Badilla K, et al. Seroprevalence of dengue virus antibodies in asymptomatic Costa Rican children, 2002–2003: a pilot study. Rev Panam Salud Pu´blica Pan Am J Public Health. 2006; 20: 39–43.
26. Duong V, Lambrechts L, Paul RE, Ly S, Lay RS, Long KC, et al. Asymptomatic humans transmit den-gue virus to mosquitoes. Proc Natl Acad Sci U S A. 2015; 112: 14688–14693.https://doi.org/10.1073/ pnas.1508114112PMID:26553981
27. Chowell G, Diaz-Dueñas P, Miller JC, Alcazar-Velazco A, Hyman JM, Fenimore PW, et al. Estimation of the reproduction number of dengue fever from spatial epidemic data. Math Biosci. 2007; 208: 571– 589.https://doi.org/10.1016/j.mbs.2006.11.011PMID:17303188
28. Brady OJ, Smith DL, Scott TW, Hay SI. Dengue disease outbreak definitions are implicitly variable. Epi-demics. 2015; 11: 92–102.https://doi.org/10.1016/j.epidem.2015.03.002PMID:25979287
29. Pontes RJ, Freeman J, Oliveira-Lima JW, Hodgson JC, Spielman A. Vector densities that potentiate dengue outbreaks in a Brazilian city. Am J Trop Med Hyg. 2000; 62: 378–383. PMID:11037781 30. Ooi E-E, Gubler DJ. Dengue in Southeast Asia: epidemiological characteristics and strategic challenges
in disease prevention. Cad Sau´de Pu´blica. 2009; 25 Suppl 1: S115–124. PMID:19287856
31. Abubakar S, Shafee N. Outlook of dengue in Malaysia: a century later. Malays J Pathol. 2002; 24: 23– 27. PMID:16329552
32. PAHO WHO | Dengue | Annual Cases Reported of Dengue | PAHO/WHO Data, Maps and Statistics [Internet]. [cited 26 Dec 2016]. Available:http://www.paho.org/hq/index.php?option=com_topics&view= rdmore&cid=6290&Itemid=40734
33. Geographically based Economic data (G-Econ) | Geographically based Economic data (G-Econ) [Inter-net]. [cited 25 Mar 2014]. Available:http://gecon.yale.edu/
34. State of the World’s Cities 2012/2013.:. Sustainable Development Knowledge Platform [Internet]. [cited 28 Oct 2015]. Available:https://sustainabledevelopment.un.org/index.php?page=view&type=400&nr= 745&menu=1515
35. Urban population | Data | Table [Internet]. [cited 28 Oct 2015]. Available:http://data.worldbank.org/ indicator/SP.URB.TOTL
36. Birth rate, crude (per 1,000 people) | Data | Table [Internet]. [cited 28 Oct 2015]. Available:http://data. worldbank.org/indicator/SP.DYN.CBRT.IN
37. Urban population growth (annual %) | Data | Table [Internet]. [cited 28 Oct 2015]. Available:http://data. worldbank.org/indicator/SP.URB.GROW