PHARMACOECONOMIC ANALYSIS OF STATIN TABLETS - IN VITRO PERFORMANCE
PERSPECTIVE
VIDYAVATHI M*, KOTESWARAMMA L, KRISHNAVENI A, MADHURI T, SARADA B
Institute of Pharmaceutical Technology, Sri Padmavati Mahila Visvavidyalayam, Tirupati – 517 502, Andhra Pradesh, India. Email: [email protected]
Received: 07 February 2017, Revised and Accepted: 07 April 2018
ABSTRACT
Objective: Pharmacoeconomics refers to the scientific discipline that compares the value of pharmaceutical drugs or drug therapies. The pharmacoeconomic analysis includes the research methods related to cost minimization, cost-effectiveness, and cost-benefit analysis. The present study concerned with the pharmacoeconomic analysis of statin tablets (simvastatin [S1-S5], atorvastatin [A1-A5], and rosuvastatin [R1-R5]) of different brands which are varying in their prices using in vitro evaluation methods of tablets.
Methods: Weight variation, friability, hardness, disintegration, and dissolution tests of all selected statin tablets were performed as per official procedure for the pharmacoeconomic comparative analysis.
Results: It was found the least T90% with S5 and high T90% with S1 tablets among simvastatin tablets, the least T90% was observed with A1 and A5
and high T90% with A2 tablets among atorvastatin tablets, and least T 90% was observed with R5 and high T90% with R2 was found among rosuvastatin
tablets without any relation with their order of prices. Hence, the study concluded that there is no significant correlation between cost and in vitro
performance as there is no excellent in vitro performance found from the costliest tablets and vice versa.
Conclusion: The range of the cost of different marketed statin tablets is from Rs.17.5 to Rs.127.0 per a strip of 10 tablets. All brands of three drugs have equal strength which are assumed to produce the same outcomes. As there is no significant correlation between cost and results of some of
in vitro parameters of the tablets, the cost minimization analysis can be ruled out for these brands of S1 to S5, A1 to A5, and R1 to R5.
Keywords: Pharmacoeconomic analysis, Statin tablets, Simvastatin, Atorvastatin, Rosuvastatin, Cost-effectiveness, Cost minimization.
INTRODUCTION
Pharmacoeconomics is defined as the description and analysis of the costs of drug therapy to health-care systems and society [1]. Pharmacoeconomic research identifies, measures, and compares the costs (i.e., resources consumed) and consequences (i.e., clinical, economic, and humanistic) of pharmaceutical products and services [2,3]. The research methods such as cost-minimization analysis(CMA), cost-effectiveness analysis(CEA), cost-benefit analysis(CBA), cost-of-illness, cost-utility, cost-consequences are included in pharmacoeconomics analysis to improve the quality of human life [4,5]. In essence, pharmacoeconomic analysis uses tools for examining the impact (desirable and undesirable) of alternative drug therapies and other medical interventions.
In developing countries like India, where the medical insurance is only in emerging stage, affordability to cardiac drugs, antihypertensives, and anticancer drugs becomes a major concern [6]. The compliance of the patient is significantly dependent on the cost of the prescribed medicines, and higher cost means that the compliance will be less [7,8].
The resource analysis in health care is of particular importance since resources are of fundamental importance to both market and non-market economic activities. The economic analysis in health care is an accurate reflection of the system that is an economic analysis of the supply, encompassing the provision, allocation, and usage of resources.
The pharmaceutical market in India has over 20,000 medicine formulations, and majority of them are sold under brand names [9]. The same formulations of different brands are sold with different costs which put the prescriber in difficult state in deciding the best drug
for a given patient. Information generated from pharmacoeconomic analysis studies will be helpful for both the doctors and patients in choosing the correct medicine and for policymakers in successfully utilizing the available resources effectively [10]. Patients have to pay more unnecessarily if costly brands are prescribed. The costly brand of same generic drug is scientifically proved to be in no way superior to its economically cheaper counterpart [11].
The increased incidence and prevalence of coronary heart disease (CHD) in recent years have produced a great economic burden on total health-care expenditure in many countries. This includes the increased cost of prevention as well as the cost of treatment of CHD and related events [12]. Pharmacoeconomic analysis of statin has become extremely important in substantiating the true economic value of these lipid-lowering therapies. Statin treatment was shown to be cost-effective in comparison with other health-care interventions, and cost-effectiveness was related to the efficacy of the drug and the risk of cardiovascular disease at baseline. In addition, the cost-effectiveness of statins was improved by about 40% if high-density lipoprotein cholesterol levels were taken into account. Statins are one of the most commonly used antihyperlipidemic agents for treating cardiovascular patients and also for stroke patients [13].
The simvastatin was discovered in 1988, atorvastatin in 1997, and rosuvastatin in 2003 [14] but are available in varying prices. The range of the cost of different marketed statin tablets is from Rs.17.5 to Rs.127.0 per a strip of 10 tablets. Although it was reported that rosuvastatin (10 mg) is more efficacious than atorvastatin (10 mg) in cholesterol-lowering effect and high-density lipoprotein-C raising effect [15], all brands of three drugs have equal strength which are assumed to © 2018 The Authors. Published by Innovare Academic Sciences Pvt Ltd. This is an open access article under the CC BY license (http://creativecommons. org/licenses/by/4. 0/) DOI: http://dx.doi.org/10.22159/ajpcr.2018.v11i7.23670
produce the same outcomes. By considering this lot of variation in the cost of statin tablets, “statins” were selected for the present study of pharmacoeconomic analysis.
Hence, the main aim of the present work was a comparison of in vitro
performance of different marketed statin tablets of dose 10 mg with varying prices ranging between Rs.17.5 and Rs.127.0 by suitable statistical test so as to apply the CMA or CEA of pharmacoeconomics to the statin tablets, to conclude the relation between the cost and effectiveness.
METHODS
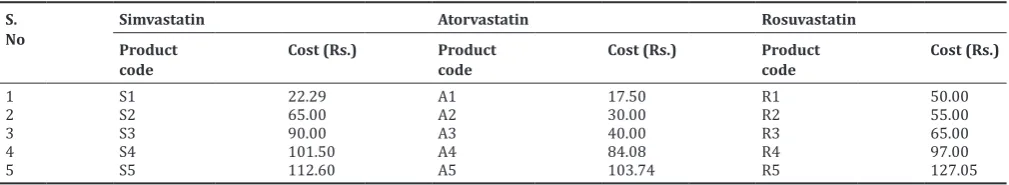
Simvastatin, atorvastatin, and rosuvastatin tablets of five different brands were purchased from the market, and their product codes and costs are given in Table 1.
Pharmacoeconomic analysis method
The method adopted for performing the analysis is CMA. CMA is a simple tool used to compare costs of two or more programs that have identical outcomes, and it is thus possible to say that least costly drug, when considering all resources used, is the most cost-effective one [16,17].
Price variation[9,10,18]
The difference between the maximum and minimum costs of the tablets of the same drug manufactured by different pharmaceutical companies was calculated, using the following formula and determined percentage price variation for all three statin tablets.
% price variation
% Price variation of Simvastatin: (112.60–22.29/22.29)×100=405.1%
Atorvastatin: (103.74–17.50/17.50)×100=492.8%
Rosuvastatin: (127.05–50.00/50.00)×100=154.1%
The in vitro tests performed with the above tablets were: [19,20]
1 - weight variation, 2 - friability, 3 - hardness test, 4 - disintegration test, and 5 - dissolution test
Weight variation
20 tablets were selected at random from different brands of three statin tablets and determined their weight using an electronic balance, and the average weight was calculated. The uniformity of weight was determined according to the IP specifications. As per IP limits, not more than two of the individual tablet weight should deviate from average weight by more than twice the percentage among 20 tablets tested.
Friability test
Tablets were subjected to combined effects of abrasive and shock by utilizing a plastic chamber that revolves at 25 rpm dropping the tablets at a distance of six inches with each revolution using Roche
friabilator. Pre-weighed (W1) 10 tablets from different brands were placed in the friabilator individually, which was operated for 100 revolutions. The tablets were dusted and reweighed (W2). The percentage loss during the test was calculated using below formula. Tablets that loose <0.5–1% of their weights are considered as acceptable.
% loss in Friability = W1−W2/W1*100
Hardness test
Tablets required a certain amount of strength or hardness and resistance to withstand mechanical shocks of handling during packing and shipping. Tablet hardness is the force required to break a tablet in a diametric compression test. 10 tablets from each brand of three different statins were taken, and hardness was determined with Pfizer hardness tester. The average hardness is expressed in kg/cm2.
Disintegration test
The disintegration test was carried out using USP tablet disintegration test apparatus. The disintegration time of six tablets of different brands that is the time at which no residue of tablet remains on mesh of apparatus was noted.
Dissolution test (in vitro bioavailability)
Dissolution test according to I.P was conducted using USP dissolution test apparatus-I. The stated volume (900 ml) of the dissolution medium was introduced into the vessel of apparatus, and the dissolution medium was freed from dissolved air. The dissolution medium was warmed to 36.5–37.5°C.
The tablet was placed in a dry basket. At the beginning of each test, the basket was lowered into position before rotation. The apparatus was operated immediately at the speed of rotation (75 rpm) which was specified. The samples from a zone midway between the surfaces of dissolution medium and the top of the rotating basket were taken which is not <10 mm from the wall of the vessel at different time intervals up to 3 h. Volume of dissolution medium equal to the volume of the sample withdrawal in different time intervals was added. The analysis was performed with three tablets of each brand. For each of tablet, the amount of dissolved active ingredient in the solution was calculated as a percentage of the stated amount dissolved using respective standard graphs. Then, T90%, i.e., time taken to dissolve 90% of drug from selected tablets in
dissolution test was determined.
Standard graph for statins
Standard graph of statins was plotted by measuring the absorbance of prepared known dilutions of statins. Absorbance values of the dilutions of different statins were measured, and averages of these values were taken for the construction of standard graph.
Statistics
All the tests were conducted in triplicate with each brand of all statin tablets. Moreover, results are expressed in average (Av.)±standard deviation. One-way ANOVA test was applied and correlation coefficient (r) was calculated to correlate the cost of the statin tablets with the results of in vitro tests.
Table 1: List of selected brands of different statin tablets and its prices S.
No SimvastatinProduct Atorvastatin Rosuvastatin
code Cost (Rs.) Product code Cost (Rs.) Product code Cost (Rs.)
1 S1 22.29 A1 17.50 R1 50.00
2 S2 65.00 A2 30.00 R2 55.00
3 S3 90.00 A3 40.00 R3 65.00
4 S4 101.50 A4 84.08 R4 97.00
RESULTS AND DISCUSSION
As per Table 1, the costliest tablet of simvastatin was S5, with the cost of Rs. 112.60, and the cheapest tablet of simvastatin was S1 with the cost of Rs. 22.29. The costliest tablet of atorvastatin was A5 (Rs.103.74), and the cheapest tablet of atorvastatin was A1 with the cost of Rs. 17.50. The costliest tablet of rosuvastatin was R5 with the cost of Rs.127.05 and the cheapest tablet of rosuvastatin was R1 with the cost of Rs. 50.00. Percentage price variation was calculated for three statin drugs. Among the selected statins, simvastatin tablets showed maximum price variation of 492.8% while rosuvastatin tablets showed the minimum percentage price variation of 154% (Table 2).
In the present study, for the first time, the variation of costs among different brands of statin tablets available in the Indian market was analyzed using in vitro evaluation methods. Our findings revealed that the prices of various statin drug formulations showed great variation. Cost becomes a concerning factor when these drugs are to be used on a long-term basis and it influences the patient compliance and also becomes a burden for maintaining the health of the population. Due to a lack of information on comparative drug prices and quality, it becomes difficult for physicians to prescribe the most economical treatment.
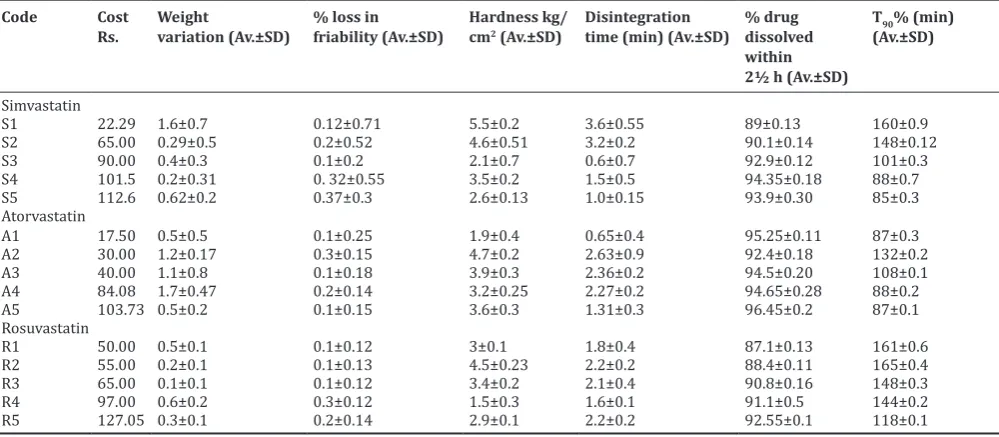
The selected tablets of simvastatin, atorvastatin, and rosuvastatin are taken and subjected to different in vitro tests. The results of all these tests along with their costs are shown in Table 3.
The highest weight variation was found to be 1.6% with the brand S1 which is the cheapest brand, and the lowest weight variation was found to be 0.2% with the brand S4 among Simvastatin tablets. The highest weight variation was found to be 1.7% with the brand A4 and the lowest weight variation was found to be 0.5% with the brand A5 and A1, among the atorvastatin tablets which are the costliest and cheapest brands, respectively. In case of rosuvastatin, the highest weight variation was found to be 0.6% with the brand R4 which is second costliest and
the lowest weight variation was found to be 0.1% with the brand R3 which has a medium cost. Hence, it was found that there is a significant difference in weight variation of selected tablets (p=0.01).
In case of Simvastatin, the highest % loss in friability of 0.37% was found with the brand S5 which is the costliest brand and the lowest % loss in friability was found (0.1%) with the brand S3. In case of Atorvastatin, the highest % loss in friability of 0.3% was found with the brand A2 and lowest % loss in friability was found (0.1%) with A5, A3, and A1. In case of Rosuvastatin, the highest % loss in friability of 0.3% was found with the brand R4 and the lowest % loss in friability was found (0.1%) with all other brands of Rosuvastatin, though there was cost variation, there was no significant difference in percentage loss in friability.
The highest hardness of 5.5 kg/cm2was found with the brand S1 which
is the cheapest and the lowest hardness was found (2.1 kg/cm2) with
the brand S3 among Simvastatin tablets. In case of Atorvastatin, the highest hardness of 4.7 kg/cm2 was found with the brand A2 and the
lowest hardness was found (1.9 kg/cm2) with the brand A1, and both
are available at low costs only. In case of Rosuvastatin, the highest hardness of 4.5 kg/cm2 was found with the brand R2 and the lowest
hardness was found (1.5 kg/cm2) with the brand R4. The variation in
hardness among these tablets was statistically significant (p=0.01). The hardness of tablets is important to withstand the mechanical stresses and also influences the rate of dissolution and disintegration. Thus, the significant variation in hardness may lead to changes in effectiveness through disintegration time, dissolution rate, and stability of tablets.
The highest disintegration time of 3.6 min was found with the brand S1 which is the cheapest brand and the lowest disintegration time of 0.6 min was found with the brand S3 among Simvastatin tablets. In case of Atorvastatin, the highest disintegration time of 2.63 min was found with the brand A2 and the lowest disintegration time was found (0.65 min) with the brand A1 which is the cheapest brand. In case of
Table 2: Prices and percentage price variation of different statin tablets
Sl.no Drug Maximum
price (Rs.) Minimum price (Rs.) %price variation
1 Simvastatin 112.60 22.29 492.8
2 Atorvastatin 103.74 17.50 405.1
3 Rosuvastatin 127.05 50.00 154.1
Table 3: Results ofin vitrotests of different selected brands of tablets
Code Cost
Rs. Weight variation (Av.±SD) % loss in friability (Av.±SD) Hardness kg/cm2 (Av.±SD) Disintegration time (min) (Av.±SD) % drug dissolved within 2½ h (Av.±SD)
T90% (min) (Av.±SD)
Simvastatin
S1 22.29 1.6±0.7 0.12±0.71 5.5±0.2 3.6±0.55 89±0.13 160±0.9
S2 65.00 0.29±0.5 0.2±0.52 4.6±0.51 3.2±0.2 90.1±0.14 148±0.12
S3 90.00 0.4±0.3 0.1±0.2 2.1±0.7 0.6±0.7 92.9±0.12 101±0.3
S4 101.5 0.2±0.31 0. 32±0.55 3.5±0.2 1.5±0.5 94.35±0.18 88±0.7
S5 112.6 0.62±0.2 0.37±0.3 2.6±0.13 1.0±0.15 93.9±0.30 85±0.3
Atorvastatin
A1 17.50 0.5±0.5 0.1±0.25 1.9±0.4 0.65±0.4 95.25±0.11 87±0.3
A2 30.00 1.2±0.17 0.3±0.15 4.7±0.2 2.63±0.9 92.4±0.18 132±0.2
A3 40.00 1.1±0.8 0.1±0.18 3.9±0.3 2.36±0.2 94.5±0.20 108±0.1
A4 84.08 1.7±0.47 0.2±0.14 3.2±0.25 2.27±0.2 94.65±0.28 88±0.2
A5 103.73 0.5±0.2 0.1±0.15 3.6±0.3 1.31±0.3 96.45±0.2 87±0.1
Rosuvastatin
R1 50.00 0.5±0.1 0.1±0.12 3±0.1 1.8±0.4 87.1±0.13 161±0.6
R2 55.00 0.2±0.1 0.1±0.13 4.5±0.23 2.2±0.2 88.4±0.11 165±0.4
R3 65.00 0.1±0.1 0.1±0.12 3.4±0.2 2.1±0.4 90.8±0.16 148±0.3
R4 97.00 0.6±0.2 0.3±0.12 1.5±0.3 1.6±0.1 91.1±0.5 144±0.2
R5 127.05 0.3±0.1 0.2±0.14 2.9±0.1 2.2±0.2 92.55±0.1 118±0.1
Rosuvastatin, the highest disintegration time of 2.2 min was found with the brand R2 and the lowest disintegration time was found (1.6 min) with the brand R4; both are available at different costs. The variation in disintegration time was statistically significant among the selected tablets (p=0.01).
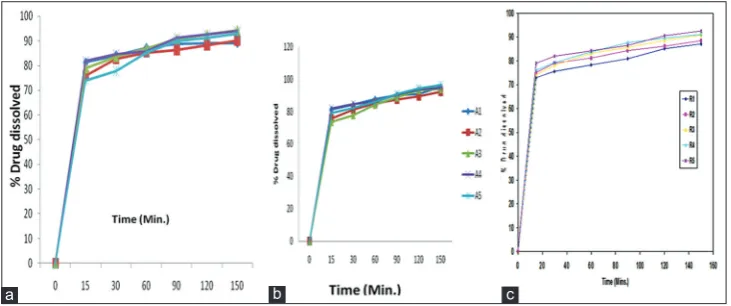
The rate of dissolution was determined for all tablets (Fig. 1) from which the % drug dissolved within 2½ h was calculated using their respective standard graphs (Table 3). In case of Simvastatin, the percentage of drug dissolved was the highest from S4 (94.35%) which is the second costliest brand and the lowest % was dissolved from S1 (89%). The percentage drug dissolved in 2½ h was the highest from the costliest brand of A5 (96.45%) and was the lowest from A2 tablets (92.4%) among Atorvastatin tablets.
In case of Rosuvastatin, the percentage drug dissolved in 2½ h was the highest from R5 (92.55%) which is the costliest and the lowest from R1 (87%). T90% was determined for all tablets (Table 3); the least T90%
was observed with S5 and high T90% with S1 tablets among simvastatin
tablets, the least T90% was observed with A1 and A5 and high T90% with
A2 tablets among Atorvastatin tablets, and least T90% was observed with
R5 and high T90% with R2 was found among Rosuvastatin tablets which
was not related to cost.
Correlation coefficient (r) between cost and results of different in vitro tests was calculated separately to understand the relationship between costs and
results. Always it lies between “−1” and “+1,” and positive values represent
positive relationship between two parameters and vice versa. The least “r” value was found among Atorvastatin tablets in disintegration time, dissolution, and T90% compared to Simvastatin and Rosuvastatin tablets.
All the results have shown positive correlation with cost, whereas T90%
of Simvastatin and Rosuvastatin tablets has shown a negative correlation with cost, which indicated that as the cost increased, time required to release 90% was decreased. It confirmed that the drug is releasing fast as cost is increased. The order of tablets of different brands and
correlation coefficient (r) with respect to the results of in vitro tests performed is shown in Table 4.
The above results revealed that there is a less correlation among
Atorvastatin tablets and positive correlation between cost and T90%
of Atorvastatin tablets, which confirmed that the costly tablets do not show excellent performance and vice versa. The variations in the results of tests might be due to difference in the quality of excipients or the presence of impurities in ingredients used to prepare tablets which may lead to vary in the final cost of tablets.
CMA was applied to the in vitro parameters by means of one-way ANOVA test and found that there was no significant difference in the results of some of the in vitro tests of selected brands of statins of different prices, and results of all tests of all tablets are within acceptable limits.
CONCLUSION
The present study was concluded that there is a significant difference in the results of some of in vitro parameters, i.e. hardness, disintegration time, friability, and weight variation among the tablets of selected brands of simvastatin, atorvastatin, and rosuvastatin, which can be correlated with the in vivo efficacy of the dosage form taken.
According to CMA, the difference in costs might be due to differences in their in vitro performance. There are various reasons for the price variation of statin tablets, but those are confidential due to protection of formulae under patent. Due to lack of information on comparative drug prices and quality, it becomes difficult for physicians to prescribe the most economical prescription [21].
Hence, the CMA can be ruled out for these brands S1 to S5, A1 to A5, and R1 to R5, as there was no significant correlation between cost and results of some of in vitro parameters of the tablets. By considering the costs incurred on the patients, the manufacturers should try to minimize the input costs. Even though there is a slight decrease in the cost of dosage form, the patients will be benefited largely. Hence, the present
Fig. 1: Comparison of dissolution rate of selected brands of (a) Simvastatin, (b) Atorvastatin, (c) Rosuvastatin tablets
Table 4: Correlation coefficient (r) values and order of tablets based on results of differentin vitrotests
Sl.no. Name of parameter Simvastatin Atorvastatin Rosuvastatin
Order r
value Order r value Order r value
1 Cost of tablets S5>S4>S3>S2>S1 _ A5>A4>A3>A2>A1 _ R5>R4>R3>R2>R1 _
2 Weight variation S1>S5>S3>S2>S4 _ A4>A2>A3>A5=A1 _ R4>R1>R5>R2>R3 _
3 % loss in friability S5>S4>S2>S1>S3 _ A2>A4>A3>A5=A1 _ R4>R5>R3=R2=R1 _
4 Hardness kg/cm2 S1>S2>S4>S5>S3 _ A2>A3>A5>A4>A1 _ R2>R3>R1>R5>R4 _
5 Disintegration time (min) S1>S2>S4>S5>S3 0.872 A2>A3>A4>A5>A1 0.041 R2>R3>R5>R1>R4 0.056 6 % drug dissolved in 2½ h S4>S5>S3>S2>S1 0.793 A5>A1>A3>A4>A2 0.561 R5>R4>R3>R2>R1 0.892
7 T90% S1>S2>S3>S4>S5 -0.948 A2>A3>A4>A5>A1 0.298 R2>R1>R3>R4>R5 0.953
study recommends that the pharmaceutical companies should engage sufficient number of Economists of pharmacyto enlight the importance of the concept of pharmacoeconomics, to help the lot of patients.
This study shows that there is a wide variation in the prices of most of the statins available. Health-care providers must be aware of availability of low-cost brands or generics available among statins and prescribe accordingly based on the economic status of the patient for successful treatment of hypertension or hyperlipidemia. There is an urgent need to decrease the wide price variation seen with statins by the government to decrease the economic burden on population.
In the present study, it was revealed that there is no significant correlation between cost and performance as there is no excellent
in vitro performance found from the costliest tablets and vice versa, and the results of all tests of all tablets are within acceptable limits.
REFERENCES
1. McGhan WF. International society for pharmacoeconomics and
outcomes research: Visions for the 21st Century. Clin Ther 1996;18:1-4.
2. McGhan WF, Smith MD. Economic analysis of pharmacists counseling
on patient smoking cessation outcomes:Anational study. Am J Health
Syst Pharm 1996;53:45-52.
3. Rascat KL. Essentials of pharmacoeconomics. Am J Pharm Educ 2009;73:94.
4. McGhan WF, Rowland CR, Boot Man JL. Cost-benefit and cost-effectiveness methodologies applied to innovative pharmaceutical
services. Am J Hosp Pharm 1978;35:133-40.
5. Sulmasy DP, Physicians. Cost control and ethics. Ann Intern Med 1992;116:920-6.
6. Meropol NJ, Schulman KA. Cost of cancer care: Issues and implications. J Clin Oncol 2007;25:180-6.
7. Rao KS, Nundy M, Dua AS. National Commission on Macroeconomics and Health. Financing and Delivery of Health Care Services in India. New Delhi: Ministry of Health Care Services in India: Delivery of Health Services in the Private Sector; 2005. p. 89-104.
8. Bhanuprakash K, Divyashanthi CM. Pharmacoeconomic analysis of drugs used for peptic ulcer in Indi. Int J Basic Clin Pharmacol
2016;5:1672-7.
9. Jadhav NB, Bhosale MS, Adhav CV. Cost analysis study of oral anti diabetic drug avilable in india market. Int J Med Res Health Sci. 2013;2:63-9.
10. Adam T, Evans DB, Murray CJ. Econometric Estimation of Country- Specific Hospital Costs, Cost Effectiveness and Resource Allocation; 2009. Available from: http://www.resource allocation. 11. Das SC, Mandal M, Mandal SC. A critical study on availability and
price variation between different brands: Impact on access to medicines. Ind J Pharm Sci 2007;69:160-3.
12. Laxminarayana K, Satish GR. Cost variation analysis of antihypertensive drugs available in indian market: An economic perspective: Int J Pharm Sci Res 2016;7:2050-6.
13. Sangram V, Rakshith V, Murari CH, Venkateshwarlu K. A study on symptoms, risk factors and prescribing pattern of drugs used in stroke patients. Int J Pharm Pharmsci 2015;7:421-6.
14. Affandi MM, Minaketantripathya B, Majeed AB. The prospect, promises and hindrances of statin base molecules: Look back to look forward. Int J Pharm Pharmsci 2016;8:22-33.
15. Mohammad AK, Murti K, Vaibhav G, Lal K, Singh D, Das P, et al.
Aatorvastatinvsrosuvastatin; fenofibrate as an add on: An exploratory study. Int J Pharm Pharmsci 2014;6:493-8.
16. Jainam VS, Kalyani NP, Deshpandeshrikalp S. Pharmacoeconomics evaluation, cost minimization analysis of Anti-diabetic therapy in Gujarat. Int J Med Res Health Sci 2006;5:34-43.
17. Abhishek MP, Jitendra HH, Kiran RD, Sagar SP, Madhura N. Cost analysis of long established and newer oral antiepileptic drugs available in the Indian market. Int J Med Res Health Sci 2015;4:744-8. 18. Lalan HN, Borde MK, Ray IM, Deshmukh YA. Cost variation study of
antidiabetics: Indian scenario. Indian J Appl Res 2014;4:420-1. 19. Fonner DA, Anderson NR, Banker GS. Granulation and tablet
characteristics. In: Libermann H, Lachmann L, editor. Pharmaceutical Dosage Forms: Tablets. Vol 2. New York: Dekker; 1982. p. 202. 20. Indian Pharmacopoeia. Govt.of India, Ministry of health and Family
welfare, The Indian pharmacopoeia Commission, Ghaziabad, India. Indian Pharmacopoeia. Vol. 2, Appendix 7, A-80 for Disintegration, A-82 for Dissolution Procedures, Edition. Ghaziabad, India: Govt.of India, Ministry of health and Family Welfare; 1996.