Prostate-specific antigen testing for prostate cancer screening: A national survey of Canadian primary care physicians’ opinions and practices
Mitchell Geoffrey Goldenberg1; Sean C. Skeldon2; Madhur Nayan1; Yegappan Suppiah1; Linda Chow1; Elise Fryml1; David Greenberg2; Rajiv K. Singal1; S. Larry Goldenberg3
1Department of Surgery, Division of Urology, University of Toronto, Toronto, ON, Canada; 2Department
of Family and Community Medicine, University of Toronto, Toronto, ON, Canada; 3Department of Urologic Sciences, University of British Columbia, Vancouver, BC, Canada
Cite as: Can Urol Assoc J 2017; Epub ahead of print. http://dx.doi.org/10.5489/cuaj.4486
Published online November 1, 2017
***
Abstract
Introduction: In 2014, the Canadian Task Force on Preventive Health Care (CTFPHC) recommended against routine prostate cancer screening with the prostate-specific antigen (PSA) blood test.1 We surveyed Canadian primary care physicians (PCPs) to understand their opinions and attitudes towards prostate cancer screening in 2016.
Methods: Twenty PCPs piloted the survey to assess its accessibility. We distributed a flyer to 19 633 PCPs as an insert in a large mailed package inviting them to attend a national meeting, and later promoted the survey at the meeting. Multinomial logistic regression models examined factors associated with agreement of key guideline statements and the overall benefit of PSA screening.
Results: A total of 1254 PCPs responded (rate of 6.4%); 54.7% of physicians aware of the CTFPHC recommendations report screening less often as a result. Overall, 55.6% of PCPs feel that the risks of PSA screening outweigh the benefits. On multivariable analysis, physicians who did not read the guidelines, did not have an academic appointment, or were in practice for over 20 years were significantly more likely to disagree with the statement that men 55‒69 years old should not be screened for prostate cancer with PSA.
Introduction
Prostate cancer is the most prevalent cancer amongst Canadian men, representing 24% of all new cancer diagnoses in Canada.1 For nearly three decades, screening for prostate cancer with prostate-specific antigen (PSA) testing has been an essential component of preventive care.2 More recently, the risks and benefits of PSA as a screening biomarker for prostate cancer have come under scrutiny, prompting a re-evaluation of its role in clinical practice.3,4
First in 2008, and again in 2012, the United States Preventive Services Task Force (USPSTF)3 published recommendations against screening for prostate cancer based on two large randomized controlled trials. The USPSTF is a government-issued panel composed of clinical epidemiologists, internists and primary care physicians, who objectively analyze available data and make recommendations based on the perceived quality of the evidence. Following the 2012 updated recommendations, the Canadian government asked the Canadian Task Force on Preventive Health Care (CTFPHC)4 to undertake a comparable analysis. In 2014 a similar recommendation against screening for prostate cancer with the PSA test was published by the CTFPHC. The American and Canadian taskforces cite both of the large randomized trials in their recommendations, as neither was able to show an overall survival benefit in their screening arms despite evidence of false-positive biopsies, over-diagnosis of non-life threatening cancers, and subsequent complications from investigation and treatment.5,6
These recommendations have been met with criticism from urologists, oncologists and patient advocacy groups. In October 2014, the Canadian Urological Association (CUA) issued a press release addressing the CTFPHC recommendations, citing concerns that the task force failed to include key observational studies that point to PSA’s utility in both screening and risk-stratification of men aged less than 55 years old.7,8 The CUA also cited the failure to acknowledge the role of PSA screening in conservative
management (“active surveillance”) of diagnosed low risk cases,9 an established clinical practice in Canadian urology.
In light of this ongoing controversy, the views and practices of Canadian PCPs in 2016 remain heterogeneous. In 2012, Kapoor et al published the results of a provincial survey of Ontario family physicians, immediately following publication of the USPSTF guidelines.10 They found a wide variation amongst Ontario PCPs, around both general PSA screening practices and their individual beliefs about the utility of screening for prostate cancer. Earlier studies conducted in British Columbia and Newfoundland and Labrador found similar results.11,12
Methods
Our survey instrument was designed for distribution to PCPs across Canada who routinely see men of prostate cancer screening-appropriate age in their practice (Appendix-1). The survey questionnaire and content were developed systematically through multiple iterations, with input from experts in key stakeholder groups. Prior to distribution, a pilot survey was conducted using local area PCPs from both community and academic practices in Ontario and British Columbia, and feedback was collected regarding the content and accessibility of the instrument.
The population approached to complete the survey represented a sampling of PCPs from across Canada, excluding Quebec. A flyer was distributed as an insert to a mailed invitation to attend a national primary care physician conference. We used a raffle prize draw to incentivize participants to complete the survey. 19,633 physicians (of a total 30,902 PCPs in Canada, excluding Quebec) received the mailing including our invitation, informing them of the purpose of the study and directing them to a web address where the survey was located, hosted by Fluid Surveys (www.fluidsurveys.com). The survey was kept open for 3 months in total to ensure enough time for respondents to access the questionnaire (June-August 2016). We then re-opened and promoted the survey at the national conference, asking those who had yet to complete the questionnaire to do so.
Descriptive statistics included frequency-distribution data and histogram representation of survey responses. Stratification of the cohort allowed for data comparisons across different demographic categories. Mann-Whitney U and Kruskal-Wallis tests were used to identify significant variations in agreement with guideline statements and overall benefit of PSA screening across strata. We used multinomial logistic regression models to understand the relationship between physician demographic and practice type, agreement with guideline statements and interpretation of the overall risk-benefit relationship of PSA screening. Statistical significance was set at p<0.05 based on a two-tailed comparison. Statistical analyses were performed using SAS 9.3 (SAS Institute Inc., Cary, NC, USA). Ethical approval was granted for the study (REB Ref. 670-1601-Uro-009).
Results
Demographics
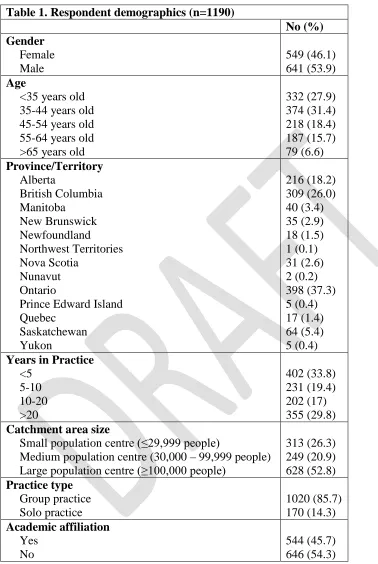
Demographic data from both the first and second enrollment periods were similar, and so were combined for the overall analysis (Table-1).
Sources of information on screening guidance
Our questionnaire asked respondents to identify where they turn to for guidance
regarding best practice in cancer screening. 45.4% reported using government agencies to inform their screening practice (e.g. CTFPHC), whereas 26.1% use specialist
organizations (e.g. CUA), and 25.3% look to national or provincial Colleges.
Understanding of and agreement with CTFPHC guidelines
81.5% of respondents were aware of the 2014 CTFPHC guidelines at the time of the survey, 80.9% of whom reported having read the document. Of those reading the guideline, 78.1% perceived the guidelines to be either ‘clear’ or ‘very clear’. Of those who were aware of the recommendations, 54.7% reported screening less as a result, 4.7% screen more often, and 40.5% reported no change in their screening practices (of whom 23.1% report not routinely using the PSA test).
We then asked respondents to state their level of agreement with the CTFPHC report’s recommendations on screening for three separate age groups of men (Figure-1). There was little agreement regarding men aged 55 to 69 years of age, with 38.8% of respondents agreeing that men in this cohort should not be screened. Notably 10.6% of respondents reported disagreement with all three guideline statements, whereas 35% agreed with all CTFPHC recommendations.
Screening practice patterns
Respondents were asked to outline their screening practices for men with different prostate cancer risk profiles (Figure-2). We also inquired more generally about screening methods. 52.6% of respondents reported using both PSA and digital rectal examination (DRE), with 14.5% using DRE alone and 10.2% using only PSA testing without physical examination. Figure-3 illustrates the patient ages at which physician’s initiate and
terminate routine prostate cancer screening. When the initial test is normal the frequency of PSA testing by those who recommend screening was either annually (22.9%), every 2 years (31.6%) or not again (27.6%). Finally, we asked respondents to provide their overall level of agreement with the statement that in average risk men, PSA screening’s benefits outweigh its risks (Figure-4).
Shared decision-making
Multivariable analysis
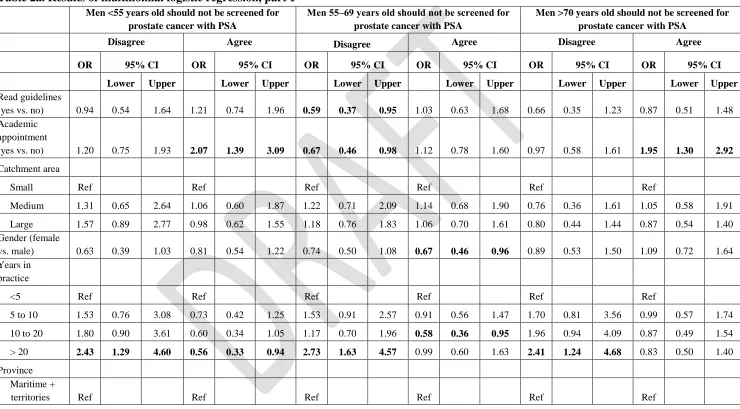
Multinomial logistic regression models were constructed to better understand whether key demographics and practice-types of PCPs affected their agreement with guideline statements and overall perceived benefit of PSA screening (Table-2a). The relative odds of agreeing rather than being neutral was 2.07 (95% CI 1.39 to 3.09) times for PCPs with an academic appointment compared to PCPs without an academic appointment.
Conversely, those with over 20 years in practice were more likely to disagree with this recommendation (OR 2.43, 95% CI 1.29-4.60). In men 55 to 69 years old, PCPs who had read the guidelines document were less likely to disagree than be neutral with the
CTFPHC’s recommendation (OR 0.59, 95% CI 0.37-0.95), as were those with an academic appointment (OR 0.67, 95% CI 0.46-0.98). However, physicians with 10-20 years experience were less likely to agree than be neutral with this recommendation (OR 0.58, 95% CI 0.36-0.96). Those with more than 20 years experience were also more likely to disagree than be neutral that men aged 55 to 69 should not be screened (OR 2.73, 95% CI 1.63-4.57). We examined which demographics predicted a PCP’s
agreement with the statement ‘in average risk men (i.e. no risk factors for prostate cancer) the benefits of prostate cancer screening outweigh the risks’ (Table-2b). Similar to the guideline statements, those PCPs who had read the guideline document were more likely to disagree than be neutral with this statement (OR 1.88, 95% CI 1.25-2.85). Physicians with greater than 20 years experience (OR 3.55, 95% CI 2.03-6.19) were more likely to agree than be neutral with the above statement, and those with 10-20 years experience were both more likely to agree (OR 2.00, 95% CI 1.12-3.58) and less likely to disagree (OR 0.59, 95% CI 0.36-0.95) that the benefits of PSA screening outweigh the risks, compared to physicians with neutral responses.
Discussion
Despite the disappointing response rate, our survey was able to collate the opinions and practices of over 1200 Canadian PCPs, and demonstrates the impact of the CTFPHC guidelines on prostate cancer screening in this country. As a result of simply being aware of the CTFPHC guideline, the majority (54.7%) of respondents state they have decreased the amount of screening they perform in their practice. As PCPs form the front line of cancer screening, this will have an undeniable impact on the number of men referred for biopsy and subsequently the incidence of prostate cancer diagnoses in Canada in future years. The vast majority of our respondents had no issue with the clarity of the guidelines document, with 78.1% stating they were ‘clear’ or ‘very clear.’ Additionally, we found that PCPs generally agreed with statements put forward by the CTFPHC, particularly that men under the age of 55 and over the age of 70 should not receive prostate cancer
Despite the general acceptance of these recommendations, there still exists a significant amount of variation amongst Canadian PCP’s screening practices. This clearly has both medical and legal implications. Amongst average-risk patients, there is an even split in approach, with equal numbers of respondents recommending for and against PSA screening after a risk/benefit discussion with the patient. In addition, PCPs are screening men with lower urinary tract symptoms although these are not associated with an
increased risk of prostate cancer diagnosis and this is clearly discussed in the CTFPHC recommendations. While it is difficult to answer why this is the case, this may represent a misunderstanding amongst physicians around current known prostate cancer risk factors.
The multinomial logistic regression models that were constructed allowed us to examine which respondent demographics and practice types predicted agreement with guideline statements and the overall benefit of PSA screening (Tables 2a & 2b). When looking at these analyses together, we can see that those PCPs with more years in practice seem to disagree with the CTFPHC’s recommendations against PSA screening, and this same group of physicians also are more likely to agree with the notion that the benefit of PSA screening outweighs the risks overall. This finding is interesting as it is these
physicians who were in practice before and during the initiation of PSA screening. It may be that the number of men presenting with locally advanced and metastatic prostate cancer encountered by this subgroup in the pre-screening era has dissuaded them from ceasing PSA screening despite CTFPHC recommendations.
Our survey results are compatible with recent observed trends in prostate cancer screening in both the United States and Canada. Bhindi et al. described a decrease in the number of men being referred for prostate biopsy to a high volume centre, in the wake of the 2012 USPTF recommendations13. They found that the detection rate of low-grade, but also intermediate and high-grade prostate cancers, dropped from 2008 to 2013 in their time series analysis. Similarly, studies from the United States also show that prostate cancer screening decreased following the 2008 USPTF recommendations,14,15 as did the incidence of low-grade prostate cancer diagnoses.16,17 These are expected
epidemiological findings after the publication of a guideline against screening, but worryingly recent population data from the Surveillance, Epidemiology, and End Results (SEER) database indicates the rate of lethal cancers may be rising at the same time.18 Our study adds to this body of literature by addressing the perceptions and practices of PCPs, with whom the ultimate responsibility for carrying out PSA screening sits.
There are limitations to our survey, primarily the low response rate, and
notices, and this may have also contributed to the low response rate. We do not believe that the structure or content of the questionnaire itself contributed to this limitation, as the completion rate from those who accessed the survey was very high (93%). We are
concerned that many PCP’s are just not interested in the topic or do not deal with men during their at-risk years for prostate cancer. This apparent apathy should serve as a call to urologists, radiation and medical oncologists, and allied health care professionals to increase our efforts to engage PCP’s in the prostate cancer screening conversation. Proposed avenues to accomplish this include the organization of community forums on the issue with urologist and PCP discussion and debate, academic and clinical
collaborative efforts, and increased physician engagement with social media. A final limitation is that Quebec PCPs were not surveyed in this study because the flyers were not mailed to physicians in this province.
The gap between the Canadian Urological Association position and the
perceptions of PCPs in our survey around prostate cancer screening appears to be wide. The results presented here show that there may be a disconnect in understanding between two groups of physicians crucial to the health of this population. Although the evidence for PSA screening is mixed, the rational and passionate arguments on both sides of the issue imply that the optimal, patient-centered approach to this problem lies somewhere between screening for all men or none. Our understanding of PSA has become more nuanced over the past two decades, and the evidence would suggest that careful patient selection and thoughtful timing of PSA testing (so-called “smart screening”) can lead to fewer unnecessary biopsies and increased detection of high-risk cancers.22 While it is correct to look to high-level evidence for guidance on cancer screening, like the randomized control trials in this field, the unfortunate contamination of these studies mean that we must be cautious when interpreting their findings.23 To make sweeping recommendations based on the results of these few studies at face value will see us return to a time when a diagnosis of prostate cancer often had a much bleaker presentation and outcome.24
The landscape of prostate cancer screening continues to be in flux. A 2017
Conclusion
References
1. Statistics CCSACOC. Canadian Cancer Statistics 2015. Toronto, ON: Canadian Cancer Society; 2015.
2. Bunting PS, Goel V, Williams JI, Iscoe NA. Prostate-specific antigen testing in Ontario: reasons for testing patients without diagnosed prostate cancer. Canadian Medical Association Journal. 1999;160(1):70-75.
3. Moyer VA. Screening for Prostate Cancer: U.S. Preventive Services Task Force Recommendation Statement. Ann Intern Med. 2012;157(2):120-134.
doi:10.7326/0003-4819-157-2-201207170-00459.
4. Krahn M. Prostate cancer screening: going beyond the clinical evidence. Canadian Medical Association Journal. 2014;186(16):1201-1201. doi:10.1503/cmaj.141252. 5. Schröder FH, Hugosson J, Roobol MJ, et al. Screening and prostate-cancer
mortality in a randomized European study. N Engl J Med. 2009;360(13):1320-1328. doi:10.1056/NEJMoa0810084.
6. Andriole GL, Crawford ED, Grubb RL, et al. Mortality results from a randomized prostate-cancer screening trial. N Engl J Med. 2009;360(13):1310-1319.
doi:10.1056/NEJMoa0810696.
7. Schröder FH, Hugosson J, Carlsson S, et al. Screening for prostate cancer decreases the risk of developing metastatic disease: findings from the European Randomized Study of Screening for Prostate Cancer (ERSPC). European Urology. 2012;62(5):745-752. doi:10.1016/j.eururo.2012.05.068.
8. Lilja H, Cronin AM, Dahlin A, et al. Prediction of significant prostate cancer diagnosed 20 to 30 years later with a single measure of prostate-specific antigen at or before age 50. Cancer. 2011;117(6):1210-1219. doi:10.1002/cncr.25568. 9. Murphy DG, Ahlering T, Catalona WJ. The Melbourne Consensus Statement on
the early detection of prostate cancer. BJU …. 2014. doi:10.1111/bju.12556/full. 10. Allard CB, Dason S, Lusis J, Kapoor A. Prostate cancer screening: Attitudes and
practices of family physicians in Ontario. CUAJ. 2012;6(3):188-193. doi:10.5489/cuaj.11290.
11. Hoag NA, Davidson RA, Pommerville PJ. Prostate cancer screening practices and attitudes among primary care physicians in Victoria, British Columbia. British Columbia Medical Journal.
12. Curran V, Solberg S, Mathews M, et al. Prostate Cancer Screening Attitudes and Continuing Education Needs of Primary Care Physicians. Journal of Cancer Education. 2009;20(3):162-166.
13. Bhindi B, Mamdani M, Kulkarni GS, et al. Impact of the U.S. Preventive Services Task Force Recommendations against Prostate Specific Antigen Screening on Prostate Biopsy and Cancer Detection Rates. The Journal of Urology.
14. Shoag J, Halpern JA, Lee DJ, et al. Decline in Prostate Cancer Screening by Primary Care Physicians: An Analysis of Trends in the Use of Digital Rectal Examination and Prostate Specific Antigen Testing. JURO. 2016;196(4):1047-1052. doi:10.1016/j.juro.2016.03.171.
15. Sammon JD, Abdollah F, Choueiri TK, et al. Prostate-Specific Antigen Screening After 2012 US Preventive Services Task Force Recommendations. JAMA.
2015;314(19):2077-2079. doi:10.1001/jama.2015.7273.
16. Jemal A, Fedewa SA, Ma J, et al. Prostate Cancer Incidence and PSA Testing Patterns in Relation to USPSTF Screening Recommendations. JAMA.
2015;314(19):2054-2061. doi:10.1001/jama.2015.14905.
17. Jemal A, Ma J, Siegel R, Fedewa S, Brawley O, Ward EM. Prostate Cancer Incidence Rates 2 Years After the US Preventive Services Task Force Recommendations Against Screening. JAMA Oncol. August 2016. doi:10.1001/jamaoncol.2016.2667.
18. Thomas CR Jr, Shyr Y. Determining Penetration of Prostate-Specific Antigen Screening Recommendations. JAMA Oncol. December 2016:1-3.
doi:10.1001/jamaoncol.2016.5978.
19. Cull WL, O'Connor KG, Sharp S, Tang S-FS. Response rates and response bias for 50 surveys of pediatricians. Health Serv Res. 2005;40(1):213-226.
doi:10.1111/j.1475-6773.2005.00350.x.
20. Templeton L, Deehan A, Taylor C, Drummond C, Strang J. Surveying general practitioners: does a low response rate matter? Br J Gen Pract. 1997;47(415):91-94.
21. Wiebe ER, Kaczorowski J, MacKay J. Why are response rates in clinician surveys declining? Can Fam Physician. 2012;58(4):e225-e228.
22. Leapman MS, Carroll PR. What is the best way not to treat prostate cancer? Urol Oncol. 2017;35(2):42-50. doi:10.1016/j.urolonc.2016.09.003.
23. Shoag JE, Mittal S, Hu JC. Reevaluating PSA Testing Rates in the PLCO Trial. N Engl J Med. 2016;374(18):1795-1796. doi:10.1056/NEJMc1515131.
24. Weiner AB, Matulewicz RS, Eggener SE, Schaeffer EM. Increasing incidence of metastatic prostate cancer in the United States (2004–2013). Prostate Cancer Prostatic Dis. 2016;19(4):395-397. doi:10.1038/pcan.2016.30.
25. Bibbins-Domingo K, Grossman DC, Curry SJ. The US Preventive Services Task Force 2017 Draft Recommendation Statement on Screening for Prostate Cancer. JAMA. April 2017:1-2. doi:10.1001/jama.2017.4413.
26. Schröder FH, Hugosson J, Roobol MJ, et al. Screening and prostate cancer mortality: results of the European Randomised Study of Screening for Prostate Cancer (ERSPC) at 13 years of follow-up. The Lancet. 2014;384(9959):2027-2035. doi:10.1016/S0140-6736(14)60525-0.
and Prostate-specific Antigen Testing: New Insights from the European
Randomized Study of Screening for Prostate Cancer. European Urology. March 2015:1-6. doi:10.1016/j.eururo.2015.02.042.
28. Cooperberg MR, Carroll PR. Trends in Management for Patients With Localized Prostate Cancer, 1990-2013. JAMA. 2015;314(1):80-82.
doi:10.1001/jama.2015.6036.
Figures and Tables
Fig. 1. Respondent agreement with routine screening in men of different age groups.
Fig. 3. At what ago do you start/stop offering routine cancer screening in average-risk men?
Fig. 4. Respondents’ agreement with a shared-decision approach toscreening.
Table 1. Respondent demographics (n=1190)
No (%)
Small population centre (≤29,999 people)
Medium population centre (30,000 – 99,999 people) Large population centre (≥100,000 people)
Table 2a. Results of multinomial logistic regression, part 1
Men <55 years old should not be screened for prostate cancer with PSA
Men 55‒69 years old should not be screened for
prostate cancer with PSA
Men >70 years old should not be screened for prostate cancer with PSA
Disagree Agree Disagree Agree Disagree Agree
OR 95% CI OR 95% CI OR 95% CI OR 95% CI OR 95% CI OR 95% CI
Lower Upper Lower Upper Lower Upper Lower Upper Lower Upper Lower Upper
Read guidelines
(yes vs. no) 0.94 0.54 1.64 1.21 0.74 1.96 0.59 0.37 0.95 1.03 0.63 1.68 0.66 0.35 1.23 0.87 0.51 1.48 Academic
appointment
(yes vs. no) 1.20 0.75 1.93 2.07 1.39 3.09 0.67 0.46 0.98 1.12 0.78 1.60 0.97 0.58 1.61 1.95 1.30 2.92
Catchment area
Small Ref Ref Ref Ref Ref Ref
Medium 1.31 0.65 2.64 1.06 0.60 1.87 1.22 0.71 2.09 1.14 0.68 1.90 0.76 0.36 1.61 1.05 0.58 1.91
Large 1.57 0.89 2.77 0.98 0.62 1.55 1.18 0.76 1.83 1.06 0.70 1.61 0.80 0.44 1.44 0.87 0.54 1.40 Gender (female
vs. male) 0.63 0.39 1.03 0.81 0.54 1.22 0.74 0.50 1.08 0.67 0.46 0.96 0.89 0.53 1.50 1.09 0.72 1.64 Years in
practice
<5 Ref Ref Ref Ref Ref Ref
5 to 10 1.53 0.76 3.08 0.73 0.42 1.25 1.53 0.91 2.57 0.91 0.56 1.47 1.70 0.81 3.56 0.99 0.57 1.74
10 to 20 1.80 0.90 3.61 0.60 0.34 1.05 1.17 0.70 1.96 0.58 0.36 0.95 1.96 0.94 4.09 0.87 0.49 1.54
> 20 2.43 1.29 4.60 0.56 0.33 0.94 2.73 1.63 4.57 0.99 0.60 1.63 2.41 1.24 4.68 0.83 0.50 1.40
Province Maritime +
Odds of agreeing or disagreeing with guidelines statements, compared to giving a neutral response. Bold values are statistically significant (p<0.05). CI: confidence interval; OR: odds ratio; Ref: reference.
BC 1.17 0.47 2.95 0.86 0.39 1.91 1.01 0.49 2.05 1.02 0.50 2.08 0.77 0.26 2.29 0.41 0.16 1.05
Prairies 0.68 0.27 1.72 0.85 0.39 1.85 1.05 0.52 2.13 1.00 0.49 2.03 0.59 0.20 1.78 0.53 0.21 1.35
Bold values are statistically significant (p<0.05). CI; confidence interval; OR: odds ratio; Ref: reference.
Table 2b. Results of multinomial logistic regression, part 2
Odds of agreeing or disagreeing that the benefits of PSA screening in average-risk men outweigh the risks, compared to a neutral response
In average risk men (i.e., no risk factors for prostate cancer) the benefits of prostate cancer
screening outweigh the risks
Disagree Agree
OR 95% CI OR 95% CI
Lower Upper Lower Upper
Read guidelines (yes vs. no) 1.88 1.25 2.85 1.36 0.85 2.18 Academic appointment (yes
vs. no) 1.51 1.08 2.13 0.83 0.56 1.24
Catchment area
Small Ref Ref
Medium 0.93 0.57 1.52 0.87 0.48 1.56
Large 0.87 0.58 1.30 0.94 0.58 1.52
Gender (female vs. male) 1.37 0.97 1.94 0.84 0.55 1.29 Years in practice
< 5 Ref Ref
5 to 10 0.69 0.44 1.09 1.54 0.86 2.77 10 to 20 0.59 0.36 0.95 2.00 1.12 3.58
>20 1.04 0.65 1.65 3.55 2.03 6.19
Province
Maritime + territories Ref Ref
BC 0.99 0.50 1.96 0.93 0.44 1.96