Planetary wave o
s
cillation
s
in
s
poradic
E
layer occurrence at Wuhan
Xiaomin Zuo1,2,3,4and Weixing Wan1
1Institute of Geology and Geophysics, Chinese Academy of Sciences, Beijing, 100029, China 2Mathematics and Physics Department, China University of Geosciences, 430074, China
3Wuhan Institute of Physics and Mathematics, Chinese Academy of Sciences, China 4Graduate School, Chinese Academy of Sciences, China
(Received September 23, 2007; Revised November 26, 2007; Accepted January 7, 2008; Online published July 4, 2008)
Quasi 6-day oscillations in Es occurrence were observed to occur in relation with planetary wave activity at Wuhan, China (30.6◦N, 114.5◦E). Wavelet analysis ofEsoccurrence time series revealed that a strong 5- to 7-day oscillation was present during the period fromabout day 120 to 137 of 2003. The same quasi 6-day planetary wave oscillation was also found to dominate the spectrumof concurrent wind datameasured in the 80- to 100-km
region by ameteor radar, in agreement with theEsoccurrence. There is also a great deal of similarity between the 5- to 7-day band-pass filtered waveforms ofEsoccurrence and the wind data. By estimating the wave phase changes with altitude, the quasi 6-day PW in the zonal wind was found to be in phase with the sporadicElayer critical frequency, foEs, at about 115 km, close to the observedEsheight. The quasi 6-day PWmodulation was also present in the amplitude of the 12-h and 24-h periodicities which existed in the foEstime series. The present results provide new evidence in favor of a planetary wave indirect role onEsformation through themodulation of tides, which in line with previous studies by Haldoupis and Pancheva (2002), and Panchevaet al.(2003). Key words:SporadicElayers, planetary waves, atmospheric tides, PWmodulation of tides.
1.
Introduction
Midlatitude sporadicE(Es) layers, which are thin plasma layers of enhancedmetallic ion concentration that form fre-quently in themidlatitudeEregion ionosphere, have been a topic of intensive research for quite a long time (see review articles by Whitehead, 1989; Mathews, 1998). The form a-tion of the layers is explained by the wind shear theory (see Whitehead, 1961). On the other hand, several new results in the last decade suggest that the generation of sporadicE
is not yet fully understood. A possible link betweenEsand atmospheric planetary waves (PWs) has recently attracted considerable attention.
Planetary waves are global scale, quasi-periodic oscilla-tions in temperature, pressure, density and wind of the
at-mosphere, with typical periods in the range of about 2–20 days. They aremainly of tropospheric origin and can af-fect the atmospheric dynamics in the lower thermosphere between 80 and 150 km (see Forbes, 1994). Tsunodaet al. (1998) and Voiculescu et al.(1999) were the first to provide evidence for planetary wave effects onmidlatitide backscatter and the sporadicElayer occurrence.
Further-more, Voiculescuet al.(2000) analyzed measurements of
midlatitudeEregion coherent backscatter obtained during four summers with SESCAT (sporadicE SCATter
experi-ment), a 50-MHz Doppler radar systemoperating in Crete, Greece, concurrent ionosonde recordings from the same ionospheric volume obtained with a CADI (Canadian Ad-vanced Digital Ionosonde) for one of these summers and
Copyright cThe Society of Geomagnetismand Earth, Planetary and Space Sci-ences (SGEPSS); The Seismological Society of Japan; The Volcanological Society of Japan; The Geodetic Society of Japan; The Japanese Society for Planetary Sci-ences; TERRAPUB.
simultaneous neural wind data fromthemesopause region around 95 km,measured in Germany. The results suggested that planetary wave effect on sporadicEis a viable option, which introduces a new element into the physics ofm idlat-itudeEregion layering phenomena. A possiblemechanism
for the explanation of the PW effects on Eswas proposed by Shalimovet al.(1999). This was followed by a theo-reticalmodel (Shalimov and Haldoupis, 2002) postulating a direct role for the PWs onEsformation which relied on large-scale accumulation ofmetallic ions in themidlatitude
Eregion ionosphere driven by PW horizontal wind shears. The first direct experimental evidence in favor of a PW role on Es generation was provided by Haldoupis and Pancheva (2002). They analyzed foEsdata froma number of ionosonde stations covering a large longitudinal sector to find that a strong 7-day period oscillation inEswas closely related with a simultaneous 7-day PW present in them eso-sphere and lower thermosphere (MLT region) winds, which was detected withmeteor radars and fromspace with satel-lites. Panchevaet al.(2003) took this work a step further to show that the effects of PW onEswere indirect through the PWmodulation of the diurnal and semidiurnal tides in the MLT region.
The eight ionosonde stationsmentioned in the paper of Haldoupis and Pancheva (2002) were all located in the Eu-ropean and North American sectors. It is therefore useful to investigate a similar data set obtained in the Asia sec-tor which is subject to the “Far East Anomaly” (e.g., Smith, 1957). Also, in the work of Panchevaet al.(2003), the anal-ysis was based on concurrent mesospheric neutral winds and ionosonde foEsdata fromnearby, but different, loca-tions. We have studied the same problemas Panchevaet
al.(2003) did, we have used a complete data set in which all (ionosonde foEs and MLT wind)measurements were done at the same exactly location, that is, at Wuhan, China (30.6◦N, 114.5◦E). We believe this co-location of all
instru-mentation will certainly bemore advantageous for this kind of correlative studies.
The present paper is organized as follows: the planetary wave periodicities inEsoccurrence at Wuhan are presented in Section 2, followed by the analysis of wind m
easure-ments in Section 3. Detailed comparisons of the quasi 6-day periodicities found inEsand the wind data aremade in Section 4, which is followed by a summary and discussion in Section 5.
2.
Planetary Wave Periodicitie
s
in
EsOccurrence
at Wuhan
We first obtained the daily occurrence of Es layers (for cases when foEs > 5 MHz) at Wuhan, and then Fourier analyzed the time series for the period fromday 120 to 260 of 2002 in order to compute the corresponding spectrum. Note that small data gaps were filled by using a common cubic interpolationmethod. Figure 1 displays the time se-quences of Es occurrence in the top panel and the corre-sponding Fourier power spectrumin the bottompanel. It shows a pronounced daily variability inEsoccurrence with periods ranging fromtwo to several days, as evidenced from
the normalized Fourier power spectrumin the bottompanel. The spectrumshows two dominant periods at about 7 and 15 days, respectively, which are common prevailing period-icities in the planetary wave band.
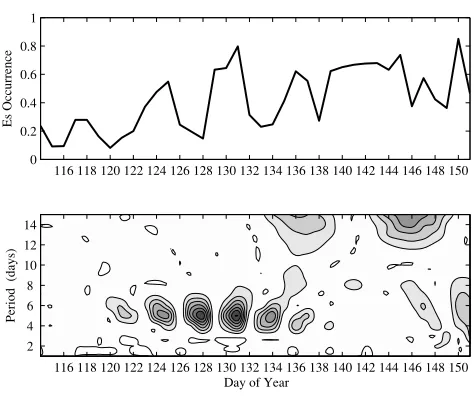
To reduce data gaps, which are due to the absence of the layers at times, dailyEsoccurrences was selected fromday 114 to 151 of 2003, whenEsoccurrence was fairly contin-uous. Continuous Morlet wavelet analysis was applied to the time series ofEs occurrence. The waveletmethod has become a favored tool in geophysics for analyzing non sta-tionary time series. By decomposing the time series into the time-period space, the wavelet analysis transformcan de-termine both the dominant periodicities and their dynamic change (e.g., Torrence and Compo, 1998). As shown in Fig. 2, in the period time spectrogramseen in the bottom
panel, a quasi 6-day (5–7 day) oscillation dominates the spectrumfor the time interval fromabout day 120 to 137.
To investigate if the long-termperiodicity owes its pres-ence to geomagnetic activity, the time series of the daily averaged Kp and Ap index corresponding to the same time intervals were analyzed as well. The quasi 6-day oscilla-tion under consideraoscilla-tion did not occur in the Kp and Ap spectrograms (not show here). In addition, poor correla-tion between Es occurrence and geomagnetic activity was found. The computed correlation coefficients of Es occur-rence with Kp and Ap were equal to−0.16 and−0.08, re-spectively. The lack of correlation betweenEsand geom ag-netic activity is a well-known fact (see Whitehead, 1989), whereas its absence has also been verified in previous
PW-Esstudies by Voiculescu et al.(2000) and Haldoupis and Pancheva (2002).
120 130 140 150 160 170 180 190 200 210 220 230 240 250 260
0
Fig. 1. Time sequence ofEsoccurrence and the corresponding Fourier power spectrumfor the time interval fromday 120 to 260 of 2002 at Wuhan.
116 118 120 122 124 126 128 130 132 134 136 138 140 142 144 146 148 150 0
116 118 120 122 124 126 128 130 132 134 136 138 140 142 144 146 148 150 2
Fig. 2. Time sequence ofEsoccurrence and the corresponding wavelet spectrogramfor the time interval fromday 114 to 151 of 2003 at Wuhan.
3.
Qua
s
i 6-day Period Variation
s
in MLT Wind
s
at Wuhan
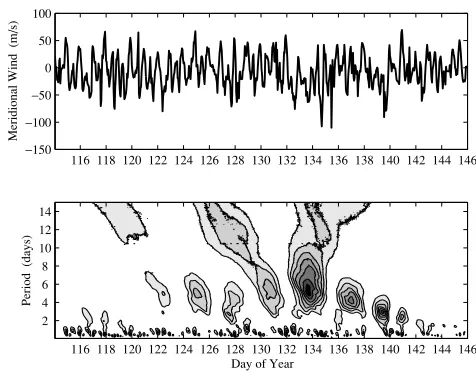
116 118 120 122 124 126 128 130 132 134 136 138 140 142 144 146
116 118 120 122 124 126 128 130 132 134 136 138 140 142 144 146 2
Fig. 3. Time sequence of hourly zonal wind at an altitude of 94 kmand the corresponding wavelet spectrogramfor the time interval fromday 114 to 145 of 2003 at Wuhan.
116 118 120 122 124 126 128 130 132 134 136 138 140 142 144 146 0
116 118 120 122 124 126 128 130 132 134 136 138 140 142 144 146 2
and the data analysismethodology are described by Xiong
et al.(2004).
Although the quasi 6-day planetary wave oscillation is present in the wind data in the entire 80- to 100-kmaltitude range, here we select and show the observations at 94 km. Continuous time series wavelet analysis was performed on hourlymean wind speeds during the period fromday 114 to 145 of year 2003. The analysis results of zonal and
meridional wind are shown in Figs. 3 and 4, respectively, displaying in the upper panel the time series and in the lower panels the period versus time spectrograms. As seen, a dominant quasi 6-day period oscillation occurred on day 115 and persisted about 15 days in the zonal wind. Note that this appeared somewhat ahead of the oscillation present inEs occurrence. A 6-day periodicity was also present in themeridional wind fromday 124 to 138, being coincident with the quasi 6-day oscillation in the Es occurrence. It is interesting to note that concomitant to the 6-day event, around day 139, a 3-day periodicity in themeridional wind was also present.
4.
Compari
s
on of Qua
s
i 6-day Wave
s
in
Esand
Wind Data
In order to investigate the amplitude of the oscillations in both theEsoccurrence and the winds inmore detail, a five-order Butterworth band-pass filter—as applied by Xionget al. (2006)—was used which was centered on 6 days with a full width of 3 days. The band-pass filter analysis was performed on the time series of daily Es occurrence and dailymean wind speeds covering the altitude range from84 to 100 km, with a 4-kminterval, for the period fromday 100 to 200 of 2003.
As shown in Fig. 5, theEsoccurrencemanifests a strong quasi 6-day periodicity from day 115 to 135, with the strongest peak located around day 125, while the gap seen in the figure is due to data losses. For comparison with the Esoccurrence, the band pass filtered waveforms of the zonal and themeridional component are shown in Figs. 6 and 7, respectively. The different altitudes are denoted as follows:h =84 km, with thick solid line;h =88 km, the thick dotted line; h = 92 km, the thick dash-dotted line;
h =96 km, the thin solid line;h =100 km, with thin solid line and dots. As seen, themaximumamplitude of the zonal wind oscillation occurred at the altitude of 92 km, reaching about 18m/s and lasting for two to three cycles fromday 120 to 140. The waveforms at other altitudes displayed their largest amplitudes during the period fromday 120 to 140 as well, but these were weaker than those seen at 92 km. Re-garding the oscillation in themeridional wind, the largest amplitude occurred between day 120 and about day 140, with values nearing 13m/s. The present results show that the quasi 6-day band-pass-filtered Es occurrence has the same character with that of the neutral wind, whichmeans that a common oscillation with a period inside the PW band is present simultaneously in both the winds and the sporadic
Elayer occurrence. This is in agreement with the August– September 1993 event studied by Haldoupis and Pancheva (2002).
Further, the time series ofmean hourly wind speeds for the period from day 120 to 140 of year 2003, when the quasi 6-day PW activity was strongest, were analyzed by applying a least-square fitting algorithm (see Hocking et al., 2001 for more details) to estimate the phase changes of the quasi 6-day PW for all altitudes from84 to 100 km
(every 2 km). Figure 8 summarizes the phase variation with altitude of the quasi 6-day PW in the zonal (left panel) and
meridional wind (right panel), showing a phase decrease with increasing altitude in both components because of the downward phase propagation of the PW. The wave phase propagated vertically downward with amean altitude rate of about 2–3 h/km.
Further, we also worked out the phase of the quasi 6-day periodicity in foEs by analyzing the time series of hourly
105 110 115 120 125 130 135 140 145 150 155 160 165 170 175 180 185 190 195 200 0
0.05 0.1 0.15 0.2
Day of Year
Filtered Es Occurrence
Fig. 5. The quasi 6-day band-pass-filtered dailyEsoccurrence time series for the period fromday 100 to 200 of 2003 at Wuhan.
105 110 115 120 125 130 135 140 145 150 155 160 165 170 175 180 185 190 195 200 0
5 10 15 20
Day of Year
Filtered zonal wind (
m
/s)
Fig. 6. The quasi 6-day band-pass-filtered dailymean zonal windmeasured at five different altitude levels between 84 and 100 kmfor the period from
day 114 to 200 of 2003 at Wuhan with a data gap fromday 100 to 113. The different altitudes are denoted as follows: thick solid line,h=84 km; thick dotted line,h=88 km; thick dash-dotted line,h=92 km; thin solid line,h=96 km; thin solid line and dots,h=100 km.
105 110 115 120 125 130 135 140 145 150 155 160 165 170 175 180 185 190 195 200 0
5 10 15
Day of Year
Filtered
m
eridional wind (
m
/s)
Fig. 7. Same as in Fig. 6 but for themeridional wind.
120 km(Pancheva et al., 2003; Haldoupis et al., 2004). Since themean height ofEsfor the period fromday 120 to 140 of the year 2003 is estimated fromthe ionosonde data to be at about 111 km, the phase agreementmentioned above is fairly good. Although the agreement does not necessarily imply a direct effect of PW on Es because the estimated results were rough and based on given premise, a direct PW role cannot apparently be excluded andmight be at work just as the new mechanism proposed by Shalimov et al.
(1999), which have been outlined in Section 1. However, in the present paper we hypothesized that PWs play an indirect role and then tested this hypothesis by using the
methodology of Panchevaet al.(2003).
Given that atmospheric tidal winds play a fundamental
role on Es formation, it was postulated that a PW affects
0 10 20 30 40
Fig. 8. The quasi 6-day wave phases for all altitudes of the zonal wind (left) and themeridional wind (right) for the period fromday 120 to 140 of year 2003 at Wuhan.
Period (days)
A12
120 122 124 126 128 130 132 134 136 138 5
120 122 124 126 128 130 132 134 136 138 5
10 15
Fig. 9. Wavelet spectrograms for the amplitudes of the 12-h (top) and 24-h (bottom) periodicities infoEsduring the period fromday 120 to 140 of 2003 at Wuhan.
6-daymodulations are clearly present at both periodicities. As it is known, the semidiurnal and diurnal periodicities are imprinted on Es layers because the layer occurrence and strength are controlled mostly by the semidiurnal and di-urnal tidal waves in the altitude range from90 to 160 km
(see Mathews, 1998; and a recent study by Haldoupis et al., 2006). The present result provides strong reassuring evidence in favor of an indirect PW role on Es formation through the modulation of atmospheric tides, which is in full agreement with the findings of Panchevaet al.(2003).
5.
Summary and Concluding Comment
s
We report here the first evidence in the Wuhan ionosonde and MLT neutral wind observations on the existence of a relationship between planetary wave oscillations and vari-ations in sporadicElayer occurrence. Here the character-istics of the long-termperiodicities in Es occurrence were
studied to identify the prevailing periods and the duration of the dominant periodicities. Further, for the first time a direct comparison was attempted between the periodicities in Es occurrence and simultaneous neutral winds, bothmeasured at the same location (Wuhan). The wavelet spectrograms of both data sequences showed a very good agreement of the periodicities present concurrently inEsoccurrence and the MLT winds. Comparison of the 5- to 7-day band-pass filtered outputs of Es occurrence and the wind data also show a good analogy. By investigating the phase changes with time of the quasi 6-day PW for all altitudes from84 to 100 km, the quasi 6-day PW in the zonal wind was found to be in phase withEsat about 115 km, an altitude that is near the observedmeanEsheight of 111 km. We also found both the 12- and 24-h periodicities in the foEstime series to un-dergo a strong quasi-6 daymodulation. The present results reinforce the postulation that the reported PW effects onEs are basically induced indirectly through tidalmodulations.
Relying on our findings we can infer that the periodic-ities in Es occurrence are likely due to large-scale plan-etary waves, which are known to exist in the midlatitude
mesosphere and lower thermosphere (see Forbes, 1994). The present results providemore evidence that PW play an important role in the formation ofmid-latitude sporadicE
layers and support the findings of Haldoupis and Pancheva (2002), Panchevaet al.(2003), and Haldoupiset al.(2004). Also, the present findings favor an indirect PW role onEs through a nonlinear process of PWmodulation of the tidal wind amplitudes. The details of thismechanismneed fur-ther study, in the framework of the wind shear theory, in order to be better clarified and understood. In addition, it is necessary to consider new driving forces in relation with PWs and their climatology are necessary in order to explain the Es variability characteristics, such as, for example, the
Es annual occurrence. The thorough investigation of the PW physics on sporadicElayer formation and strength is an important task which hopefully will be undertaken in a future study.
Acknowledgments. This work was supported by the KIP Pilot Project (kzcx2-yw-123) of the Chinese Academy of Sciences, Na-tional Important Basic Research Project (2006CB806306) and Na-tional Natural Science Foundation of China (40636032).
References
Forbes, J. M., Tidal and planetary waves, inThe Upper Mesosphere and Lower Thermosphere: A Review of Experiment and Theory, edited by R. M. Johnson and T. L. Killeen, 67 pp, AGU, Washington, D.C., 1994. Haldoupis, C. and D. Pancheva, Planetary waves andmidlatitude sporadic
Elayers: Strong experimental evidence for a close relationship,J. Geo-phys. Res.,107(A6), 1078, doi:10.1029/2001JA000212, 2002. Haldoupis, C., D. Pancheva, and N. J. Mitchell, A study of tidal and
planetary wave periodicities present inmidlatitude sporadicElayers,
J. Geophys. Res.,109, A02302, doi:10.1029/2003JA010253, 2004. Haldoupis, C., C. Meek, N. Christakis, D. Pancheva, and A. Bourdillon,
IonogramHeight-Time-Intensity observations of descending sporadicE
layers,J. Atmos. Solar-Terr. Phys.,68, 539–557, 2006.
Hocking, W. K., B. Fuller, and B. Vandepeer, Real-time determination of
meteor related parameters utilizingmodern digital technology,J. Atmos. Solar-Terr. Phys.,63, 155–169, 2001.
Holdsworth, D. A., I. M. Reid, and M. A. Cervera, Buckland Park all-sky interferometricmeteor radar,Radio Sci.,39, RS5009, doi:10. 1029/2003RS003014, 2004.
Pancheva, D., C. Haldoupis, C. E. Meek, A. H. Manson, and N. J. Mitchell, Evidence of a role formodulated atmospheric tides in the dependence of sporadicElayers on planetary waves,J. Geophys. Res.,108(A5),1176, doi:10.1029/2002JA009788, 2003.
Shalimov, S. and C. Haldoupis, Amodel ofmid-latitude E-region plasma convergence inside a planetary wave cyclonic vortex,Ann. Geophys., 20, 1193–1201, 2002.
Shalimov, S., C. Haldoupis, M. Voiculescu, and K. Schlegel, Midlatitude E region plasma accumulation driven by planetary wave horizontal wind shears,J. Geophys. Res.,104, 28207–28213, 1999.
Smith, E. K., Worldwide occurrence of sporadicE, NBS Circular 582, U.S. Govt. Printing Office, Washington, D.C., 1957.
Torrence, C. and G. Compo, A practical guide to wavelet analysis,Bull. Am. Meteorol. Soc.,79, 61–78, 1998.
Tsunoda, R. T., M. Yamamoto, K. Igarashi, K. Hocke, and S. Fukao, Quasi-periodic radar echoes from midlatitude sporadicEand role of the 5-day planetary wave,Geophys. Res. Lett.,25, 951–954, 1998.
Voiculescu, M., C. Haldoupis, and K. Schlegel, Evidence for planetary wave effects onmidlatitude backscatter and sporadicElayer
occur-rence,Geophys. Res. Lett.,26, 1105–1108, 1999.
Voiculescu, M., C. Haldoupis, D. Pancheva, M. Ignat, K. Schlegel, and S. Shalimov, More evidence for a planetary wave link withmidlatitude E region coherent backscatter and sporadicElayers,Ann. Geophys.,18, 1182–1196, 2000.
Xiong, J. G., W. Wan, B. Ning, and L. Liu, First results of the tidal structure in the MLT revealed by Wuhan Meteor Radar (30◦40N, 114◦30E),J. Atmos.-Terr. Phys.,66, 675–682, 2004.
Xiong, J., W. Wan, B. Ning, L. Liu, and Y. Gao, Planetary wave-type oscillations in the ionosphere and their relationship to m eso-spheric/lower thermospheric and geomagnetic disturbances at Wuhan (30.6◦N, 114.5◦E),J. Atmos.-Terr. Phys.,68, 498–508, 2006. Whitehead, J. D., The formation of the sporadic-E layer in the temperate
zones,J. Atmos.-Terr. Phys.,20, 49–58, 1961.
Whitehead, J. D., Recent work onmid-latitude and equatorial sporadic E,
J. Atmos.-Terr. Phys.,51, 401–424, 1989.