CSEIT16128 | Received: 01 October 2016 | Accepted: 09 October 2016 | September-October-2016 [(2)5: 57-64]
International Journal of Scientific Research in Computer Science, Engineering and Information Technology © 2016IJSRCSEIT | Volume 1 | Issue 2 | ISSN : 2456-3307
57
Assessment of Groundwater Recharge Potential in the
Northern Parts of Auchi and Environs, Edo State, Nigeria, Using
Geospatial Techniques
Benibo Tekena
1*, Abayomi Alaga
1, Henry U. Okeke
1, Ebikare I . Benibo
2,
Kappo Ayorinde
1 1Cooperative Information Network, National Space Research and Development Agency, O.A.U, Ile-Ife, Osun State, Nigeria
2
National Center for Remote Sensing, Jos, Nigeria
ABSTRACT
Groundwater accounts for about 30% of earth’s freshwater, the demand for this natural resource is
increasing due to rapid industrialization and population growth, leading to its scarcity in some regions,
Auchi is an area experiencing groundwater stress, were water table depth decreases rapidly and
boreholes have to be drilled to great depths to get this scarce resource. The replenishment of this
resource to a groundwater flow system is groundwater recharge.
The study aims to delineate groundwater recharge potential zones of the northern part of Edo state
comprising of Auchi and sorrounding communities, utilizing remote sensing, geospatial techniques and
weighted index overlay analysis model. Six multi-influencing factors of lithology, soil cover, lineament
density, drainage density, land use and land cover and slope were all generated from Landsat ETM,
topographic map and shuttle radar topographic mission (SRTM) data, producing the various thematic
layers. The multi-layers were then reclassed and weighed according to their varying influence to
groundwater recharge.
The resultant groundwater recharge potential map revealed that majority of the study area, comprised
partly of the hilly terrain of the north eastern and north western part and the gentle slope regions had
moderate recharge, while parts of the south eastern and south western part of Auchi had low
groundwater recharge. This research could serve as a base line study for future groundwater studies in
the area.
Keywords :
Groundwater Recharge, Remote Sensing, Weighted overlay, Geospatial.
I.
INTRODUCTION
Water is one of the most important natural
resource for the sustenance of life, the availability
of water supply in terms of quantity and quality is
essential to human existence. The distribution of
water on earth is highly unbalanced with 97.41%
confined in world oceans, the remaining 2.5 % is
locked up in glaciers (1.953%) and beneath the
surface as groundwater (0.614%) and 0.015% for
lakes and rivers [11].
integral part in many of the water management
approaches, especially for rural areas [20], this is
because it represents the largest available source
of fresh water lying beneath the ground.
Basically ―Ground-water recharge‖ is the the
replenishment of water to a ground-water flow
system [30]. Most water recharging the
groundwater system moves relatively rapidly to
surface-water bodies and sustains stream flow,
lake levels, and wetlands. Over the long term,
recharge is generally balanced by discharge to
surface waters, to plants, and to deeper parts of the
ground-water system. However, this balance can
be altered locally as a result of pumping,
impervious surfaces, land use, or climate changes
that could result in increased or decreased
recharge, It has become crucial to monitor,
conserve this important resource also identify and
delineate areas of potential groundwater recharge
and its availability in order to sustain groundwater
system and avoid their depletion.
Groundwater table depletion occurs whenever
pumping rates are higher than the rate of
replenishment. Hence, areas with excessive
groundwater withdrawal rates experience a
significant volume decrease in the groundwater
reservoirs. This can cause depletion of water levels
in wells, streams and lakes, deterioration of water
quality, land subsidence and higher pumping costs
[25] ,[29]
Auchi an area located in the northern part of Edo
state Nigeria and some surrounding communities,
in the region tend to experience water stress, and
difficulty in accessing groundwater especially
during the dry season were communities
experience drying up of dug wells. For this reason,
boreholes have to be drilled to great depths of
approximately 250m -300m and sometimes above
to get this scarce and essential resource. In Ikpeshi
a community in Akoko-Edo, studies have shown
that over the last few years, out of the total
monitoring wells, 55% experienced depletion in
water table depth especially during the dry season
Leading to the associated problem of lowering
tube well depth and drying of open dug wells in
these areas. [7]
As a result of the decrease in this important natural
resource,
remote
sensing
and
geographic
information system (GIS) techniques have been
employed in this research study to delineate
prospective groundwater potential zones.
Geospatial
technologies
have
become
an
important tool in water studies due to their
capability
in
developing
spatio-temporal
information and effectiveness in spatial data
analysis and prediction [5], [16], [26]. Various
studies have been carried out throughout the world
to identify the groundwater recharge potential
zones by employing remote sensing and GIS
techniques [10], [21], [22], [24] [28], [32], [19].
Most of these studies were based on
knowledge-driven factor analysis, integrating different
thematic layers such as land cover/land use,
geology, lineaments, drainage density, slope, soil
permeability with GIS techniques. Satellite remote
sensing and image processing techniques were
often employed in these studies for the preparation
of necessary thematic layers. In addition, existing
maps, data bases, aerial photographs and field data
collection have been commonly used in factor
layer preparation, Which when incorporated
together can aid in identifying groundwater
recharge zones.
STUDY AREA
The study area is in Auchi, Edo state Nigeria, it is located at the Northern part of Edo state, and lies between latitude 7’30’0‖N and 7’00’00‖N, Longitudes 6’00’00‖E and 6’30’00‖E , Figure 1a,1b. The research area comprises of Six (6) local government with major towns namely Auchi, Ososo, Ibillo, Igarra, Ikpeshi, Uzanu, Ogonmeri and Ebule.
during which rainfall is low to medium, the dry season starts in November and ends in March.
The relief is influenced by the underlying geology, it is characterized by rocky mountainous highlands mostly at northern fringes mainly the tall ranking older granites and low lying lands towards the southern part of the study area.
Vegetation in the area is typically guinea savannah grassland and lush vegetation of tall trees, shrubs and grasses.
Figure 1a: Showing the Study Area
Figure 1b: Satellite image of the study area
II.
METHODS AND MATERIAL
GIS techniques was employed in this study to delineate the groundwater recharge potential of the northern part of Edo state using remote sensing data and integration of multi influencing factors (MIF) of lithology, lineament density, slope, soil cover, drainage density and land use land cover.
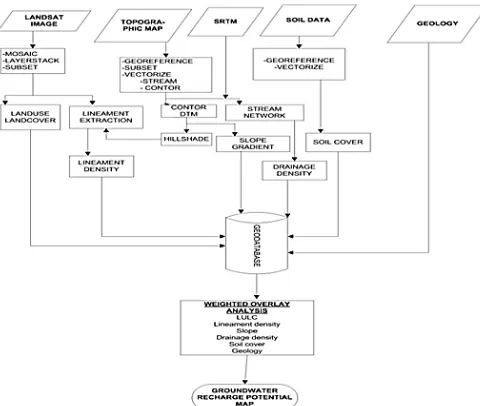
The methodology for this study to delineate suitable sites for groundwater recharging has been illustrated in figure 2.
Figure 2 : Showing flow chart methodology of the
research
Data acquired for the study namely geology map, from Nigerian geological survey at a scale of 1: 500,000, soil map and the topographic sheet were scanned, geo-rectified and vectorized to extract the corresponding lithology, soil cover, settlement and drainage of the area, the Landsat image of the area was pre-processed in Envi 4.7 by layerstacking, mosaicing and subsetted to enable classification of land use land cover classes using false color composite (FCC) band combination of 4,3,2 also the satellite image was used for the extraction of lineaments from band combination 7,5,3. Shuttle Radar Topographic Mission (SRTM) with a resolution of 30m was downloaded from glovis earth explorer, the SRTM data was subjected to analysis in ArcGIS 10.3 to generate hill shade of the area, the slope of the region and also the drainage.
All the MIF were then converted to raster and subsequently reclassed in order of suitability to groundwater recharge.
[31], [12], [14] employed similar method of MIF and remote sensing for groundwater studies.
III.
RESULTS
Establishment of the six (6) groundwater recharge potential-related factors for the research study are discussed.
underlain by coarse grained granite, meta conglomerate biotite, porphyroblastic gneiss, migmatite gneiss, schists and the unique sedimentary formation occurring in the southern part, made up of clayshale with limestone, sandstone coal , shale mustone and lignite claystone, this could be as a result of weathering of the basement rocks found on the northern hilly region and the gentle slope downward towards the south eastern and southwestern part of the area, Figure 3 showing the geomorphology
Figure 3 : Geomorphology of the area
[22] pointed out that the type of rock exposed to the surface signicantly affects groundwater recharge. Lithology affects the groundwater recharge by controlling the percolation of water [3].
Zones with less compaction, and with a higher degree of weathering and fracturing facilitate infiltration of the runoff, and hence are more suitable for groundwater recharging (Krishnamurthy et al., 2000). Hence lithology was assigned a weight and the various rock types were grouped based on similar geology and then ranked considering the permeability, porosity, textural properties, weathered/fractured zone formation and groundwater yield potential of different rock/aquifer material [6] , [1].
The lithology types was then subsequently reclassed based on potential for groundwater recharge.
Figure 4 : Showing the Lithologic Map of Auchi and
environs.
The Land use/ Land cover is an important factor in groundwater recharge. This is because the land use pattern of any terrain is a reflection of the complex physical processes acting upon the surface of the earth. The land use and land cover of the area provides important indications of the extent of groundwater requirement and utilization [17], It includes the type of Land use caused by man’s physical activity, which include built up areas, bare surface, cultivated lands, etc and the natural vegetative Land cover of the area. The various classes interpreted and identified were built up, water body, cultivated land, shrub land, forest vegetation and rock outcrop Figure 5,this various land use classes were then reclassed in ArcGIS based on there characteristics to infiltrate water into the ground, generally rock outcrop are found to be least suitable for infiltration while the cultivated land, shrubland, vegetation, sand deposit were assigned reclass values based on their varying suitability to recharge and groundwater infiltration.
Lineaments are structurally controlled linear or curvilinear features, which expresses the topography of underlying structural features and tonal alignments visible on satellite image due to its synoptic view. They represent fractured zones on geological structure of an area such as, fault and dykes and they can control the movement of water between surface and subsurface. Previous studies have revealed a close relationship between lineaments and groundwater flow and yield [13], [4].
Lineaments were extracted from satellite image using band combination 7,5,3 figure 6a also in order to further enhance the extraction, lineaments were also identified from hillshade generated from SRTM at an illumination angle of 45o figure 6b,a total of 387 lineaments were identified.
Figure 6a: Lineament density of the area
Figure 6b: Lineament overlain on Hillshade
The lineament density map was produced in ArcGIS and based on the lineament density generated, lineaments were concentrated more in the northwest of Ososo and northeastern part of Ibillo, but with little or no lineation towards the southwest and southeastern region of the study area comprising of Auchi and Ebule, this shows that the basement complex rocks experience more faulting and fracturing when
compared with the sedimentary formation, and such lineated areas have high groundwater potential prospects.
The drainage density is the total length of streams divided by the total area of a basin. It is a measurement of the infiltration rate of water into watershed and deals with the relationship between surface runoff and permeability. The quality of a drainage network depends on lithology, which provides an important index of the percolation rate. Figure 7 Many studies have integrated lineaments and drainage maps to infer the groundwater recharge potential zone [2] ,[22] drainage of the study area was extracted from topographic map and SRTM image to generate drainage density thematic map which was then reclassed into 5 classes. Higher drainage density is related to increase infiltration and groundwater recharge and vice versa.
Figure 7: Drainage density of the study area
Figure 8: Slope of the study area
Soil cover is one of the significant control factors to determine the infiltration rate of an area. the various soil types of the area are the acrisols, gleysols, nitisols, and lixisols.
Based on research findings, the various soil types were categorizedbased on their parent material and their hydrological characteristics, with the lixisols and leptosols found to have poor groundwater retention capacities, while the acrisols, nitisols and gleysols soil types have moderate to suitable groundwater permeability and retention properties respectively. The various soils were then reclassed based on their influence on groundwater recharge
Figure 9: Soil map of the study area
IV.
DISCUSSION And CONCLUSION
All the various multi influencing factors (MIF) analysed, and there thematic layers comprising of lithology, soil and Landuse land cover were categorized based on there subfactors and then reclassed and converted into raster format while the automatically generated raster based actors comprising of slope, lineament density, drainage density were also
reclassed based on their influence to groundwater recharge, all in raster format.
Reclassed values ranged from 1 to 5 with 1 having the least influence on groundwater recharge and 5 with the most influence, this was done by researchers judgement and information gotten from previous research work carried out on groundwater studies.
All the 6 thematic layer were then subjected to the weighted index overlay analysis (WIOA) using multi-criteria approach, the combined reclassed thematic layers of the individual MIF was used to identify groundwater potential recharge zones of the study area. The WIOA is one of the most accepted methods for assigning weights and relative ranks based on the multi-criteria evaluation for decision making [17], [18] [16],[8], [27],[9]. It is a technique that applies a common measurement scale of values to diverse and dissimilar inputs to create an integrated analysis using multicriteria approach, this analysis according to [15] has no standard scale, but incorporates human judgment for its efficiency.
For this study each of the thematic maps was assigned a weight that represents its importance in respect groundwater recharge based on criteria of previous work [31], [12], [14]
Integrated influential factor layers using weighted overlay method on a GIS platform has been often employed in delineating artificial recharge potential zones by various researchers such as [22] , [32] and [26], [10] used weigthed aggregation method to integrate different thematic layers in order to demarcate groundwater recharge potential zones in hard rock terrain.
Figure 10 : Showing the groundwater recharge of the study area
V.
ACKNOWLEDGEMENT
The authors are grateful for the support received for the case studies. Funding for the research was provided by the National Space Research and Development Agency (NASRDA), while the Nigerian Geological Survey, Advanced Space Application Laboratory, Glovis earth explorer is acknowledged for providing assistance with data acquisition and satellite imagery. Also Mr Kappo Ayorinde and Mr Oche Christopher for there valuable professional criticism and editing advice.
VI.REFERENCES
[1] Danskin, W.R., (1998) Evaluation of the
Hydrologic system and selected water
Management alternatives in the Owens Valley, California: USGS Water-Supply paper 2370, 175p
[2] Edet, A.E., Okereke C.S., Teme S.C., and Esu, E.O. 1998. Application of remote sensing data to groundwater exploration: a case study of the Cross River State, southeastern Nigeria. Hydrogeol J 6:394–404 groundwater production capacity of fractured zones: a case study in Sao Paulo, Brazil. Hydogeol Journal. 9: 151-167
[5] Ghayoumian, J., Saravi, M.M., Feiznia, S., Nouri, B., and Malekian, A., 2007.Application ofGIS techniques to determine areas most
suitable for articial groundwaterrecharge in a coastal aquifer in southern Iran. Journal of Asian Earth Sciences30, 364e374
[6] Heath, R.C. 1983. Basic Groundwater hydrology. USGS water supply Paper 2220: 84p. Denver, C.O.
[7] Irukpen, 2009: Water Conservation in Edo State, Edo State Ministry of Water Resources Quarterly Report.
[8] Javed , A and Wani, M.H. (2009) . Delineation of groundwater potential zone in Kakund watershed, Eastern Rajasthan, using remote sensing and GIS techniques. Jour. Geol. Soc. India 73, Pp229-236.
[9] Jha, M.K., Chowdary, V.M., and Chowdhury, A. 2010. Groundwater Assessment in Salboni Block, West Bengal (India) Using remote sensing and geographic information system and multi criteria decision analysis techniques. Hydrogeology Journal 18:1713-1728.
[10] Krishnamurthy, J., Mani, A., Jayaraman, V., and Manivel, M. 2000. Groundwater resources development in hard rock terraineAn approach using remote sensing and GIS techniques. International Journal of Applied Earth Observation and Geoinformation 2 (3e4), 204e215.
[11] Lean, G., and Hinrichsen, D. 1990. Atlas of the environment. New York, prentice hall press. [12] Magesh, N., Chandrasekar, N., and John, P.
(2012). Delineation of Groundwater Potential Zones in Theni district, Tamil Nadu, Using Remote Sensing, GIS and MIF techniques. Journal ofgeosciences frontiers. 3(2) Pp189-196. [13] Magowe, M., and Carr, J.R. 1999. Relationship between lineaments and groundwater occurrence in Western Botswana, Ground Water, 37 (2). 282-286.
[14] Manikandan, J., Kiruthika, A.M., and
Sureshbabu, S. 2014. Evaluation of
groundwaterpotential zones in Krishnagiri district , Tmil Nadu Using MIF Technique. International journal of innovative Research in Science, Engineering and Technology. Vol3(3), 10524- 10534
[16] Nagarajan, M., and Singh, S.2009. Assessment of groundwater potential zones usingGIS technique. Journal of the Indian Society of Andhra Pradesh, Journal Geological Society of India 81:248-260.
[18] Pratap, K., Ravindran, K.V., and Prabakaran, B. 2000. Groundwater prospect zoning using remote sensing and geographical information system: A case study in Dala-Renukoot Area, Sonbhadra District Uttar Pradesh. Journal of the Indian Society and Remote Sensing 28(4): 249-26 [19] Riad, P.H., Billib, M., Hassan, A.A., Salam,
M.A., and El Din, M.N. 2011. Application of the overlay weighted model and Boolean logic to determine the best locations for articial recharge
of groundwater. Journal of Urban and
Environmental Engineering 5 (2), 57e66.
[20] Senanayake, I.P., Dissanayake, D.M.D.O.K., Mayadunna, B.B., and Weerasekera W.L.2016. An approach to delineate groundwater recharge potential sites in Ambalantota, Sri Lanka using GIS techniques. Journal of Geosciences frontier 7 (2016) 115-125 p
[21] Sener, E., Davraz, A., and Ozcelik, M. 2005. An integration of GIS and remote sensing in groundwater investigations: a case study in Burdur, Turkey. HydrogeologyJournal 13 (5e6), 826e834.
[22] Shaban, A., Khawlie, M., and Abdallah, C.2006. Use of remote sensing and GIS todetermine recharge potential zones: the case of Occidental Lebanon. HydrogeologyJournal 14 (4), 433e443. [23] Shiklomanov, I. 1993. World fresh water
resources. In: Gleick, P.H. (Ed.), Water in Crisis: A Guide to the World’s Fresh Water Resources. Oxford University Press, New York.
[24] Solomon, S., and Quiel, F.2006. Groundwater study using remote sensing and geographic information systems (GIS) in the central highlands of Eritrea. Hydrogeology Journal 14 (6), 1029e1041.
[25] Sophocleous, M. 2002. Interactions between groundwater and surface water: the state of the science. Hydrogeology Journal 10 (1), 52e67.
[26] Subagunasekar, M., and Sashikkumar, M.C. 2012. GIS for the assessment of the groundwater recharge potential zone in Karunkulam block, Thoothukudi district, Tamil Nadu, India. International Journal of Current Science 159e162.
[27] Subba, R.N.(2009). A numerical scheme for groundwater development in a watershed basin of basement terrain: a case study from India. Hydrogeology Journal 17:379-396.
[28] Tweed, S.O., Leblanc, M., Webb, J.A., and Lubczynski, M.W. 2007. Remote sensing andGIS for mapping groundwater recharge and discharge areas in salinity pronecatchments, southeastern Australia. Hydrogeology Journal 15 (1), 75e96.
[29] Wada, Y., van Beek, L.P., van Kempen, C.M., Reckman, J.W., Vasak, S., and Bierkens, M.F.2010. Global depletion of groundwater resources. Geophysical Research Letters37 (20), L20402.
[30] Winter, T.C., Harvey, J.W., Franke, O.L., and Alley, W.M. 1998.Ground Water and surface water—a single resource: U.S. Geological Survey Circular 1139, 79p.
[31] Yeh, H.-F., Lee, C.-H., Hsu, K.-C and Chang, P.-H. 2008. GIS for the assessment of the groundwater recharge potential zone. Environ Geol 58: 185-195.
[32] Yeh, H.F., Lee, C.H., Hsu , K.C., and Chang, P.H., 2009. GIS for the assessment of the
groundwater recharge potential zone.