Advances in Smart Computing and Bioinformatics
ANALYSING THE PERFORMANCE OF ERBIUM DOPED FIBER AMPLIFIER AND AVALANCHE
PHOTODIODE RECEIVER IN DYNAMIC WDN NETWORK
NIKITA M JOEL, BRINTHA THERESE A*
School of Electronics and Communication, VIT University, Chennai, Tamil Nadu, India, Email: [email protected] Received: 09 December 2017; Revised and Accepted: 06 April 2017
ABSTRACT
This paper demonstrates the performance of erbium-doped fiber amplifier (EDFA) and avalanche photodiode receiver in a dynamic wavelength division multiplexing (WDM) system. A four channel 10 Gb/s system is taken into consideration, and the performance of EDFA is assessed. The experimental setup consists of a transmitter, a receiver, and two intermediate nodes. The transmitted system is tested for bit error rate and eye pattern at the receiver. The spectrum is also analyzed for different lengths of fiber. Add drop experiment was carried out on in which a laser source was switched on and off continuously to assess the transient response of WDM system. Then, the eye pattern is analysed in which EDFA system will provide a clear open eye with no degradation of signal.
Keywords: Wavelength division multiplexing, Erbium-doped fiber amplifier, Eye pattern, Bit error rate.
INTRODUCTION
In metro and access systems amplification is becoming necessary factor to meet the targets of optical networks [5]. New optical capacities, for example, channel including and dropping, exchanging, what’s more, directing of signs, present misfortune in system hubs. An optical intensifier innovation is required that empowers loyal intensification of the flag, paying little mind to information rate and channel check, even under element conditions. Wavelength division multiplexing (WDM) is an innovation that makes it conceivable to send numerous optical signs, every flag with various wavelength, along a solitary bit of optical fiber. An erbium-doped fiber amplifier (EDFA) is used which provide inline amplification of signal [9], i.e., the signal does not need to be converted to electrical signal before amplification. The amplification is entirely optical. The gain is relatively flat so that they can be cascaded for long distance use. A simple block diagram of WDM network with attenuator and amplifier is shown in Fig. 1.
LITERATURE SURVEY
Zhang et al. [1] recommended about the execution of WDM organizes by considering that there are two unique methods of switching, for example, optical packet switching and optical circuit switching. An arranging is proposed including wavelength or intensifier portion to enhance the blocking likelihood and to guarantee nature of flag.
Baziana and Pountourakis [2] investigated the execution advancement of a WDM organize in a detached star topology which utilizes a multi-channel control architecture to keep away from both information channels and goal clashes.
Yamazaki et al. [3] looked at, abridged and investigated effects on bit error rate (BER) and ideal identification limits for least piece blunder rates in both graphical and unthinkable shape for the two distinctive models, for example, Gaussian and non-Gaussian models.
Sun et al. [4] hypothetically and tentatively explored the execution of EDFA based WDM ring system with free opened up unconstrained outflow (ASE).
WDM SYSTEM
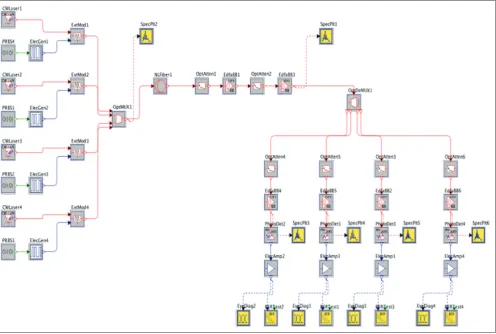
The experiment consisting of one transmitter node, two intermediate nodes and one receiver node setup using optsim software is shown in Fig. 2. The transmitter node consists of four continuous wave (CW) laser source in 1 the range of 1549.2-1560.6 nm. The CW laser continuously emits and pump light signal. These signals were modulated simultaneously at 10Gb/s with a pseudorandom bit sequence (PRBS) of length 231−1 [14]. PRBS is used as test pattern which always uses random bits of 0 and 1 [6]. Electrical generator is used which converts the PRBS output into electrical signal. The output of which is fed into optical multiplexer for multiplexing and routing different channel of light into a fiber. A 5 km nonlinear fiber is utilized which couples the flag to create decorrelated bit design at the yield of transmitter hub. These signs then go into the middle of the road hub where they are weakened by optical attenuator, which decreases the power level of optical flag in free space or in an optical fiber. It is then supported by EDFA to an aggregate normal force of 3 dBm. Next signs were sent into the second middle of the road hub which is built with the second attenuator and the Erbium doped enhancer.
An estimate of 350 mA current is given to the speaker. The yield of which is coupled to the recipient hub. In the beneficiary hub, optical demultiplexer is utilized to isolate the WDM signals; it is then given to the optical attenuator and afterward to the pre-enhancer. Avalanche Photodiode is used at the receiver. The received signal is evaluated for BER to determine the performance of receiver in an EDFA-based WDM system. The spectrum is also analyzed at the receiver using spectrum analyzer.
RESULTS AND DISCUSSION
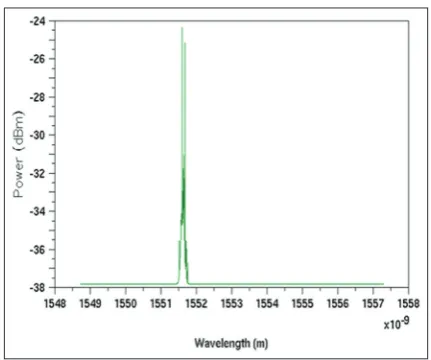
The four laser sources are given different wavelength in the range between 1550 nm and 1560 nm. The spectrum of such four sources is obtained in their respective wavelength range for three different lengths of fiber such as 5 km, 20 km, and 35 km fibers.
The spectrum of four laser sources before passing through fiber is shown in Fig. 3.
The spectrum of laser sources after passing through 5 km, 20 km, and 35 km fiber is shown in Figs. 4-6, respectively.
The spectrum of each source is obtained after demultiplexing without much degradation of signal and it is shown in Figs. 7-10.
The spectrum of the first laser source in a 20 km fiber after demultiplexing is shown in Fig. 7.
The spectrum of the second laser source in a 20 km fiber after demultiplexing is shown in Fig. 8.
The spectrum of thethird laser source in a 20 km fiber after demultiplexing at the receiver is shown in Fig. 9.
The spectrum of the fourth laser source in a 20 km fiber after demultiplexing at the receiver is shown in Fig. 10.
Fig. 1: Experimental setup of wavelength division multiplexing network
Fig. 4: Spectrum of four laser sources after passing through 5 km fiber
Fig. 5: Spectrum of four laser sources after passing through 20 km fiber
Fig. 6: Spectrum of four laser sources after passing through 35 km fiber
Fig. 7: Spectrum of source 1 after demultiplexing
Fig. 8: Spectrum of source 2 after demultiplexing
Fig. 9: Spectrum of source 3 after demultiplexing
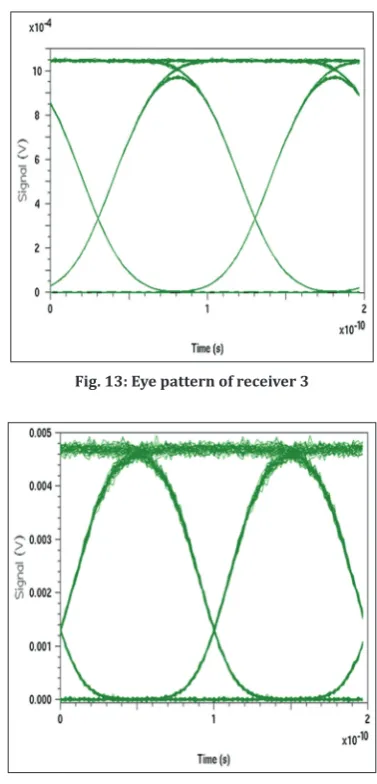
then the eye width will be larger. In this experiment, a clear eye pattern of larger width is obtained which indicates very low degradation of signal as shown in Figs. 11-14, respectively.
Fig. 10: Spectrum of source 4 after demultiplexing
Fig. 11: Eye pattern of receiver 1
Fig. 13: Eye pattern of receiver 3
Fig. 14: Eye pattern of receiver 4
CONCLUSION
Thus, we have experimentally shown the performance of avalanche photodiode receiver in an EDFA based WDM network. The eye pattern of receiver is obtained for all laser inputs and its spectrum is analyzed. It is found that EDFA based WDM system shows no much observable signal degradation.
1. Zhang Y, Chowdhury P, Tornatore M, Mukherjee B. Energy efficiency in telecom optical networks. IEEE Commun Surv Tutor 2010;12(4):441-58.
2. Baziana PA, Pountourakis IE. Performance optimization with propagation delay analysis in WDM networks. Comput Commun 2007;30:3572-85.
4. Sun Y, Srivastava AK, Zyskind JL, Sulhoff JW, Strasser TA, Wolf C,
et al. Signal power variations in optically amplified WDM ring networks. In: European Conference on Optical Communications; 1997. p. 135-7.
5. Dijaili SP. LOA’s enable next-generation metro networks. Lightwave Mag 2001:178-87.
6. Francis DA, Dijaili SP, Walker JD. A single chip linear optical amplifier. Presented at the Proceedings Optical Fiber Communication Conference. Anaheim, CA; 2001.
Table 1: Comparision of performance of WDM network in a 5 km, 20 km and 35 km fibers
Fiber length (km) Input
power (dBm) Output power (dBm) BER
5 −80 −70 e−122
20 −80 −69 e−122
35 −80 −60 e−122
WDM: Wavelength division multiplexing, BER: Bit error rate
REFERENCES
of semiconductor optical amplifiers. In: Proceedings of 26th European
Conference on Optical Communication. Vol. 1. Invited Paper. Munich, Germany; 2000. p. 35-8.
8. Neukermans A, Ramaswami R. MEMS technology for optical networking applications. IEEE Commun Mag 2001;39:62-9.
9. Srivastava AK, Sun Y, Zyskind JL, Sulhoff JW. EDFA transient response to channel loss in WDM transmission system. IEEE Photon Technol Lett 1997;9:386-8.
10. Jiang X, Roudas I. Asymmetric probability density functions of a signal with interferometric crosstalk. IEEE Photon Technol Lett 2001;13:160-2.
11. Forestieri E. Evaluating the error probability in lightwave systems with
chromatic dispersion, arbitrary pulse shape and pre - and post detection filtering. J Lightwave Technol 2000;18:1493-503.
12. Marcuse D. Derivation of analytical expressions for the bit-error probability in lightwave systems with optical amplifiers. J Lightwave Technol 1990;18:1816-23.
13. Abramowitz A, Stegun I. Handbook of Mathematical Functions. 9th ed.
New York: Dover; 1972.
14. Dods SD, Anderson TB. Calculation of bit-error rates and power penalties due to incoherent crosstalk in optical networks using Taylor Series expansions. J Lightwave Technol 2005;23:1828-37.