DEVELOPMENT AND VALIDATION OF STABILITY-INDICATING REVERSE-PHASE
HIGH-PERFORMANCE LIQUID CHROMATOGRAPHY METHOD FOR THE SIMULTANEOUS
QUANTIFICATION OF POTENTIAL DEGRADATION PRODUCTS OF REGADENOSON FROM ITS
PARENTERAL DOSAGE FORM
MURLIDHAR V ZOPE
1,2, RAHUL M PATEL
2, ASHWINIKUMARI PATEL
2, SAMIR G PATEL
1*
1Dpartment of Pharmaceutical Analysis and Quality Assurance, Ramanbhai Patel College of Pharmacy, Charotar University of Science and Technology, Charusat Campus, Changa, 388421, Ta. Petlad, Gujarat, India. 2Sun Pharma Advanced Research Company Ltd., Tandalja,
Vadodara, Gujarat, India. Email: [email protected]
Received: 06 April 2018, Revised and Accepted: 07 May 2018
ABSTRACT
Objective: The objective was to develop and validate the stability indicating reverse-phase high-performance liquid chromatography method for the quantification of potential degradation products of regadenoson (REGA) from its injectable dosage form.
Methods: YMC-PAK ODS AQ, 150 mm × 4.6 mm, 3 µm composed with hydrophobic high carbon loading and a relatively hydrophilic surface chemically bonded to porous silica particles column was used with the temperature maintained at 40°C. Mobile phase A composed of 0.1% triethylamine buffer having pH 4.5 while mobile phase B is 100 % acetonitrile was used for gradient elution with 1.5 ml/min as a flow rate. The wavelength used for quantification was 245 nm and 20 µl as an injection volume. The suitability of the method has been checked and validated according to the International Council for Harmonization (ICH) guidelines for different parameters, namely, specificity, linearity, accuracy, precision, limit of quantification (LOQ), Limit of detection (LOQ), and robustness studies.
Results: The resolution between REGA and its two-degradation product is >8.0 for all pairs of components. The high correlation coefficient (r2>0.990) values are for drug and all potential degradation products from LOQ to 150% of specification limits for impurities calculated based on the maximum daily dose of REGA. LOQ for the drug as well as each degradation product is <0.02% w/w. The % relative standard deviation (RSD) for precision and intermediate precision is in the range of 0.17–0.89, and % RSD for precision at LOQ is 0.86–2.35. The % RSD for robustness study is maximum 2.59. Conclusion: The developed method can quantify the specified and unknown degradation products from 0.1% in the injectable dosage form which indicates that method is sensitive. Method fulfills the ICH criteria for its different validation parameters and demonstrates that the developed analytical method is highly specific, precise, and robust and would have a great value when applied in quality control and stability studies for REGA injection. Keywords: Regadenoson, Degradation products/related substances, High-performance liquid chromatography, Validation.
INTRODUCTION
Regadenoson (REGA) (1-[6-amino-9-[(2R,3R,4S,5R)-3,4–dihydroxy- 5-(hydroxymethyl)oxolan-2-yl]purin-2-yl]-N-methylpyrazole-4-carboxamide) (CVT-3146, Lexiscan) (Fig. 1) is an A2A adenosine receptor agonist. The molecular formula for REGA is C15H18N8O5 •H2O and its molecular weight is 408.37. REGA is a coronary vasodilator that is commonly used in pharmacologic stress testing. It produces hyperemia quickly and maintains it for a duration that is useful for radionuclide myocardial perfusion imaging (MPI). The selective nature of the drug makes it preferable to other stress agents such as adenosine, which is less selective and therefore causes more side-effects [1].
The dosage form available is an injection which is the non-pyrogenic solution for intravenous injection. The solution is clear and colorless. Each 1 mL in the 5 mL pre-filled syringe contains 0.084 mg of REGA monohydrate, corresponding to 0.08 mg REGA on an anhydrous basis, 10.9 mg dibasic sodium phosphate dihydrate or 8.7 mg dibasic sodium phosphate anhydrous, 5.4 mg monobasic sodium phosphate monohydrate, 150 mg propylene glycol, 1 mg edetate disodium dihydrate, and water for injection, with pH between 6.3 and 7.7. It is a pharmacologic stress agent indicated for radionuclide MPI in patients unable to undergo adequate exercise stress. It is available in single-dose pre-filled syringe which is clear, colorless solution containing REGA 0.4 mg/5 mL (0.08 mg/mL). The recommended intravenous dose is
5 mL (0.4 mg REGA). Based on literature review, it was found that few analytical methods are available for the estimation of REGA using high-performance liquid chromatography (HPLC) [2] and HPLC/MS/MS [3].
During pharmaceutical development of the drug product, impurity profiling plays a vital role. The different regulatory bodies such as US-FDA and EMA recommend identifying and estimating the impurity present above 0.1% of the label claim for the active substance. The International Council for Harmonization (ICH) has also provided a guidance document to monitor impurities present in new drug substances and new drug products [4]. During the shelf life, the dosage form factors can influence the drug stability and ultimately result into the forced recall of the marketed products. Pantoprazole for injection, 40 mg per vial, was recalled from the United States markets because of failed impurities/degradation products limit for N-Oxide generated leading to the sub-potent formulation [5]. Determination of related substances should be the first step in the examination of safety and quality of the drug product. Therefore, the analytical method being used should be sensitive (having a low limit of detection [LOD] and limit of quantification [LOQ]) and stability indicating, i.e., should be able to separate and quantify the drug, its related substances, and degradation products [6,7].
A very low concentration of drug and presence of other critical excipients pose the challenges in developing the analytical method for © 2018 The Authors. Published by Innovare Academic Sciences Pvt Ltd. This is an open access article under the CC BY license (http://creativecommons. org/licenses/by/4. 0/) DOI: http://dx.doi.org/10.22159/ajpcr.2018.v11i8.26164
related substance in REGA formulations. The thorough literature survey revealed that there is no pharmacopoeial monograph available for this drug substance or drug product and no HPLC method is available in the literature for quantification of REGA and its degradation products. However, one method has been reported in the literature for the determination of 2-chloeroadenosin as a process impurity of REGA in formulated products [2,8-10]. As there are no HPLC methods available for the estimation of degradation product of REGA in parenteral dosage form, hence the present work is done.
In this research paper, development of a stability indicating HPLC method for the simultaneous detection and quantitative determination of the two degradation products in REGA in injection has been reported. Forced degradation studies were carried out to establish stability indicating nature of the method as per the ICH stability guidelines. LOD, LOQ, and linearity were established as per the ICH guidelines. The limit of these impurities has been considered as 1.0% in accordance with the ICH guideline based on maximum daily dose. The developed chromatographic method can resolve the degradation products with the acceptable resolution to achieve good chromatography, and the optimized methodology has been validated to accomplish the ICH guidelines for analytical method validation [10,11].
The present analytical work describes an accurate, specific, repeatable, and stability-indicating method for the determination of degradation products for the assessment of purity of drug and stability of its injectable dosage form.
METHODS
Chemicals and reagents
The sample of REGA was received from Sun Pharma, Baroda. The degradation products DP-1 and DP-2 were identified, isolated, and characterized. The HPLC grade acetonitrile was purchased from Rankem Fine Chemicals, India; analytical reagent grade triethylamine, orthophosphoric acid, dimethylsulfoxide, and methanol were purchased from Merck fine chemicals, India; and HPLC grade water was produced internally using Milli-Q, Millipore water purification system.
Instrumentation
The analytical method has been developed and validated using HPLC system, from Waters alliance 2695 series with 2489/2998 Detectors
(Waters corporation 34 Maple Street, Milford, Massachusetts,01757USA) consisting of Quaternary gradient pump, auto-sampler, Column oven, and variable wavelength detector. The output signal was monitored and processed using Empower Software. The other equipments used are electronic balance (Mettler Toledo, USA), sonicator (Bandalein Sonorex, Germany), centrifuge (Heraeus Biofuge Stratos, UK), ultraviolet (UV)-chamber (Cintex Industrial Corporation), and vacuum oven (Thermo lab, India).
Chromatographic condition
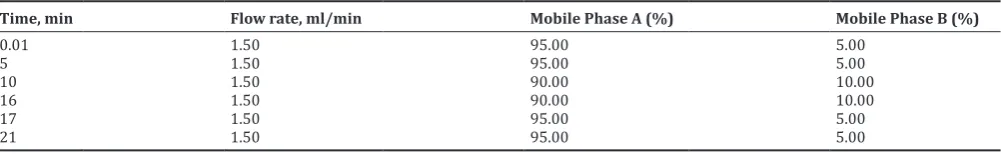
The separation of drug and degradation products was achieved using a column containing YMC-PAK ODS-AQ, 150 mm × 4.6 mm 3 µm as a stationary phase and eluting it for 21 min with mobile phases A and B (as per gradient program shown in Table 1) at a flow rate of 1.5 ml/min. The mobile phase A is 0.1% v/v triethylamine pH 4.5, while mobile phase B is 100 % acetonitrile. 20 µl injection volume and 40° C column temperature have been used throughout the analysis. Wavelength 245 nm with photodiode array detector has been used for detection, purity establishment, and quantification of potential degradation products.
Preparation of standard and sample solution
Water is used as a diluent. The standard stock solution of drug and degradation products was prepared at 100 µg/ml concentration in a mixture of DMSO:methanol:water in the ratio of 12.5:12.5:75 v/v. The working standard solution of 2.5 µg/ml was prepared from 100 µg/ml stock solution (for REGA) with the help of water as diluent. The sample solutions of dosage forms and respective placebo were prepared by transferring 4 ml of drug product formulation or 4 ml of placebo formulation, which is equivalent to 0.32 mg of REGA, into 5 ml volumetric flask and diluted up to 5 ml with water, and the solution is further mixed using cyclomixer for about 5 min.
Method validation
As per the ICH Q2(R1) guideline, the developed method was validated for accuracy (by recovery), precision, specificity, linearity, LOD, LOQ, and robustness [9,10]. During development, the system suitability was established and demonstrated before the experiments of above-mentioned validation parameters. A set of injecting blank (diluent) and working standard solution (6 replicate injections) into the chromatographic system have been injected to ensure the proper retention and peak tailing, theoretical plates and % relative standard deviation (RSD) of the drug.
Specificity is the ability to assess unequivocally the analyte in the presence of components which may be expected to be present. Typically, these might include other substances, i.e., impurities, degradants, and excipients. The specificity of the method was established by injecting a solution of 64 µg/ml of REGA and two individual solutions of degradation products in the above given chromatographic conditions. The placebo containing all excipients mentioned in the composition except drug has been injected to the interference at the retention time of drug and degradation product. The 4 ml formulation and placebo were exposed to the various stress condition as mention below:
Acid (5 M HCl heated at 60° for 2 h), base (5M NaOH heated at 60°for 4 h), peroxide (6% v/v H2O2 heated at 40° for 5h), thermal (heated at 80° for 5 days), and UV (exposed for 5 days at 254 nm and 360 nm). . The sample and placebo for acid and base hydrolysis were cooled to Fig. 1: Chemical structure of regadenoson
Table 1: The optimized gradient program
Time, min Flow rate, ml/min Mobile Phase A (%) Mobile Phase B (%)
room temperature and subsequently neutralized with an equivalent amount and strength of base and acid, respectively. The final samples were then injected into chromatograph to see the degradation.
The LOD and LOQ for REGA and two degradation products were determined by adopting slope method approaches prescribed in the ICH guidelines. The individual stock solutions of REGA and two degradation products at about the concentration of 16 µg/ml) were prepared to demonstrate the linearity. The different concentration of solution for more than five calibration levels containing REGA and two known degradation products was prepared using different volumes from the above-mentioned stock solutions. The resultant solutions of calibration levels have 1% of the impurities at specification level for DP-1, DP-2, and REGA. The plot of peak area of REGA and two known degradation products were plotted against their respective concentrations. The method of least square regression was used to describe correlation coefficient, regression equation, and Y-intercept bias.
The precision was conducted by preparing three solutions at LOQ and 100% level of the specification with spiking in placebo (for LOQ) and sample (for 100% level). The LOQ samples were prepared by taking 4 ml of placebo formulation in 5 ml volumetric flask and spiking it with REGA, DP-1, and DP-2 individual concentration of 0.064 µg/ml in 5 ml sample solution), and the final volume was made up to the mark. The 100% level samples were prepared by taking 4 ml of the formulation (equivalent to total 320 µg of REGA) in 5 ml volumetric flask and spiking it with DP-1 and DP-2 (to have a concentration of 0.64 µg/ml of each), and the final volume was made up to the mark with water. The % RSD of observed impurity levels was calculated and reported for each impurity. The intermediate precision (reproducibility) at 100% level was also conducted during validation exercise by analyzing the new set of six replicate samples on day 2 by the second analyst at 100% level.
The accuracy of the method has been performed by recovery experiments with standard addition technique to demonstrate the accuracy of the proposed method. The placebo formulation has been spiked with REGA and impurity standard solutions at LOQ level. The solutions were made in triplicate and injected into the chromatographic system. The LOQ samples were prepared by taking 4 ml of placebo formulation in 5 ml volumetric flask and spiking it with REGA, DP-1, and DP-2 (to have a concentration of 0.064 µg/ml of each), and the final volume was made up to the mark with water. The 50%, 100%, and 150% level samples were prepared by taking 4 ml of sample formulation in 5 ml volumetric flask and spiking it with DP-1and DP-2 (to have the
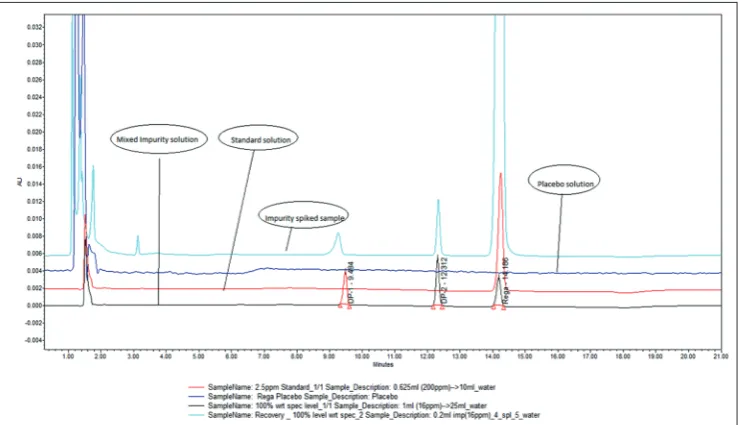
concentration of 0.32, 0.64 and 0.96 µg/ml respectively for each level), Fig. 2: Typical chromatogram of regadenoson spiked with DP-1 and DP-2
Fig. 3: Overlay chromatogram of regadenoson injection spiked with DP-1 and DP-2, standard solution, and placebo solution and the final volume is made up to the mark with water.
The robustness of the method was established by injecting a working standard solution of REGA and at three different flow rate, pH, and
different column oven temperature . A standard solution containing
REGA, DP-1 and DP-2 was prepared at concentration of 2.5 µg/ml each and used to monitor the retention time and resolution of REGA and its degradation products during the PH robustness study. The standard solution was injected in six replicates to calculate the % RSD in each deviation of the chromatographic parameter, i.e., flow rate, column temperature, and pH.
RESULTS AND DISCUSSION
REGA and all its degradation compounds showed wavelength maxima at 245 nm, and therefore, it was selected as wavelength for the detection. The column oven temperature was maintained at 40°C to achieve the sharpness of the peaks. The injection volume 20 µl was selected to reduce the load on the column and to get the better specificity.
Initial trails were taken using mobile phase A as 0.1% triethylamine in water (pH adjusted to 4.5) and acetonitrile as mobile phase B, in the ratio of 95:05. However with the higher buffer concentration higher retention time of REGA was observed. Further, the application of gradient as shown in Table-1 has been used with the column temperature as 40°C which gives better separation of the impurities from the main peak of drug and qualified all suitable parameters with a total run time of 21 min.
peaks of interest and showed consistent performance in various lots of the columns.
Different flow rates were used to optimize the total run time, and finally, flow rate of 1.5 ml/min was chosen which create low back pressure. The optimized method showed good resolution between REGA and two degradation products (Fig. 2) and REGA and two degradation product placebo peaks (Fig. 3).
The retention time, relative retention time, and relative response factor of each impurity and their concentration with respect to REGA are depicted in Table 2.
The solubility of the drug has been tried with different organic solvent and mixture thereof, namely, methanol, acetonitrile, dimethyl sulfoxide, methanol:acetonitrile, and dimethyl sulfoxide:methanol. The solvent mixture containing dimethyl sulfoxide:methanol (1:1) shows good peak symmetry because the chosen solvent mixture is miscible with the optimized combination of the mobile phase.
The system suitability with the following acceptance criterion was demonstrated every time before all experiments of the validation parameters. The % RSD of five injections of REGA (2.5 µg/ml) solution should not be more than 5%. Since the minimum resolution between DP-2 and REGA is more than 8 and resolution between DP-1 and DP-2 is more than 11, these values are very well above the regulatory requirement of resolution not <2; therefore, resolution criteria have not been included in the system suitability. The tailing factor of 2 was selected since this controls the peak asymmetry. Theoretical plates’ count of not <5000 was set.
The above optimized chromatographic conditions were further subjected to method validation as per the ICH (Q2[R1]) guidelines. The chromatograms depicted in Figs. 2 and 3 revealed that the developed method is specific since there is no interference among REGA and its degradation products from formulation matrix. The results of the various forced degradation experiments are shown in Table 3. The
peak purity of REGA and its related substances in forced degradation samples shows that the peak of REGA and its related substances is pure as the purity angle of REGA and its degradation product is less than the purity threshold. From all degradation condition, only acid and alkali are responsible for the degradation of REGA. The data from Table 3 and Figs. 4 and 5 revealed that REGA got degraded in acidic condition to form 13.81% of DP-2, while in alkaline degradation, 14.63% of DP-1, 0.47% of DP-2, 0.34% of highest unknown, and 1.56% of total unknown impurities were formed.
Mass balance has been calculated with respect to the area of the main drug from control sample for each degradation condition, and it has been found that the % mass balance lies within the range of 95–105% which means that the method is capable to identify and quantify the entire degradation product formed in all stress conditions. As shown in Figs. 4 and 5, the peak height and area counts of REGA got reduced, confirming the susceptibility of REGA to acidic and alkaline condition, respectively. However, the data revealed that the oxidation, hear, and photolytic degradation of REGA did not result into the known and unknown degradation products. Thus, the method is capable to identify and quantify all possible degradation products and this observation ensures the stability-indicating nature of the developed method [1,12].
The concentration of LOD and LOQ was found to be 0.0128 and
0.064 μg/ml for REGA as well as its degradation products. Moreover,
the signal-to-noise ratios are in the range of 2.24–3.59 for LOD and 13.3–18.6 for LOQ for REGA and its degradation products, indicating that the noise is not contributing to the quantified area.
Table 4 represents the data of linearity for REGA and all degradation products. The results show that the developed method is linear in the range of 0.068 µg/ml (LOQ)–1.024 µg/ml (150% of the specification limit) for REGA, while for DP-1, the method is linear in the range of 0.068 µg/ml (LOQ)–1.055 µg/ml (150% of individual degradation product specification limit), and for DP-2, the method is linear in the range of 0.063 µg/ml (LOQ)–0.989 µg/ml (150% of individual
Table 2: Retention time, relative retention time, resolution, and relative response factor of REGA and degradation products
Impurities Working concentration µg/ml (%) RT (min) RRT Resolution RRF
DP-1 0.64 (1.0) 9.54 0.65 NA 0.94
DP-2 0.64 (1.0) 12.34 0.87 14.23 1.15
REGA 64 (100.0) 14.22 1.00 8.74 1.0
RT: Retention time, RRT: Relative retention time, RRF: Relative response factor, REGA: Regadenoson
Table 3: Forced degradation data of REGA from formulation composition
Degradation
conditions* DP-1 (%) DP-2 (%) Highest unknown (%) Total unknown (%) Drug remaining (%) Mass balance (%)
A. Control 0.29 0.22 ND ND NA NA
B. Acid ND 13.81 ND ND 88.45 102.26
C. Alkali 14.63 0.47 0.34 1.56 87.89 104.90
D. Oxidation ND ND ND ND 100.00 100.00
E. Thermal ND ND ND ND 100.00 100.00
F. Photolytic ND ND ND ND 100.00 100.00
*A: Control sample, B: Acid degradation sample 5M HCl at 60°C for 2 h, C: Alkali degradation sample 5M NaOH at 60°Cfor 6 h, D: Peroxide degradation sample 6% v/v H2O2 at 40°C for 5 h, E: Oven heated sample 80°C for 5 days, F: UV light degradation sample at 254 nm and 360 nm for 5 days, ND: Not detected, NA: Not applicable
Table 4: Linearity data for REGA and its degradation products
Compound Linearity/range (µg/ml) Correlation coefficient (r2) Y-intercept
DP-1 0.068–1.055 0.9987 0.07910
DP-2 0.063–0.977 0.9953 0.31194
REGA 0.066–1.024 0.9980 −0.08690
degradation product specification limit). The regression coefficients for REGA and two degradation products are in the range of 0.9953–0.9975 which are well within the ICH criteria for impurities.
Fig. 4: Overlay chromatogram of acid degradation stress (placebo, control sample, and acid degraded sample)
Fig. 5: Overlay chromatogram of alkali degradation stress (placebo, control sample, and alkali degraded sample)
Table 5: Precision and intermediate precision data
Impurities Precision at LOQ Precision at 100% Intermediate precision at 100%
Impurity (µg/ml) % RSD, n=3 Impurity (µg/ml) % RSD, n=3 Impurity (µg/ml) % RSD, n=6
DP-1 0.062±0.0015 0.86 0.62±0.0011 0.17 0.62±0.0050 0.85
DP-2 0.073±0.0006 2.36 0.73±0.0051 0.70 0.66±0.0062 0.89
N: Number of replicates. LOQ: limit of quantification, RSD: Relative standard deviation
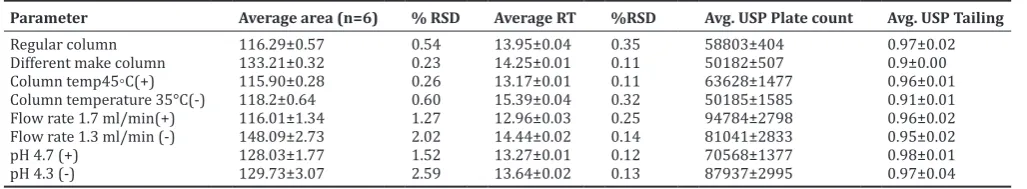
Table 6: System suitability data for robustness study
Parameter Average area (n=6) % RSD Average RT %RSD Avg. USP Plate count Avg. USP Tailing
Regular column 116.29±0.57 0.54 13.95±0.04 0.35 58803±404 0.97±0.02
Different make column 133.21±0.32 0.23 14.25±0.01 0.11 50182±507 0.9±0.00
Column temp45◦C(+) 115.90±0.28 0.26 13.17±0.01 0.11 63628±1477 0.96±0.01
Column temperature 35°C(-) 118.2±0.64 0.60 15.39±0.04 0.32 50185±1585 0.91±0.01
Flow rate 1.7 ml/min(+) 116.01±1.34 1.27 12.96±0.03 0.25 94784±2798 0.96±0.02
Flow rate 1.3 ml/min (-) 148.09±2.73 2.02 14.44±0.02 0.14 81041±2833 0.95±0.02
pH 4.7 (+) 128.03±1.77 1.52 13.27±0.01 0.12 70568±1377 0.98±0.01
pH 4.3 (-) 129.73±3.07 2.59 13.64±0.02 0.13 87937±2995 0.97±0.04
N: Number of replicates, Avg: Average. RSD: Relative standard deviation
The mean of all recovery values at three different levels for all related impurities is in the range of 98–102% which are well within the acceptance criteria of 90–110%. Thus, the developed method is accurate with respect to all two degradation products.
The results of robustness studies are shown in Table 6. The % RSD (for area and retention time), theoretical plate count and tailing factor were meeting the acceptance criteria for all the robustness conditions. The RSD for area and retention time were less than 3.0%, which is very well within the limit of 15% for impurity quantification, while there is no significant deviation of the area, retention time, theoretical plates, and tailing factor which proves the robustness of the demonstrated method.
The data generated in the present work explains the suitability of the developed method for quantitative analysis of impurities of REGA in active ingredient and in formulations. There are no chromatographic methods available for the estimation of degradation products in parenteral dosage form and hence the present work can be applied to routine and stability analysis.
CONCLUSION
The developed method is selective for quantification of REGA and its known degradation products and unknown degradation products formed during forced degradation without having interference from blank solution and placebo formulation matrix solutions, thereby affirming stability indicating in nature. The proposed method is highly sensitive, reproducible, and specific. Further, the developed method is robust for separating and quantifying REGA and its two degradation products in a single run. The proposed method can also be extended for routine quality analysis of pharmaceutical products of the similar composition. The developed method fulfills the criteria of analytical method validation mentioned in the ICH guidelines and different pharmacopeia.
CONFLICTS OF INTEREST
The authors have no conflicts of interest.
ACKNOWLEDGMENTS
The authors are thankful to Sun Pharma, Tandalja, Vadodara, India, for providing all the facilities for this research work.
AUTHOR’S CONTRIBUTION
Conception or design of the work: Murlidhar V. Zope. Data Collection: Ashwinikumari patel and Murlidhar V. Zope. Data Analysis and interpretation: Rahul M Patel and Murlidhar V Zope. Drafting the article: Rahul M Patel and Murlidhar V Zope. Critical revision of the article: Murlidhar V Zope. Final approval of the version to be published: Samir G. Patel.
REFERENCES
1. Cerqueira MD. The future of pharmacologic stress: Selective a2a adenosine receptor agonists. Am J Cardiol 2004;94:33-40.
2. Rajesh BY, Appala Raju VV, Raju NA. A validated RP-HPLC method for the determination of 2-chloroadenosine as process related impurity in regadenosen parenteral dosage form. J Chem Pharm Res 2017;9:55-61.
3. Jackson S, Anders NM, Mangraviti A, Wanjiku TM, Sankey EW,
Liu A, et al. The effect of regadenoson-induced transient disruption of
the blood-brain barrier on temozolomide delivery to normal rat brain. J Neurooncol 2016;126:433-9.
4. ICH Q3B (R2). Impurities in New Drug Products. Geneva: International Conference on Harmonization; 2006.
5. Indian Express: Dr Reddy’s, Aurobindo Recall Drugs From US Market; 2017. Available from: http://www.newindianexpress.com/ business/2017/feb/15/dr-reddys-aurobindo-recall-drugs-from-us-market-1570872.html. [Last accessed on 2017 Feb 15].
6. Vadlamudi MK, Dhanaraj S, Yarkala SA, Jayapal JJ, Kommavarapu PK. Development of stability indicating RP-HPLC method for the determination of related substances in atorvastatin solid dosage form and bulk drugs. Int J Pharm Pharm Sci 2015;7:184-94.
7. Mali AD, More UB. Development and validation of RP-HPLC method for simultaneous estimation of impurities from olmesartan medoximil and hydrochlorothiazide tablet. Int J Pharm Pharm Sci 2016;8:45-8. 8. United States Pharmacopeial Convention. The United States
Pharmacopeia, USP 34-NF29. Asian edition. Rockville, MD: United States Pharmacopeial Convention; 2011. p. 2025-8.
9. The Stationery Office Publications. British Pharmacopeia. Vol. 1. London, UK: The Stationery Office Publications; 2011. p. 265.
10. Council of Europe. European Pharmacopeia. 5thed. Strasbourg: Council
of Europe; 2011. p.1091
11. (ICH) guidelines Q2 (R1). Validation of Analytical Procedures: Text and Methodology. Geneva, Switzerland: (ICH) guidelines Q2 (R1); 2005. 12. (ICH) guidelines Q2A (R2). Stability Testing of New Drug Substances