DOI : 10.32628/CSEIT1952144
Design and Implementation of Traffic Forecasting Model Using
Data Mining
Nikhil Sahu1, Kajal Bobde1, Harshal Fulmali1, Piyush Wanjari1, Y. B. Malode2
1BE Students, Department of Information Technology, Priyadarshini Bhagwati College of Engineering, Nagpur,
Maharashtra, India
2Assistant Professor, Department of Information Technology, Priyadarshini Bhagwati College of Engineering,
Nagpur, Maharashtra, India
ABSTRACT
The exploration and use of Intelligent Transportation System have grown quickly because of the interest in safe , helpful, agreeable and data based present-day transportation. It is a vital piece of the examination of the Intelligent Transportation System to think about various structures, activity administers on traffic stream and set up rapid, steady, and powerful traffic stream show. With the advancement of Intelligent Transportation System, mass traffic, stream information have been aggregated in the Intelligent Transportation System. An ever-increasing number of specialists have begun to dissect the data of traffic stream by utilization of innovative information mining technique, and find concealed transportation mode and guideline among the data of traffic stream. Information mining innovation gives an incredible examination and handling capacity of mass traffic information. This paper breaks down the attributes of traffic information in intelligent transportation framework and advances the framework show and the various leveled engineering of traffic information mining framework.
Keywords: Traffic Analysis, Data Mining, Technical Analysis, Traffic Flow
I. INTRODUCTION
Data mining innovation is a sort of data handling innovation created as of late. It gives a ground breaking and adaptable data investigation and handling work in substantial scale data. It has been connected in choice emotionally supportive network (DSS). Wellbeing, accommodation, comfort and the traffic request of the data, the exploration and utilization of intelligent transportation framework has accomplished fast improvement. Different propelled data innovation has been generally utilized in intelligent transportation framework, intelligent transportation framework has collected tremendous
anticipating and traffic stream expectation dependent on fluffy rationale is examined.
The traffic stream estimating technique dependent on ARIMA, neural system and non parametric relapse is examined. The data mining innovation is utilized to mine the traffic framework's constant traffic show and the thorough traffic demonstrate. It very well may be utilized in the traffic the executives and control, improve the administration dimension of the intelligent transportation framework.
This paper breaks down the qualities of traffic data in the intelligent transportation framework and advances the primary models and techniques for data mining. The paper is organized as pursues: the second part breaks down the traffic data in ITS; the third part displays the framework show and the various leveled design of traffic data mining framework; the fourth part presents the principle models and strategies for traffic data mining, including traffic gauging model, grouping model and connection demonstrate.
II. LITERATURE REVIEW
Carlos Gutiérrez et al [1] Proposed to establish a computational framework, able to detect traffic-related events in real-time, using social networks. The framework aims to be flexible enough to Twitter, but also to other social networks. As described in this paper, we investigated the real-time nature of Twitter, in particular for traffic event detection. Semantic analyses were applied to tweets to classify them into a positive and a negative class. They consider each
implementation perspective, we developed a novel approach to notifying people promptly of a traffic event. Despite the challenges associated with the real-time nature and length limitation that distinguish the Twitter message from other societies in this paper, real-time clustering approach which clusters messages from a stream of tweets. A tweet message tends to be more credible if several users post similar messages in a very short period of time.
Living Li et al [2] Suggested that association rule mining and the classification, the environmental factors like roadway surface, weather, and light condition do not strongly affect the fatal rate, while the human factors like being drunk or not, and the collision type, have a stronger effect on the fatal rate. From the clustering result, we could see that some states/regions have a higher fatal rate, while some others lower. They may pay more attention when driving within those risky states/regions. Through the task performed, they realized that data seems never to be enough to make a strong decision. If more data, like non-fatal accident data, weather data, mileage data, and so on, are available, more test could be performed thus more suggestion could be made from the data.
Zhidan Liu et al [3] Presents a transport traffic estimation method which applies compressive sensing technique to achieve city-scale traffic estimation with only sparse traffic probes. The strong correlations among the road network are captured by an explicit model and further exploited to form a space basis that can sparsely represent the road traffic conditions. Through extensive trace-driven study and experiments, they validate the effectiveness of their traffic correlation model and show that our approach achieves accurate and scalable traffic estimation with only sparse probes.
contextual specialization of predictors to create a strong hybrid predictor from several weak predictors. The proposed framework matches the real-time traffic situation to the most effective predictor constructed using historical data, thereby self-adapting to the dynamically changing traffic situations. They systematically proved both short-term and long-short-term performance guarantees for their algorithm, which provide not only the assurance that their algorithm will converge over time to the optimal hybrid predictor for each possible traffic situation but also provide a bound for the speed of convergence to the optimal predictor. Their experiments on real-world dataset verified the efficacy of the proposed scheme and showed that it significantly outperforms existing online learning approaches for traffic prediction.
Tianzhu Zhang et al [5] Stated a novel framework is proposed to mine semantic context information for intelligent video surveillance of traffic scenes. First, they introduce how to learn scene-specific context information from object-specific context information. Then, object classification is improved by combining multiple features under a framework. Based on the learned information, they adopt it to improve object detection and tracking and detect abnormal events. Experimental results validate that the semantic context information is effective to improve object detection, object classification, object tracking, and abnormal event detection.
III. DATA VISUALIZATION
Data visualization is a process of transforming information into a visual form, enabling users to observe the information. The resulting visual display enables scientists or engineers to perceive visually the features that are hidden in the data but nevertheless are needed for data exploration and analysis. It is often easier to detect a pattern from a picture than from a numeric output. Graphical illustrations such
as plots and graphs therefore play an essential role as tools for analysis and exploration of inherent structure in data [6].
As one of the important tools in data mining, data visualization not only assists knowledge discovery but also controls the process of data analysis. There is no single general visualization method suitable for all problems. It is important to choose appropriate visualization methods according to the task and the property of data in order to provide critical and comprehensive appreciation of the data that will benefit subsequent analysis, processing, and decision-making.
Transportation practitioners at Beijing transportation departments now use traditional online transaction processing (OLTP) of database in tabular format to evaluate, summarize, and report the current traffic status. This conventional approach makes it difficult for them to discover hidden traffic patterns in the data and to provide more specific analysis and future plans of the existing system to help relieve the worsening traffic congestion problems. The goal of this study is to provide useful visual data analysis methods for transportation managers, engineers, and planners to explore traffic volume data intuitively and to discover the hidden traffic patterns. The visual analysis results in turn could help them make more effective decisions on the design of traffic operation strategies and future transportation planning. Choosing appropriate visualization methods that are suitable for traffic volume data and can effectively convey the information to transportation managers and engineers is not a trivial task.
For example, if a visualization technique such as the parallel coordinate is used to represent the traffic volume data, it may be too complex for transportation practitioners to easily interpret and compare the data.
paper discusses some basic issues of data visualization and provides suggestions for addressing them. In addition, big data brings a unique set of challenges. This paper covers some of those, as well as potential solutions.
If you are working with massive amounts of data, one challenge is how to display output in a way that’s not overwhelming. You may need to collapse and condense the data but still provide graphs and charts that decision makers are accustomed to seeing. And,
in today’s on-the-go society, visualizations must be
delivered quickly to mobile devices while giving people the ability to easily explore data on their own in real time.
Line Charts
Line charts show the relationship of one variable to another. They are most often used to track changes or trends over time. Line charts are also useful when comparing multiple items over the same time period. Bar Charts
Bar charts are most commonly used for comparing the quantities of different categories or groups. Values of a category are represented using the bars, and they can be configured with either vertical or horizontal bars, with the length or height of each bar representing the value.
Scatter Plots
A scatter plot (or X-Y plot) is a two-dimensional plot that shows the joint variation of two data items. In a scatter plot, each marker (symbols such as dots, squares and plus signs) represents an observation. Bubble Plots: A Scatter Plot Variation
A bubble plot is a variation of a scatter plot in which the markers are replaced with bubbles. A bubble plot displays the relationships among at least three measures. Two measures are represented by the plot axes. The third measure is represented by the size of the bubbles. Each bubble represents an observation. Pie and Donut Charts
There is much debate around the value of pie charts (and their more modern counterpart, donut charts),
which are used to compare the parts of a whole. However, they can be difficult to interpret because the human eye has a hard time estimating areas and comparing visual angles. Another challenge with using this chart for analysis is that it is difficult to compare slices, or sections, of the pie or donut that are similar in size but not located next to each other.
IV. PROPOSED SYSTEM
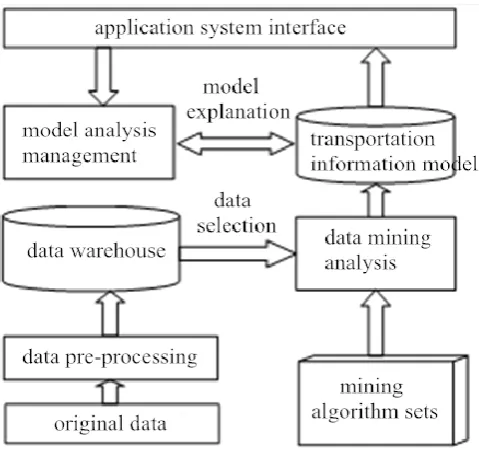
The framework model of traffic data mining framework gives a multi-level application engineering. It tends to be isolated into the application layer, rationale layer, calculation layer, and data layer. The application layer is the passage to the examination work which is set up by the client call investigation rationale, and the rationale of the application is the investigation capacity of the application framework.
Figure 1. System Architecture
Traffic figure incorporates numerous dimensions: the expectation of traffic stream data dependent on the data layer, the traffic stream attributes, traffic episode, and occasion type, traffic occurrence and occasion type, street clog expectation, the administration dimension of street arrange, the conjecture of occasions and occasion sway appraisal. In intelligent transportation framework, the Recognizable proof and forecast of traffic stream can be completed successfully to screen and deal with the traffic stream. It has imperative noteworthiness for the traffic flag control, traffic task, course direction, programmed route, mishap discovery, etc.
Traffic gauge incorporates numerous dimensions: the expectation of traffic stream data dependent on the data layer, the traffic stream attributes, traffic episode and occasion type, traffic occurrence and occasion type, street blockage forecast, the administration dimension of street arrange, an estimate of occasions and occasion sway evaluation.
In intelligent transportation framework, the distinguishing proof and expectation of traffic stream can be done successfully to screen and deal with the traffic stream. It has imperative essentialness for the
traffic flag control, traffic task, course direction, programmed route, mishap identification, etc.
V. CONCLUSION
Intelligent traffic data mining is observed to be profitable in a lot of traffic data. A data-driven methodology is utilized to investigate the traffic conditions. The investigation, assessment and guaging models of the intelligent transportation framework are set up. The constant traffic control and data the executives of the intelligent transportation framework can be improved.
This task can speak to data in client decipherable organization and furthermore to anticipate certain substances. These endeavors would help us in improving present traffic situation. Changes in traffic volume and street limit, generally through broadening of streets instead of development of new halls, have littler however in any case vital natural impacts contrasted and the making of new, cleared streets. In addition, the street mishaps or awful traffic control happens as a result of the absence of data and benefits. To conquer lacking and to make greater affirmation, we have made strides towards traffic strengthening.
VI.REFERENCES
[1] Carlos Gutiérrez, Paulo Figuerias, Pedro Oliveira, Ruben Costa, Ricardo Jardim-Goncalves. “Twitter Mining for Traffic Events Detection”, Science and Information Conference (SAI), 2015, DOI: 10.1109/SAI.2015.7237170 [2] Liling Li, Sharad Shrestha, Gongzhu Hu.
[3] Zhidan Liu, Zhenjiang Li, Mo Li, Wei Xing,
Dongming Lu. “Mining Road Network
Correlation for Traffic Estimation via Compressive Sensing”, Volume: 17, Issue: 7, July
2016,pp 1880 – 1893, DOI:
10.1109/TITS.2016.2514519
[4] Jie Xu, Dingxiong Deng, Ugur Demiryurek, Cyrus Shahabi, and Mihaela van der Schaar, “Mining the Situation: Spatiotemporal Traffic Prediction With Big Data Mining Semantic Context Information for Intelligent Video Surveillance of Traffic Scenes”
[5] Tianzhu Zhang, Si Liu, Changsheng Xu and Hanqing Lu. “Mining Semantic Context Information for Intelligent Video Surveillance of Traffic Scenes”, IEEE TRANSACTIONS ON INDUSTRIAL INFORMATICS, VOL. 9, NO. 1, FEBRUARY 2013
Cite this article as :