Evacuation Strategies
Evaluation of their effects during an evacuation in an urban area using a micro simulator
10 November 2008
Performed by:
Tamo Vogel
In cooperation with:
University of Florida
Evacuation Strategies
Evaluation of their effects during an evacuation in an urban area using a micro simulator
10 November 2008,
An outline of the bachelor thesis performed at the Transportation Research Center of the
University of Florida and submitted to the department of Civil Engineering at the University
of Twente.
by:
Tamo Vogel
Bsc. Student Civil Engineering
Department of Civil Engineering
University of Twente
Enschede, the Netherlands
Under supervision of:
dr. Lily Elefteriadou
Professor and director of the Transportation Research Center
Civil and Coastal Engineering
University of Florida
Gainesville, the United States of America
ing. Kasper van Zuilekom
Faculty of engineering, Center for Transport Studies
University of Twente
Enschede, the Netherlands
Acknowledgements
Management Summary
In this research, several evacuation strategies have been tested to establish their effects on a multimodal evacuation in an urban area. The main goal has been to analyze what the effects would be of a new evacuation strategy that has been developed by University of Florida student Ashwin Arulselvan. He developed a methodology to find efficient paths for cars and bus frequencies for any multimodal evacuation. Unfortunately, his computer model was not able to produce useful results within the time frame of this research. Therefore, this research analyzed eight other strategies and their effect on the evacuation of an urban area. Besides the analysis of the strategies, a manual has been written that can be used to implement and analyze other strategies in the developed network. This paper will only consider the effects of eight tested strategies. The strategies that have analyzed are:
1. Base case
Regular traffic operations without any specific traffic control measures. 2. No access towards campus
This strategy blocked the traffic that wanted to access the roads on the campus during the evacuation. It was expected that this strategy would reduce the congestion on the campus. 3. Contraflow on the campus
This strategy involved the redirection of incoming lanes for outgoing traffic. This strategy only reversed lanes on the campus, to reduce the congestion and evacuation time.
4. Contraflow on the campus and in Gainesville
This strategy expanded the previous one with contraflow lanes in whole Gainesville. The base case has been used to establish the most congested roads. With the deployment of contraflow on these roads, it is expected that the traffic will experience less congestion.
5. Increasing green time at the ramps
It has been observed that the traffic lights that grant access towards the interstate, had a capacity that did not match the demand during the evacuation. Therefore, the green time for the most congested directions has been at least doubled to increase the intersection capacity. 6. Increasing green time at the ramps and in Gainesville
This strategy is the same as the previous one, but also includes more green time for congested directions at intersections in whole Gainesville.
7. Staged evacuation
This strategy came forth out of the literature. With this strategy, the origins start evacuating in a sequence. This will spread the flow of traffic more over time and is expected to reduce congestion.
8. No control
In this strategy there is no form of control. All traffic lights have been removed and stop signs do not exist.
The micro simulator Corsim has been used to analyze the effects of the strategies. Multiple runs have been carried out to find the evacuation time, number of cars evacuated, total travel time, delay time ratios and travel speeds for each of the strategies in the two cases.
The results indicated that the ‘No control’ strategy is very effective in the first case. Its efficiency dropped during the second case. However, future research should consider how the no control strategy can be implemented into a real network to analyze its effects outside the micro simulator. Within the control strategies, increasing the green time at the ramps seems most efficient. It reduces the evacuation time by more than three hours compared to the base case. And in the second case it evacuated about then percent more vehicles than the base case. Also the other performance measures indicate that this strategy has a significant positive impact on the evacuation results.
The evacuation time is even more reduced, if the previous strategy is expended with an increase of green time on the main streets. However, some of the network performance measures show results that are not as good as the previous strategy. To implement this strategy will also take more effort and therefore this strategy is not preferred over the increase in green time just at the ramps.
The staged evacuation showed good results. Although the evacuation time did not reduce a lot in the first case, the second case showed a significant improvement between this strategy and the base case. The average travel time did support the idea behind this strategy that people experience less individual congestion and thus less delay time which improves their average speed and travel time. The strategy did also indicate a shorter evacuation time for the traffic on the campus area. The traffic will experience less delay outside the direct vicinity of the campus and is able to flow faster out of the endangered area.
The deployment of contraflow on the campus area and in Gainesville, resulted in more promising results. The evacuation and travel time is reduced and it resulted in the highest number of evacuated vehicles. Although the performance measures did not always indicate the same results, this strategy is definitely worth considering.
The deployment of contraflow on the campus area gave a small reduction in evacuation time, but did not score good results within the total travel time and the network performance measures. The strategy is able to evacuate vehicles faster from the campus area but moves the congestion outwards the campus area.
Table of Contents
2.3 Ways to evaluate strategies ... 21
2.4 Evacuation assessment studies ... 23
3 Description of cases ... 24
3.1 Case 1: Evacuation traffic ... 24
3.2 Case 2: Evacuation and background traffic ... 25
4. Simulation ... 26
4.1 Corsim ... 26
4.2 Assessment criteria ... 29
4.3 Research Area ... 31
4.4 Evacuation road network ... 32
4.5 Behavior parameters ... 34
5.4 Contraflow campus and Gainesville ... 43
5.5 Increasing green time ramps ... 43
5.6 Increasing green time ramps and main streets ... 43
5.7 Staged evacuation ... 43
Appendix 1: OD-matrix “Evacuation traffic” ... 70
Appendix 2: OD-matrix “Background traffic” ... 72
Appendix 3 : Adjusted parameters driver behavior ... 73
Appendix 4: Additional information “No Access Campus” ... 74
Appendix 5: Additional information “contraflow on campus” ... 75
Appendix 6: Additional information “Contraflow campus and Gainesville” ... 76
Appendix 7: Additional information “Increasing green time ramps” ... 77
Appendix 8: Additional information “Increasing green time all” ... 78
Appendix 9: Additional information “Staged evacuation” ... 80
Appendix 10: Results “Base case” ... 81
Appendix 11: Results “No Access Campus” ... 82
Appendix 12: Results “Contraflow Campus” ... 83
Appendix 13: Results “Contraflow Campus and Gainesville” ... 84
Appendix 14: Results “Increasing Green Time Ramps” ... 85
Appendix 15: Results “Increasing green time ramps and main streets” ... 86
Appendix 16: Results “Staged evacuation” ... 87
Appendix 17: Results “No control” ... 88
Appendix 18: Captures from the network in Corsim ... 89
Introduction
Every modern city is exposed to various potential disasters. Hardly a day passes without some form of disaster or tragedy hitting the headlines. These threats include not only natural hazards such as hurricanes, but also terrorist-induced and technological emergencies like biohazard attacks and nuclear leakage. It is impossible to rule these risks out. With the understanding of the potential threats, the focus of protection measures should not only be aimed at prevention. The focus should also include preparation and response measures that are fully developed and can be used in case an emergency occurs. One of the measures that policy makers can develop for these phases is the development of evacuation plans and the simulation of evacuations in order to respond effectively and in a timely manner during a disaster (Drennan & McConnell, 2007).
Although the focus on the development of large-scale evacuation plans is relatively recent in the Netherlands, the United States of America know a longer history in the development and research regarding evacuation plans and policies. The difference lies partially in the fact of the frequent presence of tornado’s and cyclones in some areas of the US and a culture that is more concerned about their safety and security (for instance terrorist attacks, hazardous materials spills etc.), and is willing to spend more money on their homeland security than most other countries (Wolshon & Meehan, 2003). Wolshon and Meehan (2003) also underline the task for scientists to help policy makers by developing strategies and plans that can increase the efficiency of an evacuation.
The focus of this research project lays on the evacuation of people out of an endangered zone. Disasters that require some type of evacuation are relatively common, but large scale evacuations
(for instance the clearance of an entire city) are relatively rare. One of the differences between
normal conditions and emergency situations lies in the fact that these emergency situations are so rare, that people cannot learn from their experience which route will minimize their evacuation time (Lindell & Prater, 2007). The threat of the disaster and the panic and chaos that exists by people, make it almost impossible and definitely undesirable, to test some form of evacuation strategies during a real-time evacuation. This emerges the need to develop and test evacuation plans using simulation software. In this research such a simulation program, Corsim, has been used to analyze the effects of different evacuation strategies on the evacuation time for an urban area when a sold out football stadium needs to be evacuated. The obtained results will be partially used to validate a new strategy developed by graduate student Ashwin Arulselvan. His strategy is aimed to find the most optimal solution for a multimodal evacuation problem by considering the use of buses and cars (Arulselvan, Multimodal Solutions for Evacuation Problems (Draft), 2008).
1. Problem domain
As stated in the introduction, modern cities are exposed to various potential disasters. The ever increasing role that humans play in both creation and destruction has provoked grave concern for the continued existence of the human race and the global environment. At the same time, modern science and technology have made great strides, which, in theory at least, have been accomplished for the betterment and safety of human society and the environment in which it lives. It is therefore ironic that many of these achievements are responsible for a considerable proportion of the disasters and human tragedy occurring today. Paradoxically, people often again turn to technology to find solutions to these problems and prepare to deal with them when they occur (Nisha de Silva, 2000). In order to increase the safety for the human populations, a number of approaches are possible (Pidd, de Silva, & Eglese, 1996). In the case of industrial or man-made disasters, people can try to reduce the probability of such incidents by making better and safer designs. Another approach is not to reduce the probability, but the impact of these incidents. For instance, the sighting of hazardous installations at what is believed to be a reasonable safe distance from populations’ centers. According to Pidd, de Silva & Eglese (1996), the third approach to cope with risks is to produce well tested evacuation plans which can be used to transfer people out of danger zones, should an incident occur.
An evacuation plan coordinates all necessary activities for the organization of an evacuation. It can be described as the set of measures to fully control dispersal, withdrawal or removal from people out of endangered areas. An evacuation plan is usually part of a more general disaster plan. It is therefore only one of the aspects in the complete process of decision-making by the crisis team (van Zuilekom & Zuidgeest, 2006). A well designed evacuation plan is a plan that helps the authorities by taking the right and effective actions when a disaster occurs. An important part of large scale evacuation plans consists of the actual evacuation strategy, or how to get people as fast and safe possible out of the endangered area. The strategy includes different traffic operation measures that can be issued by local or state authorities. Some of these measures require modifications on the network prior the emergency and others do not. Some require the deployment of extra personnel and others do not. The evacuation problem has been analyzed for the last decades, but it can be concluded that especially in the last decade new strategies have arisen.
Most of these strategies do not recognize the difference between different modes of transportation. Arulselvan (2008) concluded in his research that there is a shortage of strategies that include the use different modes of transportation during evacuations (Arulselvan, A Review of Evacuation Problems, 2008). He presented an analytical technique for establishing the most efficient paths for cars between their origin and destination in combination with the frequency of the buses along their predetermined routes, without exceeding the capacity of the roads. His strategy includes the predetermination of routes for private cars and the determination of bus frequencies in order to evacuate an urban area in its most efficient way.
2. Literature review
To get an idea about evacuation strategies and planning, a literature research has been conducted. In this chapter, relevant literature is briefly reflected. Firstly, some common aspects about evacuation plans are described. In the second part is discussed how the evacuation plans can be evaluated in a laboratory environment.
2.1 Evacuation planning
2.1.1 Defining evacuation
There have been, are and always will be the need for evacuations to get people out of an endangered zone. Still, not a single evacuation will be exact the same as a previous one. There are so many variables and unexpected events involved, that it is almost impossible to have evacuation plans ready which covers all the angels when a disaster strikes.
But it is important to be prepared and have plans in place that will help by making decisions. This emerges the need for an evacuation plan: such a plan coordinates all necessary activities for the organization of an evacuation. It can be described as the set of measures to control dispersal, withdrawal or removal from people out of endangered areas. A good evacuation plan is a prepared plan that helps the authorities by taking effective actions when a disaster occurs. The evacuation plan is usually part of a more general disaster plan. It is therefore only one of the aspects in the complete process of decision-making by the crisis team (van Zuilekom & Zuidgeest, 2006).
It is useful to develop a common understanding about the meaning of evacuation. In the literature are various definitions given for the term ‘evacuation’. Common aspects of these definitions are:
1. The involvement of many people
2. Movement of people out of an area threatened by a hazard
3. Transfer of threatened people to a safe place
4. Movement is temporary.
Within these aspects, Frieser (2004) developed a common definition about evacuation:
An evacuation is a temporary removal of people at risk to a safe place, beyond the reach of the hazard, it is initiated by an evacuation warning disseminated by the authorities and takes place in a
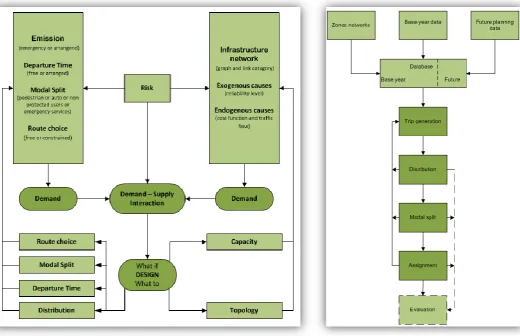
Figure 1: Global procedure for the design of an evacuation plan (Russo et al. (2004))
2.1.2 Design procedure evacuation plans
During an evacuation there is a process of matching supply and demand as in normal traffic situation although the setting in case of an evacuation is quite specific. Russo et al.(2004) presented two approaches that can be used in the design of the evacuation plan. The first approach is the ‘What-if’ procedure. Within this approach a scenario is modeled and the results are analyzed. The scenario is then iterated to obtain better evacuation results. This is maintained till no further improvement seems possible. The final result is interpreted and translated into an evacuation plan (Russo & Vitetta, 2004). The other approach is known as the ‘What-to’ or ‘How-to’ procedure. In this approach the result is determined by the objective function, the constraints and structure of the model (van Zuilekom & Zuidgeest, 2006). This is in contrast with the ‘What-if’ approach were the final result depends on the interpretation and adjustments of the modeler. Russo’s (2004) model for the development of evacuation plans, the ‘What-if’ and ‘What-to’ approach, is a model to represent the interaction between supply and demand in case of a preventive evacuation. It is in this way somewhat related to the normal traffic situation process, where there is a need for matching the supply towards the demand. The classical four-step transportation forecast model, can help by forecasting the relation between supply and demand. Russo (2004) showed that by influencing several factors the supply-demand interaction within evacuation conditions will change. He showed that strategies will influence either the demand or the supply from the system by influencing the classical phases of trip generation, distribution, modal split or assignment. The examined strategies will be reflected towards their impact in the classical model and therewith in the supply-demand interaction.
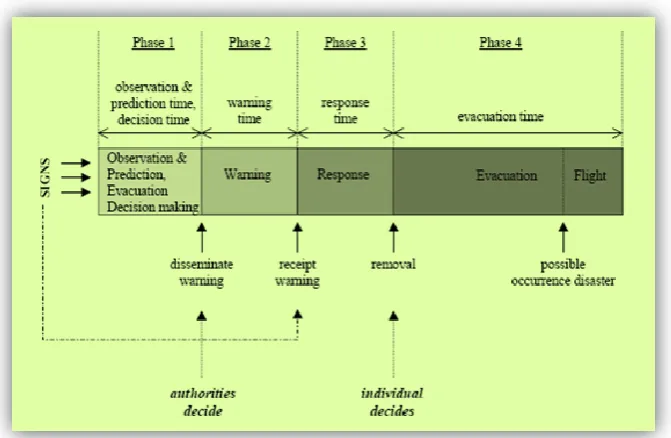
2.1.3 Evacuation process
Every evacuation can be divided in the same phases, the so called evacuation process. Understanding about this process is required since it helps by the development of a useful evacuation plan. Frieser (2004) provides a common definition about the evacuation process. He describes four different phases:
Phase 1: Observation & prediction of the hazard and evacuation decision making
Phase 2: Warning
Phase 3: Response
Phase 4: Evacuation
The evacuation process is initiated by receiving signs of a possible disaster. Subsequently the development of the hazard is observed. Collected data of the hazard are used to predict its occurrence, magnitude, time and location of the possible impact. If occurrence of the disaster has been predicted and the authorities decide to evacuate people that are present in the risk area, an evacuation warning is disseminated to notify the population at risk. Response is the reaction of a person on the evacuation warning. The time it takes for people to respond can greatly influence the overall evacuation time. People can decide to evacuate to a safe place outside the risk area or seek for shelters within the area. However, people may also take other (unintended) actions like continue working. Very important is the time that people need to decide to evacuate. Many factors affect this individual evacuation behavior (especially personal risk perception). Factors like experience, actual signs of the threat and the information disseminated by the authorities affect the leaving time (Gwynne, Galea, Owen, & Lawrence, 2002). Response time is defined as the time span between the warning receipt and the action performed by the individual at risk. The duration of phase 4, the actual evacuation, depends on the time it takes to evacuate the population.
2.1.4 Decision makers
A critical part of an evacuation plan, is the dedication of the authority to start evacuations. In the United States, the emergency response command structure differs in almost every state. By law, in most states have governors the ultimate authority to order evacuations. However, for emergency evacuations, governors delegate this authority to local-level officials. This can be the mayor, city councils, sheriffs, county judges, county presidents or fire officers. These officials have a better knowledge of local characteristics, can act faster and are better informed on current local conditions when disaster strikes. They are therefore authorized to start with evacuating without the formal approval from the governor, if lives are at stake (Urbina & Wolshon, 2003).
2.1.5 Evacuation types
As stated before, not a single evacuation will be exactly the same. Though it is possible to classify different types of evacuation. It is important to distinguish these different types during the development and planning of new strategies, since every one of them requires different actions for and expectations by both authorities and evacuees. There are several ways to make a difference between the types of evacuations. The following types are characterized by Frieser (2004), and are mutually distinguished by their time of occurrence :
Evacuation: removal of people before occurrence of the disaster (graph a) Flight: removal of people after occurrence of the disaster (graph b)
Evacuation and flight: the disaster occurs during the removal of people (graph c)
These different types are visualized in figure 4. In this figure, the course of the hazard has been depicted through a one-dimensional region (distance, vertical axis) as a function over time (time,
horizontal axis) (Frieser, 2004).
People will behave different in these types of evacuations. Before the disaster occurred, people tend to respond in a relative calm, not panic-like way to warnings of an impending disaster. Most people act in a rational way and are willing to obey the authorities. People will try to get to their self chosen destinations. When there is a flight, people tend to panic and act in a less rational way by following their instincts. They are less willing to obey orders from the authorities and their behavior could be considered as non-adaptive (Gwynne, Galea, Owen, & Lawrence, 2002). This has also got an impact on the actions that have to be taken by the authorities. To prevent the flight from turning into a uncontrollable massive flight, there are more officers and authorities needed that use their
power more strict by telling people what to do and were to go. Since people need to get as soon as possible out of an area, people won’t be able to use their self chosen destinations. They are to a certain extent forced to use other destinations or so called exit point. This has an impact on the transportation forecast since the distribution of trips between origins and destinations will change. (Han & Yuan, Global Optimization of Emergency Evacuation Assignments, 2006)
Another way of dividing different types of evacuations, is proposed by Urbina and Wolshon (2003). They describe evacuation types as voluntary, recommended or mandatory. The types differ in the magnitude of the hazard, the available time between the moment of prediction and occurrence of the disaster and required total evacuation time (Frieser, 2004) & (Urbina & Wolshon, 2003). These types are mostly known and understood by the public and therefore used to inform the people during hurricane evacuations in the United States of America:
Voluntary: The most vulnerable people are evacuated, others may remain if they choose. Recommended: Decisions to leave are left to individuals, and a few transportation
arrangements are made.
Mandatory: Maximum emphasis on encouraging evacuations and evacuation transportation plans go into effect. The authorities are responsible to make sure that everyone is able to leave the area or use a shelter.
In most cases a voluntary order is disseminated prior to a recommended or mandatory order. In the voluntary phase, people can decide for themselves whether they evacuate or not. Households are more likely to leave given a mandatory relative to a voluntary or recommended order. For example during a fire emergency in Ephrata, PA (USA) all people left town when they were ordered to do so. Prior to this mandatory evacuation, a recommended evacuation warning had been sent out to the people but only 21 percent of the civilians responded by leaving the town (Fischer II, Stine, Stoker, Trowbridge, & Drain, 1995).
During recommended evacuation, the trip generation shifts upwards in a more significant way. Almost all people that do not live in the area and are free to move, will leave during this evacuation phase. This includes groups of people that only visit or work in the affected area. It is known that people who live in the appointed area will stay as long as possible in their homes, although this depends on their type of home (for instance, people in mobile homes tend to leave earlier than others) and the type of disaster (Baker, 1991). Residents who hear recommendations about the evacuation in their area mostly understand that they are advisory, only 15 to 25 percent will be interpreting them as orders (Baker, 1991). Baker also found that officials disseminating evacuation notices sometimes unintentionally blur the distinction, causing a higher rate of respondents and therewith a higher trip production.
During a recommended evacuation a few transportation measures are made by the authorities, in a way to start taking control over the taken routes. The purpose is to get more control over the traffic assignment process. The freedom of action of the traffic is somewhat restricted. Parts of the inbound traffic are restricted and arrangements are made to provide transportation for low-mobility groups. They are taking measures to get more control about the traffic assignment, should the recommended evacuation turn into a mandatory evacuation. The department(s) of transportation will collect more information about traffic volume data on key routes and information about spotted congested and evacuation routes will be disseminated towards the public. Local shelters are opened for people who are not able to leave the area (Urbina & Wolshon, 2003).
2.2 Evacuation Strategies
An important part of the evacuation plan contains the actual evacuation strategy; how to get people out of the endangered area. Over the years, several traffic measures have been developed that can be issued by local or state authorities. Some require modifications on the network prior the emergency and some do not. But all of these measures can be part of the strategy that is developed within the evacuation plan with the aim to get as much people as fast and safe possible out of an endangered area. In this section several strategies that are known within the literature are being discussed.
Sinuany-Stern and Stern (1993) make a difference between strategies that reflect traffic measures, and strategies that differ because of their route choice mechanisms (Sinuany-Stern & Stern, 1993). The strategies known within the literature and the new strategy from Ashwin Arulselvan are briefly discussed. Also their expected influence on the transportation forecast will be discussed:
2.2.1 Evacuation strategies within the literature
With regards to the traffic management strategies and belonging traffic measures, Wolshon and Meehan (2003) explain possible fields of remedial actions. They sketch different areas that can be influenced in order to develop smoother evacuation plans. The areas that Wolshon and Meehan describe can also be found in the procedure for the development of evacuation plans as developed by Russo (2004) and presented in chapter 2.1.2.
2.2.1.1 Maximizing capacity
One of the areas that Wolshon and Meehan (2003) describe, is maximizing the potential capacity of the infrastructure. Within this area, there are several possible measures:
Elimination of crossing traffic flow: The crossing streams of traffic are a source of waiting times
and disturbances. In many urban networks, the intersections determine the capacity of the network. Crossing streams of traffic are a source of waiting times and disturbances and therefore they should be avoided (Cova & Johnson, A network flow model for lane-based evacuation routing, 2003)& (van Zuilekom & Zuidgeest, 2006). To get better results on the evacuation time, these crossing flows should be avoided as much as possible. Diverging traffic, the traffic that is coming from one area and using different exits, introduces a choice problem for drivers and thus problems for the local traffic management authority. Therefore, diverging traffic is ideally not allowed. Traffic flows should be converging rather than diverging. It is important to use appropriate capacity values at the exit points from converging routes, since it has great potential to become a bottleneck (van Zuilekom & Zuidgeest, 2006).
This measure will have impact on the distribution of the traffic over all the exit points. People are not allowed to choose their own exit points but are directed to a predefined destination. This measure will also impact the assignment of traffic over the network, since crossing flows are being avoided. This leads to other routes and the aim is to develop routes that generate fewer costs to the users. It is expected to positively influence the total travel time, but the methodology can lead to a larger overall distance traveled by the evacuees.
Contraflow: Contraflow, or reverse laning as it is also known, involves the reversal of the traffic
these segments. Termination points are critical because they move traffic from the reverse-flowing lane into the normal flow direction lane. With the decrease of capacity at these points, they largely influence the effectiveness of the contraflow operations (Lim & Wolshon, 2005). Lim and Wolshon (2005) advise to maintain all lanes through the termination point with split rather than merge designs. Also, it is advantageous to reduce the volume entering the termination point by maintaining exit points along the route. The study suggests that merge zones located after exits, instead of before them, and the use of channelization or separation devices well in advance of forced maneuvers can enhance the quality of the flow through the termination vicinity.
Contraflow affects different aspects in the transportation forecast. The extra capacity will make certain links become more attractive, since these links have a greater capacity and therefore produce lower costs for the users. This will have an impact in the trip distribution over the network, since during an evacuation people want to get as soon as possible out of the endangered zone. When a certain link has more capacity and helps people exiting the area faster, zones at the end of these links will probably attract more traffic than other zones. It will also have an impact on the trip assignment. The links with extra added capacity can carry more traffic without disturbing the users’ costs and thus the network equilibrium in a negative way. It is expected that more traffic is assigned to the links that uses contraflow than in normal conditions would occur.
Shoulder lanes: Instead of using inbound lanes for outbound traffic, also shoulder lanes can be
used. There’s a need for preparing these shoulder lanes for traffic, and it is usually only valuable for highways since there are almost no shoulder lanes on urban roads (Wolshon, Urbina, & Levitan, 2001)
This measure influences the traffic assignment since it makes it possible for certain links to carry more traffic without negatively influencing the network equilibrium.
Merging traffic: Another way to prevent delays on the road network, is to develop evacuation
routes where merging traffic is (mostly) avoided. This measure can have a great impact on the intersection capacity. The disadvantage of this measure is that less frequent merges and conflicts, lead to a higher value for the average shortest-distance-routing-plans (Cova & Johnson, 2003).
The avoiding of merging traffic, has impact on the assignment of traffic. The expectation is that there will be less congestion on the network and this will bring down the costs at converging links and therewith make certain routes more attractive.
costs can be saved since there’s no need to adjust intersections or signal timing programs. Another advantage of the officers is the better compliance from evacuees with the pointed directions, and so a better compliance with determined evacuation routes (Aved, Hua Ho, Hua, Hoang, & Hamza-Lup, 2006). Disadvantage is that it takes time to position officers at crucial intersections during an emergency evacuation.
In the transportation forecast, the traffic police will have about the same impact as the traffic signal timing. It affects the assignment of traffic over the network since the costs from certain routes will be reduced because of the more green time, and thus less delay they experience.
Traffic Signal Timing: Traffic signals can have a tremendous impact on the movement of urban
populations in an evacuation. A traffic signal is a device that trades off delays for safety, but at the expense of decreasing intersection capacity and creating overall delay. By developing special traffic signal systems that in case of an emergency apply more green time for evacuation routes, can greatly reduce the overall evacuation time (Chen, Chen, & Miller-Hooks, March, 2007). There are different strategies for these special signal timings programs. It is possible to develop and use pre-determined control plans, which are static to changes in demand. The other strategy is the use of actuated control plans, which uses real-time info and can respond to changes in demand (Hamza-Lup, Hua, & Peng, 2005). The predetermined and actuated traffic signal timing will have effect on the assignment of traffic over the network. Evacuees will choose routes that have minimal costs. When a certain route has more green time, their overall costs will be reduced and therefore the link with more green time attracts more traffic. The overall costs of busy routes will reduce since they experience less red signals.
2.2.1.2 Limiting demand
Instead of maximizing the capacity, measures can also be aimed at limiting the demand (Wolshon & Meehan, 2003). This will affect the trip generation within the classical transportation forecast and therewith the supply-demand interaction as described in chapter 2.1.2. In the literature review were four relevant demand limiting measures discovered:
Staged Evacuation: Staged evacuation, also known as phased evacuation or zoned evacuation, is another widely used control strategy to guide evacuation flows. Without changing the network geometry like contra flow design or enforcing route choice restrictions, staged evacuation aims to achieve more efficient network utilization mainly through a better distribution of evacuation demand over the allowable time window. It is expected that staged evacuation will reduce the so called “shadow evacuation”. Shadow evacuation occurs when people living outside the danger zones unnecessarily evacuate increasing congestion on roadways (Koutink, 2000). Officials issue evacuation orders at an earlier time to those zones with higher levels of urgency (e.g., with a shorter safety time window or with higher concentrations of hazardous chemicals) and start evacuating the low urgency zones some time later. This measure can effectively limit the surge in evacuation demand, reduce overall network congestion and, more importantly, avoid or at least mitigate potential casualty and stress levels caused by evacuees being blocked in more dangerous areas (Liu, 2007). It is critical that the evacuees comply with the evacuation order. Otherwise, the chance for chaos and a less arranged evacuation increase dramatically.
Road Closures: It is believed that the closure of inbound arterial streets to the emergency planning zone, can be a very effective measure. However, the effectiveness drops if the network is already congested when the evacuation starts (Kwon & Pitt, 2005).
The idea behind this measure is that it will diminish the generation of traffic. There will be fewer vehicles in the network since main inbound lanes are closed. Therefore it has a positive impact on the production of traffic within the considered network.
HOV-priority: HOV Priority refers to strategies that give priority to High Occupant Vehicles
(also called rideshare vehicles), including transit buses, vanpools and carpools. HOV Priority is a major component of many regional traffic demand management programs. Two, three or four occupants may be required to be considered an HOV, depending on circumstances. Also public transportation buses belong to HOV. This is opposed to Single Occupant Vehicles (SOVs). Experience indicates that the best way to quickly evacuate a large city is to give buses and perhaps other high occupancy vehicles priority in traffic and fuel access, and then accommodate as many low-occupancy vehicles as resources allow. Individuals can choose between accepting a free and fast bus ride, or driving a private vehicle and facing congestion delays (Victoria Transport Policy Institute, 2008).
This measure is expected to influence the traffic generation. Since people share vehicles, there will be fewer vehicles on the road and thus less traffic is being produced. The effect will be that fewer cars are needed to evacuate all people out of the emergency planning zone. It will also influence the modal split of evacuees; if busses or other public transportation are getting priority with evacuations, it is expected that more people will choose to use public transportation and thus another mode of transportation.
Maximum number of cars: This measure refers to the use of cars during an evacuation. It is
2.2.1.3 Improving communication
Another area that Wolshon and Meehan (2003) distinguish, are measures that effect the communication between transport management and evacuees. The most important measure that is part of this area, is the use of Intelligent Transportation Systems that can communicate with the evacuees and provide them with up-to-date information:
ITS: Dissemination of information to the motorists is one of the most important factors during any evacuation program. ITS technologies are strongly recommended in managing the evacuation program, they reduce delay due to diversion so more efficient traffic management can be achieved. There are different forms of Intelligent Transportation Systems:
o
Highway Advisory Radio: Maybe not as relevant for city evacuation, but this system disseminates information about current traffic conditions and route diversion by playing messages repeatedly on a radio frequency.o
Variable Message Signs: VMS are programmable traffic control devices that display messages of letters, symbols or both. These systems can be considered as the most effective visual aid and can provide motorists with all kinds of information and recommended or forced routes. They are flexible and provide real-time information.o
Interaction between cars:
New inventions make it possible for vehicles to interact witheach other. In case of emergency evacuation, they can update each other with current information about traffic loads, congestions, road blocks and accidents.
The use of ITS is expected to influence the distribution of traffic. People are informed about alternative exits. This means that people can change their destination towards a better reachable exit point. It will also influence the assignment of traffic over the network. Evacuees are informed about congestion and alternatives that are more effective given their travel costs. This means that the traffic is more effective spread over the network resulting in a lower evacuation time.
2.2.1.4 Multimodal Evacuation Strategy
2.3 Ways to evaluate strategies
When the evacuation plans are formulated, they need to be evaluated. It is important to analyze and test all the aspects of the plan, to make sure that when needed the evacuations take place in an (relative) organized and efficient way. To organize evacuations, strategies are being developed in the plan. These strategies need to be simulated to test their effectiveness. One way to test these strategies is with the usage of traffic simulation models. They also help practicing scenario’s and strategies by simulations, so that during a real evacuation the authorities know better what to expect and how to respond. The traffic simulation models can be used to evaluate evacuation plans in a laboratory environment, without the immediate need for real-time evacuations.
There have been many attempts to develop simulation models for use in evacuation planning and it is helpful to try to classify these as to understand the approach taken in different models. Over the past decade, a number of computer models have been developed to assist in emergency evacuation planning, for mitigating disasters ranging from nuclear power plant failures to hurricanes. Studies in the 1980s focused on evacuations due to the Three Mile Island incident that occurred in 1979 (Urbanik & Desrosiers, 1981). Much recent research has focused on hurricane evacuation, because a number of extremely devastating hurricanes have hit the U.S. in the 1990s, as well as in 2005 (PBS&J, 2000). After the 9-11 incident, there is growing concern about mass evacuation due to terrorist attacks (VDEM, 2005). All of the models are designed to simulate the way in which the demand uses the supply system, producing flows on network links that in turn generate travel costs. The approaches to simulate the interaction between supply and demand, can be divided in two classes, the static models and the dynamic models (Russo & Vitetta, 2004).
Static models use static transportation information or assume network link flows to be at steady states. Static models do not provide real-time traffic information or allow en route-dynamic routing. It assigns each trip, when loaded on the network to the best route at the time, although once en route vehicles do not have real-time information for rerouting. Most geographic-information-system-based models or static traffic assignment models fall into this category (Chiu & Mirchandani, 2008) & (Han & Yuan, 2006).
Dynamic models disseminate traffic conditions and routing information to enable drivers to select better routes to their destinations. Each evacuee will still proceed to a pre-assigned destination, perhaps via a better route (Han & Yuan, 2006).
To help evaluating the strategies within the evacuation plans, computer simulation models can be used. There are several models available, each with its own characteristics and capabilities. All of the available simulation models can be classified within the next three classes:
Micro-simulators: In micro-simulators, an attempt is made to track the detailed movement of individual entities in the network being simulated. These entities might be vehicles, such as private cars, buses or trucks. They might also be people, single or in groups. The idea would be that the entities are taken from the evacuation zones and then proceed to find their way to the safe destinations or martial control (Southworth, 1991).
Macro-simulators: These simulators make no attempt to track the detailed behavior of individual vehicles and they are based on equations which stem from analogies with fluid flows in networks. Some macro-simulators are relatively static in that they can only cope with steady state conditions, but this may not be adequate in the dynamic and sometimes chaotic, environment of an emergency evacuation (Southworth, 1991).
Macro-simulators can handle traffic on large networks and distances like highway traffic. There is no need to maintain the state information about thousands of individual entities, instead state variables are updated at intervals by dynamic state equations (Pidd, de Silva, & Eglese, 1996). Macro simulation technology does not attempt to track detailed behaviors of individual vehicles, they are based on equations that treat traffic as flows on networks (Chen, Meaker, & Zhan, 2006)
Meso-simulators: are a compromise between the two approaches discussed above and they usually involve a discrete simulation which tracks the movements of groups of vehicles. This approach evolved because of a need to find some way to reduce the computational demands inherent in a micro-simulation without losing the need for relatively detailed interactions (Pidd, de Silva, & Eglese, 1996).
2.4 Evacuation assessment studies
There have been studies that compared the effectiveness of different evacuation strategies. Sinuany-stern and Stern (1993) examined the sensitivity of network clearance time to several traffic factors and route choice mechanisms, in a radiological emergency situation. They examined the effects when interaction with pedestrians was modeled and what changes in intersection traversing time and car ownership meant for the results. They also examined the shortest-path and myopic behavior for the route-choice mechanisms. They found that evacuation time comes closer to reality when interaction with pedestrians and a uniform distribution of intersection traversing time are assumed (Sinuany-Stern & Stern, 1993). Curch and Sexton (2002) investigated how evacuation time can be affected under different evacuation scenario’s, such as opening an alternative exit, invoking traffic control or changing the number of vehicles leaving the household. They found that the opening of an alternative exit can have a great impact on the evacuation time. Also the invoking of traffic control is a measure with great benefits towards the needed evacuation time (Church & Sexton, 2002). Cova and Johnson (2002) applied agent-based micro-simulation to test neighborhood evacuation plans in an urban-wildland interface. They were able to assess the spatial effects of a proposed second access road on household in a very detailed way (Cova & Johnson, 2002). Batty et al (2002) described an agent-based model to simulate the changing of the route of annual Carnival event over two days each year. They demonstrated how congestion problems (mainly for
pedestrians) and problems over safety can be resolved by introducing traffic controls, like the
3 Description of cases
Two cases are build to test the strategies and their results under different circumstances. Both cases are build around the evacuation of the sold out football stadium at the University of Florida. This stadium accommodates about 90.000 people during most games. A lot of people travel all over Florida and other states to join the popular university football team. In normal conditions, a lot of people spend the night in Gainesville and travel homewards during the next day. Normally, some spectators leave before the game ends, and some will wait after the game ended before they leave. This results in a more spread and steady outgoing flow of the spectators than there will be in an evacuation situation. During evacuations, the exceptional situation will occur where everybody is forced to leave the stadium. This will lead to the situation were the flow will be maximum and the demand for traffic capacity exceeds the normal levels. Therefore, this situation is suitable for the assessment of the different strategies under extreme circumstances with a high demand and concentrated flows.
In both cases an emergency occurs that require the evacuation of the spectators out of the stadium. The stadium is expected to be sold out during the game which starts at the time of 12.30hr. At 14.00hr an emergency occurs that requires the evacuation of the people out of the stadium. It also requires the movement from the people towards their house in- or outside Gainesville. To limit this research, the evacuation of the whole Gainesville population is let out of consideration. It is expected that people are safe when they have reached their home. People who don’t live in Gainesville are forced to leave to the Gainesville area. This creates flows to destinations both inside Gainesville as outside the city.
In the scenario, the spectators can choose between two modes of transportation. The car and public transportation. Most other evacuation evaluating studies do not consider a multimodal evacuation problem. The cases will use special bus routes and frequencies that are used during game days.
3.1 Case 1: Evacuation traffic
3.2 Case 2: Evacuation and background traffic
The second case has been developed to test if the results in the first case, will be the same in the second one. In the second case, background traffic is considered. The implementation of background traffic will lead to more traffic flows on the network when the evacuation starts. Also, the directions of these flows will differ from the evacuating vehicles. It is expected that this will lead to more conflicts in the network. For the first two hours, the background traffic will flow into the network while the evacuees only flow outwards the network. It is expected that this will influence the effects from several strategies. But if the results of the first case are valid, they should hold up in the second case.
Due to restrictions of Corsim, it has not been possible to load the network with background traffic under normal conditions before the evacuation starts. This would be more ideal and closer to the reality but Corsim is not able to allow changes in the network during the simulation. For some of the strategies this is needed. For instance, contraflow needs adjustments of the lane characteristics. Corsim is not able to adjust these characteristics during the run. Therefore, background traffic starts flowing at the beginning of the simulation when the evacuation starts. After two hours, it is assumed that the incoming background flows are blocked by the police in order to clear the network. At this point, only outgoing flows will exist.
4. Simulation
In this chapter all information can be found that is related to the simulation. There will be explained which simulation program has been used, how it works and what its restrictions are. Further there will be explained which assessment criteria will be used and how the research and evacuation road network look like. Information about trip generation, distribution, the modal split, trip assignment and the output can be found in the last few paragraphs.
4.1 Corsim
4.1.1 How it works
The simulation program that has been used for this research is called CORSIM. CORridor SIMulation is a microscopic traffic simulation program. The ability to evaluate microscopically is unique in that microscopic models track individual driver behavior whereas macroscopic and (to a certain extend) mesoscopic models view all vehicles in the traffic stream as platoons exhibiting identical individual behavior characteristics.
CORSIM has been developed by the US Federal Highway Administration in association with the University of Florida. It is a computer model that has evolved over time from two separate traffic micro simulation programs, NETSIM and FRESIM. The combination made it possible to analyze complete systems, since NETSIM represents traffic on urban (surface) streets and FRESIM traffic on freeways. CORSIM is a stochastic model, which means that random numbers are assigned to drivers and vehicle characteristics and to decision making processes. The Measures of Effectiveness, MOEs that are obtained from a simulation are the result of a specific set of random number seeds. For example, one set of random number seeds may result in three very conservative drivers driving side by side on a three-lane road, blocking more aggressive drivers behind them. To gain a better understanding of the network performance, the network should be simulated several times using different sets of random number seeds (US Federal Highway Administration, 2003) & (Corsim Help). The seeds that can be randomized are the headway seed, the vehicle seed and the traffic seed.
In Corsim, each vehicle is defined by fleet (auto, carpool, truck or bus) and by type. There are up to nine different types of vehicles. A driver behavioral characteristic, is assigned to each vehicle. There are op to ten different types of drivers. Each vehicle behavior can be simulated in a manner reflecting real-world processes.
Each time a vehicle is moved, its position on the link and its relationship to other vehicles nearby are recalculated, as are its speed, acceleration, and status. Vehicles are moved according to car-following logic, in response to traffic control devices and in response to other more car or fleet specific demands. Congestion can result in queues that extend throughout the length of a link and block the upstream intersection, thus impeding traffic flow. Signal controls and the bus routes are explicitly modeled.
4.1.2 Model assumptions and limitations
4.1.2.1 Multiple runs
Corsim is a stochastic simulation model. Unlike deterministic analytical models, these stochastic simulation models are driven by samples of random variable from probability distributions. These random variables may have large variances. In general, the variation caused by these stochastic models can be reduced by using a longer simulation period and increasing the number of runs. Although Corsim has adapted a so called variance reduction technique, it still is necessary to run the network multiple times varying the random number seeds to gain an accurate reflection of the performance of the network. Corsim has a built in multiple run capability and a built in output processor. The multi run capability of Corsim runs the network multiple times changing the random number seeds for each run. The output processor collects data for the selected measures of effectiveness over multiple runs for the selected links. The data from the multiple runs is summarized and using this option accounts with the stochastic nature of Corsim. To account for the stochastic nature, Corsim can vary the headway seeds, vehicle type seed and the traffic seed. It still is necessary to calculate the number of runs needed for valid conclusions. (Corsim Help).
To obtain the minimal needed number of runs, the following formula is used (Strijbosch, 2006):
where: n = required number of simulation runs
za/2 = threshold value for a percentile confidence level σ = sample standard deviation
E = allowed error range
A level of confidence of 95 percent, creates a value for za/2 of 1,96. With a sample size of 10 runs for the discharge per link, the numbers of needed runs are calculated with an error range of 5 percent. Because of the high number of needed runs that were found using this margin of error, also the numbers of needed runs with an allowed error of 10 percent are calculated.
Required number of simulation runs
time to perform 15 runs of 10 hours, was about 4 hours. Corsim needs additional time to write the results to an Excel file. The total average running time for the first case strategies is about 6 hours. This will lead to a total running time of 22 hours. This running time has been too long, and therefore it has been chosen to work with 15 simulation runs in the first case.
The second case leads to more problems. Corsim needs more running time since in the second case background traffic is considered. This leads to more traffic in the network and thus a higher calculation demand. During a test run, it was found that Corsim needed for 15 simulation runs and a simulation time of 15 hours, 26 hours to calculate the results. This included the time Corsim needed to write the results to an excel file. Due to time restrictions, this running time is not considered to be feasible. Therefore, the second cases are analyzed by running each strategy 10 times with a simulation time of 12 hours. This resulted in an average calculation time of 11 hours.
4.1.3 Preparations for evacuation traffic
4.2 Assessment criteria
It is necessary to establish effective assessment criteria, to measure the influence from the different strategies on the effectiveness of the evacuation strategies. Most studies in the literature use the Total Evacuation Time or so called Network Clearance Time as the most important criteria. The Network Clearance Time is the time required for all evacuees to physically travel out the evacuation area. Kwon and Pitt (2005) used in their study the time needed to evacuate all people out of the area. To estimate the total evacuation time, they selected four outbound links located at the boundary of the selected evacuation area, and used the time-variant traffic flow rates from the output files. When the flow on these links was equal to zero, they said that at that time the emergency planning zone was evacuated. There is a need however to check if this flow equals zero as a result of no traffic or if it is the result from congestion. Also Jha et al (2004), Urbanik (2000) and Chen et al (2005 & 2006) used the total time to achieve a complete evacuation as the main performance measures to evaluate different scenario’s .
Apart from evacuation times, various performance measures for traffic conditions on the entire network have been considered for evaluating different evacuation operations. These include the number of congested links, the number of maximally utilized links, the origin-destination travel time, the total household travel time, the average speed, the density and the total delay during an evacuation (Sisiopiku, Jones, Sullivan, Patharkar, & Tang, 2004) & (Murrary & Mahmassani, 2003). Han et al. (2007) analyzed more measures of effectiveness like the loading time or loading delay time and delay of population before the onset of the evacuation process. They analyzed different measures of effectiveness and concluded that Total Evacuation Time, Total Travel Time, Individual Exposure Time, Time-Based Risk and Evacuation Exposure are useful performance measures (Han, Yuan, & Urbanik, 2007).
There are more measures to test the effectiveness from different strategies. In CORSIM it is possible to get the total travel time on the network for all vehicles. It is also possible to see the total delay time or the delay time per travel hour. Another way to assess the strategies is by analyzing the number of vehicles that have been discharged from the exit links since the beginning of the simulation. It can also be interesting to check the queue delay per vehicle or the control delay per vehicle, to assess different ‘intersection-strategies’.
means that in this scenario more people are for a longer period exposed to the threat. Since the results of drivers that actually evacuate differ between the scenarios, the average total travel time per vehicle is used as the second assessment criteria.
Besides these two main criteria, there will be looked at other factors. These factors can give which indicates a better traffic handling within the network
Average Total Travel Distance (in miles per vehicle)
The lower this number, the lower is the distance that people need to travel from their origin to their destination which indicates a better traffic handling and thus a better performance by the strategy.
Average Travel Speed (in miles per hour)
The higher this number, the faster people can travel and the better the free flow speed is used. If the average travel speed comes closer to the average free flow speed, it indicates a higher level of service and a better level of traffic handling.
In the first case, where background traffic is let out of consideration, all of these criteria can be obtained and used to analyze the handling quality of the network. However, in the second case not all traffic is cleared from the network within the analyzed time period. This results in the uselessness of several assessment criteria. For instance, the evacuation time is no longer a usable criteria. Instead of the evacuation time, the second case will use the number of cars evacuated after twelve hours as the main criteria. This makes it possible to compare the results and effectiveness of the different strategies since it is expected that a more efficient strategy will clear the traffic faster, and thus evacuated more vehicles after twelve hours.
Also, it has not been possible to use the average total travel distance as an assessment criteria during the second case. This because the number of vehicles that have left the network and are on the network, will not be the same for each strategy. This makes it unfair to compare the different strategies by the total travel distance. Therefore the following criteria will be used to compare the strategies, in the second case:
Evacuated vehicles (number of cars that have left the network after twelve hours) Total Travel Time (in hours)
Delay time ratio (in delay time per travel hour)
4.3 Research Area
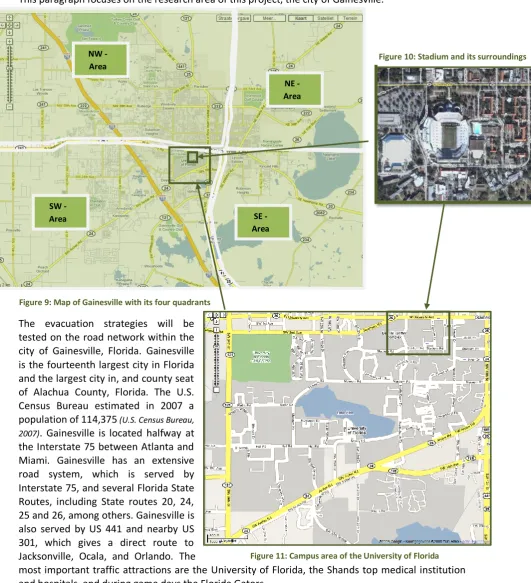
This paragraph focuses on the research area of this project, the city of Gainesville.
The evacuation strategies will be tested on the road network within the city of Gainesville, Florida. Gainesville is the fourteenth largest city in Florida and the largest city in, and county seat of Alachua County, Florida. The U.S. Census Bureau estimated in 2007 a population of 114,375 (U.S. Census Bureau, 2007). Gainesville is located halfway at the Interstate 75 between Atlanta and Miami. Gainesville has an extensive road system, which is served by Interstate 75, and several Florida State Routes, including State routes 20, 24, 25 and 26, among others. Gainesville is also served by US 441 and nearby US 301, which gives a direct route to Jacksonville, Ocala, and Orlando. The
most important traffic attractions are the University of Florida, the Shands top medical institution and hospitals, and during game days the Florida Gators.
The city's streets are set up on a grid system with four quadrants (NW, NE, SW and SE). The quadrants are roughly sketched in figure 9. All streets are numbered, except for a few major thoroughfares which are often named for the towns to which they lead (such as Waldo Road (SR 24), Hawthorne Road (SR 20), Williston Road (SR 121), Archer Road (also SR 24) and Newberry Road (SR 26). In addition to its extensive road network, Gainesville is also served by Gainesville Regional Transit System, or RTS, which is the fourth largest mass transit system in the state of Florida.
Figure 9: Map of Gainesville with its four quadrants
SW -
4.4 Evacuation road network
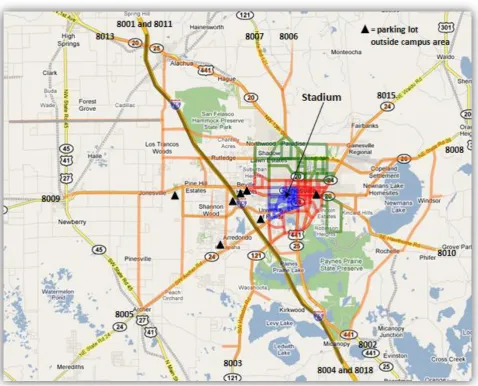
The modeled network is build around the Benjamin Franklin Football Stadium at the campus of the University of Florida. Since the scenario is build around the evacuation of the football stadium, the campus has been modeled with more detail. All connecting lanes have been included in the modeled network. The campus area is represented by the blue lines in the figure above. The areas directly around the campus are modeled with less detail and the modeled roads are represented by the red lines. These areas include some main streets and the downtown area of Gainesville. The green areas represent roads in some main living areas. In these areas only main streets are modeled. The smaller interconnecting lanes that are present in these areas are left out of consideration. The orange lines represent main streets in the outsides of the city. Most of them lead towards the exit roads or are the modeled exit lanes. Almost all of the outgoing streets present in Gainesville have been modeled. Another important exit point is the Interstate that runs through the city. This interstate and its ramps have been modeled in the network. The interstate is represented by the black line that can be seen in figure 12. In appendix 18 can be seen how the network looks in Corsim.
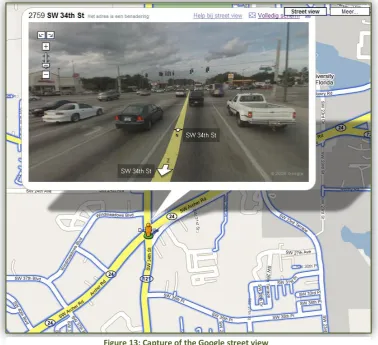
An important part is how the intersections are modeled. For the modeled network, all intersections have been checked using street view images from Google maps. In this way it was possible to check how many lanes are present in each street and which intersections were controlled by traffic signals, stop or yield sign or did not have any form of control. The use of these images also made it possible to estimate the number of pocket lanes and their length at each intersection.
For the free flow speed, a standard Corsim value of 30 miles per hour has been used. This value has been adjusted when, using street images from Google maps, it was observed that 30 miles per hour was too high or too low. For the interstate, the value has been adjusted to the maximum free flow speed allowed in NETSIM, 65 miles per hour.
To model the signal control schemes, some basic rules provided by the Florida Department of Transportation have been used. The main congested directions had an increased green time opposed to other directions. To establish these main lanes, maps provided by Google have been used. An image of how the network looks in Corsim can be found in appendix 18.
It is useful to give more information about the modeled traffic lights. It has been observed that in the modeled network, 106 intersections are controlled by traffic lights. It has been tried to obtain information about the actual signal schemes. However, it has not been possible to implement the real signal schemes into the network. Instead, a few basic guidelines that are provided by the Florida Department of Transportation are being used to design the signal schemes (FDOT, 2007). In general, the images of Googleview have been used to find out which directions are expected to carry more traffic and have more green time in the real world. This will be sufficient enough to compare the different strategies and their effect on the base case.
4.5 Behavior parameters
Gwynne et al. pointed out that people behave different during evacuations than under normal conditions. Therefore, the standard behavior parameters used by Corsim, are adjusted. In this way, it is tried to model a more realistic driver behavior that will exist under emergency situations. It is expected that the cautious drivers will be influenced more in their behavior than the already more aggressive drivers. Since it is an evacuation before the disaster strikes, people will still behave in a relative rational way. This reduces the need for major adjustments. Still, people will be more stressed and accept to take more risks in order to get out the area as quick as possible. However, it is not expected that the modeled evacuation needs parameters that will cause a massive flight and uncontrollable behavior. The standard and adjusted values can be found in appendix 3.
4.6 Trip generation
This is the so called first step in the conventional four-step transportation forecasting process. It predicts the number of trips originating in or destined for a particular traffic analysis zone. In other words, during the traffic generation trips generated and attracted by each zone are defined (Maarseveen, 2007).
4.6.1 Trip production
Gainesville is known about the University of Florida and also accommodates the stadium for the University football team, the Florida Gators. The cases that are going to be used are built around the evacuation of this stadium. The stadium has a capacity of about 90.000 seats, and thus the cases will deal with an evacuation population of 90.000 people.
In both cases, the evacuation of the stadium is considered as the main source for the production of evacuation traffic flows. The parking lots that are being used during game days are considered as the origins of the traffic. In total, 27 parking lots are modeled in the network. Twenty parking lots are located at the campus area and seven are located around the city. The parking lots outside the campus area can be observed in figure 12. The locating of the modeled parking lots at th