Flood Damage Map
for the Huong River Basin
Based on inundation depths, land use types and population density,
using depth-damage curves, maximum damage values and
depth-mortality curves.
Jorik Chen, December 2007
Flood Damage Map for the Huong River Basin – Bachelor Thesis Jorik Chen - s0065552 - 13th of December 2007
University of Twente, The Netherlands Faculty of Constructing Sciences, Civil Engineering Tutors: Dr. J.L. de Kok Dr. M.S. Krol Ir. J.A.E.B. Janssen
Hanoi University of Science (VNU)
Bộ môn thủy van Faculty of Hydro-Meteorology and Oceanography, Department of Hydrology Tutors: Dr. Nguyen Tien Giang Assoc. Prof. Dr. Nguyen Hun Khai
Abstract
In the last decade, the basin of the Huong River has been flooded several times causing damage all over the Thua Thien Hué Province. These floods are initiated by tropical storms which are accompanied by heavy rainfall. Economic and social consequences are significant and should be restricted in the future. This assignment contributes to creating an insight in the consequences, by developing a damage map based on inundation depths and the land use in the Huong River Basin.
At the Vietnam National University of Hanoi, HEC-RAS software has been used to develop a model for inundation depths. Applying the discharges of the November 1999 flood in the Thua Thien Hué Province, an inundation map is created that is used as input for this assignment. Together with a damage function and spatial data about the settlements, the infrastructure and the agriculture, the damage map is created.
The damage function consists of depth-damage curves and maximum damage values which are compatible to the several land use types. These are collected from preliminary damage assessments and literature concerning damage functions. The damage is calculated per land use type by multiplying the damage factor derived from the depth-damage curve with the maximum damage for the particular grid cell.
The HEC-RAS inundation map that is used as input for the damage map, is compared with an observed inundation map of the November 1999 flood. The HEC-RAS model seems to be insufficient to simulate the inundated surface, but the data within its prediction of the inundated areas are qualitative more significant: 26 percent of this data is similar to the observed data.
Also the accumulated damage of the resulting damage map is compared with the existing data of the November 1999 flood. The total damage based on the damage map corresponds reasonably with the reported damage in November 1999. Determining the damages and inundation surface per land use, it can be concluded that the rural settlements suffer most in case of a flood. This land use type should obtain the most attention for reducing flood consequences since it has great vulnerability for flooding and the fact that it is often located in heavily inundated areas.
Acknowledgements
During this assignment in Vietnam I met many people that made my stay abroad besides an interesting assignment also a beautiful experience.
I’d like to thank Michiel for his accompany in Hanoi and surroundings. Our shared interests have made life in Vietnam fun, especially our motorbike trips through the Hanoi traffic towards another unique experience was joyful. At the faculty, during dinner, exploring the city, cruising to Hué, playing chess, drinking sinh to, we’ve had a lot of fun!
Dr. Giang made my assignment possible and besides becoming a father, having no sleep, being the busiest person in Hanoi and carrying huge responsibilities, he was able to make time for me. I have incredible much respect for his ability to do everything and I wish him extremely much luck and happiness with his wife and daughter.
Dr. Ahn was available to explain whatever I wanted to know about everything, and his care about Michiel and me was truthfully. I enjoyed his cordiality and his commitment. I know for sure that with his commitment, he is able to reach the World Cup with just the Faculty-team! I want to thank Thuy and Phuong for their efforts and availability for my questions in the early beginning of my assignment. Further on, Mrs. Lieu and Mr. Tuyet have not only accommodated me perfectly, their concern was touching and very sweet. Mrs. Lieu, you serve the best spring rolls of Vietnam!
All the friends I made in Hanoi were unbelievable kind to me and showed me the Vietnamese life that is unreachable for a common foreigner. Trang, Nhug, miss Hanoi Post, Quyen, thanks for your kindness and open-heartedness. Dung was always available to do great things in and around Hanoi and has introduced me to motorbike riding and the difficult life of a Vietnamese student. We’ve laughed a lot, I’m glad I met you.
Off course I want to mention the efforts of Judith and Maarten to take over the responsibility of Luc, their comments helped me much creating my report. At last I want to wish Jean-Luc good health, since an accident unfortunately let him be capable to only supervise the first stage of my assignment.
Jorik Chen,
Table of Contents
CHAPTER 1. INTRODUCTION
1
1.1.
G
ENERAL INFORMATION ABOUTH
UONGR
IVERB
ASIN1
1.2.
P
RELIMINARY RESEARCH1
1.3.
A
IM OF THE RESEARCH2
1.4.
R
ESEARCH QUESTION2
1.4.1. Sub questions 2
CHAPTER 2. METHODOLOGY
3
2.1.
D
AMAGE MAPPING3
2.1.1. Approach damage mapping 3
2.1.2. Input 3
2.1.2.1. Land use 4
2.1.2.2. Inundation map 5
2.1.3. Damage functions 5
2.1.3.1. Availability damage functions 5
2.1.3.2. Damage function households 7
2.1.3.3. Damage function infrastructure 9
2.1.3.4. Damage function agriculture 10
2.1.3.5. Damage function forest 11
2.1.3.6. Implemented functions and variables 12
2.2.
M
ORTALITY ESTIMATION13
2.2.1. Input 13
2.2.1.1. Population density 13
2.2.1.2. Inundation map 14
2.2.2. Mortality function 14
2.3.
V
ALIDATION15
2.3.1. Validation of results 15
2.3.1.1. Total economic damage 15
2.3.1.2. Total fatalities 16
2.3.2. Validation HEC-RAS inundation map 16
2.3.2.1. Spatial comparison 16
2.3.2.2. Qualitative comparison 16
2.3.2.3. Depth line comparison 17
CHAPTER 3. RESULTS
18
3.1.
E
CONOMIC DAMAGE18
3.1.1. Damage map 18
3.1.2. Validation damage map 19
3.2.
M
ORTALITY20
3.2.1. Mortality map 20
3.2.2. Validation mortality map 21
3.3.
V
ALIDATION INUNDATION MAP21
3.3.1. Spatial comparison 21
3.3.3. Depth line comparison 22
CHAPTER 4. CONCLUSIONS
24
4.1.
C
ONCLUSION24
4.2.
D
ISCUSSION24
4.3.
R
ECOMMENDATIONS26
REFERENCES
27
ATTACHMENTS
I
A
TTACHMENTA:
L
ITERATURER
EVIEWI
Damage functions I
Research in the Huong River Basin III
In
Hué, from which it leads to the South Chinese Sea. The Huong River and its lagoons are situated in the Thua Thien Hué Province. Much of this province’s infrastructure and industry lies in the coastal plain and most of the population live within 25 km of the coast. This area has a small slope and the Huong River and its tributary streams meander through populated and agriculture area.Figure 1.1: Location of the Thua Thien Hué Province
The Thua Thien Hué Province has a tropical monsoon climate and is affected by annual tropical storms. These typhoons usually develop in the Northwest Pacific and follow a path over the Philippines, cross the South Chinese Sea and when they land on the Vietnamese coast they loose force, releasing their water over this coastal zone (Vermue, 2006). This causes heavy rainfall up to 1000 mm per day and high wind velocities. Because the Huong River Basin is very flat in the coast area and the basin has no sufficient hydraulic structures to handle this amount of rainfall, the river frequently floods.
In November 1999 disaster floods struck eight provinces in Central Vietnam and the Huong River inundated 90 percent of the lowlands of the Thua Thien Hué Province. This flood lasted for one week, broke five new floodgates and created a new river mouth near the lagoon. Nearly a million homes were damaged of which more than 40 thousand were destroyed. Seven hundred people were killed and the flooding caused 265 million USD of damage plus almost 500 million USD of economic losses. (Reliefweb – Red Cross, 1999)
The November 1999 flood is not the only of its kind. Disasters due to flooding are common in this area and keep causing heavy damage and keep taking lives. Measures against flooding are necessary, but are difficult to implement due to the flat area, the extreme heavy rainfall and the little knowledge about the hydraulic behaviour of the system.
1.2. Preliminary research
In
tr
o
d
u
c
ti
o
n
1.3. Aim of the research
Due to the typhoons that regularly land at the Thua Thien Hué Province of Vietnam, the basin of the Huong River regularly floods. The population and the economy of the province suffer of the consequences of these floods. These consequences exist of economic damage and the fatalities due to flooding. This should be reduced and that is possible in two ways. First, all the effects can be minimized by hydraulic measures that prevent the river of flooding. Second, the consequences can be reduced by increasing the awareness concerning the effect of a flood. A damage map based on the predictions for a flood can be of help in both ways.In the first way, a damage map gives an overview of the areas that would be heavily damaged in case of a flood. This gives the ability to create insight to the areas that have a high priority for implementing flood prevention measures. In the second way, the local population is given a clarified insight into the dangers that the river brings, so they can prepare themselves and their assets for a flood. The government can use a damage map or its characteristics to focus her attention to the areas that would suffer heavy damages. For this second method, the spread of fatalities due to a flood can also be of use, so besides a damage map a mortality map is to be created.
Finally, an estimate of the accuracy of the results is to be made.
1.4. Research question
This assignment has been done using the inundation depths modelled by HEC-RAS software with the discharge of the November 1999 flood. This information is the foundation to create a damage map and a mortality map for the Huong River Basin. This has been done following the central question stated below. The sub questions have helped to answer the research question.
“How can economic damages and mortality in case of flooding in the Huong River Basin be simulated accurately, based on the HEC-RAS inundation depths?”
1.4.1. Sub questions
“Regarding the characteristics of the Huong River Basin, how can a function for economic damage be described?”
“Regarding the characteristics of the Huong River Basin, what concepts for mortality can be used?”
“How can the reliability of the economic damage model and mortality model be estimated based on the reliability of their inputs?”
M
“Regarding the characteristics of the Huong River Basin, how can a function for economic damage be described?”
2.1.1. Approach damage mapping
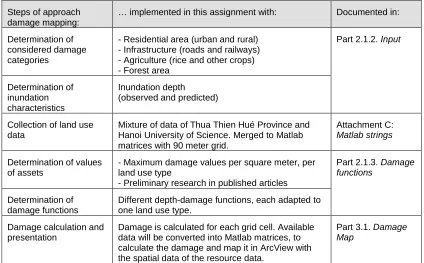
Damage mapping of flood risk areas is of great value for the decision-making concerning vulnerable areas, and therefore it is already done by many governments and scientists. This causes a large amount of available literature about damage mapping, see Attachment A: Literature Review. The useful literature is selected and this provided an approach for the damage assignment, see Attachment B: Approach economic damage. This resulted in the approach as stated in table 2.1. The damage mapping itself is documented in part 2.1 Damage mapping. The results are described in chapter 3.
Steps of approach damage mapping:
… implemented in this assignment with: Documented in:
Determination of
Mixture of data of Thua Thien Hué Province and Hanoi University of Science. Merged to Matlab
- Maximum damage values per square meter, per land use type
Damage is calculated for each grid cell. Available data will be converted into Matlab matrices, to calculate the damage and map it in ArcView with the spatial data of the resource data.
Part 3.1. Damage
Map
Table 2.1: Damage assignment approach in this document
2.1.2. Input
M
e
th
o
d
o
lo
g
y
2.1.2.1. Land use The land use data is obtained by the Hanoi University of Science from the government of the Thua Thien Hué Province. The data covers the whole province, but only the data of the flooded area is displayed, since the data outside the flooded area is not necessary to use. The data has been converted to ESRI files to view the data in ArcView software and to convert it to ASCII-files with a 90 meter grid. In figure 2.1, the map is displayed with all the land uses that are used for the damage mapping. The location of the left lower corner of the land use figure is longitude: 758.628.434 and latitude: 1.804.480.528. The total distance between the top and the bottom of the figure is 38,9 km.Figure 2.1: Available land use data in the Thua Thien Hué Province
M
e
th
o
d
o
lo
g
y
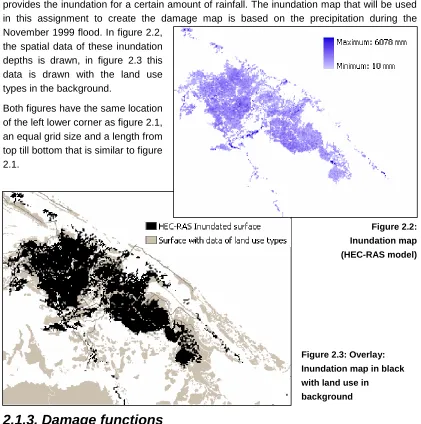
2.1.2.2. Inundation map The inundation depth map created by the HEC-RAS model of the Huong River Basin provides the inundation for a certain amount of rainfall. The inundation map that will be used in this assignment to create the damage map is based on the precipitation during the November 1999 flood. In figure 2.2,the spatial data of these inundation depths is drawn, in figure 2.3 this data is drawn with the land use types in the background.
Both figures have the same location of the left lower corner as figure 2.1, an equal grid size and a length from top till bottom that is similar to figure 2.1.
Figure 2.2: Inundation map (HEC-RAS model)
Figure 2.3: Overlay: Inundation map in black with land use in
background
2.1.3. Damage functions
Since only the inundation depth and a collection of land use types are available, a damage function should be applied with these two characteristics as input. In this section, first the available damage functions for this damage assignment are determined. Then the used damage function will be described per land use type, including the dept-damage curves and the maximum damage values.
2.1.3.1. Availability damage functions
Many relative depth-damage functions exist in the literature to calculate the economic damage (ED, in USD/m2). This type of function is based on a the damage factor (α, no dimension) derived from a depth-damage curve dependent on the inundation depth in meters, multiplied by a maximum damage value (Dmax, in USD/m2). The depth-damage curve and the maximum damage value are both determined per land use type. The depth-damage curve represents the vulnerability of a concerning object or asset when it is flooded, by a relation between inundation depth and the resulting damage as a fraction of the maximum damage. This maximum damage value is identified by the loss value in case the object or asset is fully flooded.
M
y
Because the depth-damage curve and the maximum damage value depend strongly on the characteristics of the object or asset, a damage function should not be simply taken over from a preliminary research. The characteristics of the objects and assets in the Huong River Basin differ from the characteristics in these researches. Therefore, the most effective method to retain relatively accurate damage functions is to look for damage assignments that have been done in the Vietnam area. Whenever these damage functions do not exist for certain types of land uses, it is not possible to create this function due to lack of time and knowledge. In this case, a damage function from preliminary research will have to be used, taken into account the consequence that the function may not fit the subject and the result is not accurate.Available depth-damage curves
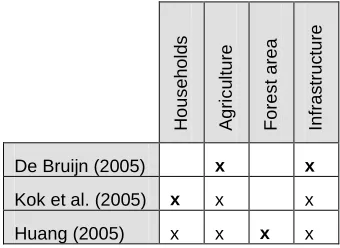
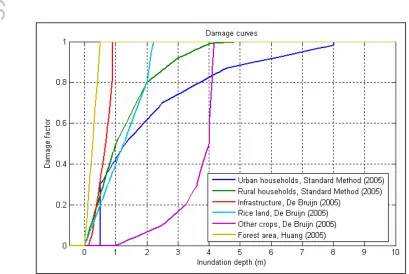
Considering the depth-damage curves that are developed for assignments in the Vietnam area, De Bruijn (2005) is a useful resource. Since this research only concerns agriculture, and infrastructure, more damage curves are needed for the other land use types. As presented in the Literature Review (see Attachment A), no other depth-damage curves have been developed for Vietnamese areas. Only the depth-damage curves of the thesis of Huang (2005) and the Standard Method of Kok et al. (2005) are available from the acknowledged research. The Standard Method is developed in The Netherlands for Dutch applications, the curves of Huang are for an area near the German river
Elbe. Further on, only for the Standard Method the foundations of the maximum damage value are known. For that reason the damage curve of Kok et al. is used rather than the damage curve of Huang. In table 2.2 the available damage curves are presented per land use this assignment has available. The bold crosses mark the damage curves that will be used in this assignment.
Table 2.2: Available depth damage curves per land use
Available maximum damage values
The applied maximum damage value exerts the greatest influence on the accuracy of the damage function. Also, this value will be very different in the Vietnamese situation compared to the western situation for which the damage function is developed. So it is important that the applied maximum damage values are taken from local damage assignments or Vietnamese databases. It would be even more accurate when the maximum damage value is linked to a depth-damage curve in the same assignment. Then the combination is reliable to use in this assignment. If such data is not available for a land use, it is to be reconstructed using the
Indirect damage production loss: Added value from surroundings of flooded area
Table 2.3: Reconstruction of maximum damage value, per subject (Kok et al, 2005)
De Bruijn (2005) provides for the agriculture and infrastructure depth-damage curves with the
M
y
corresponding maximum damage values for the Mekong Delta, Vietnam. All this data will be used because it is very useable for this assignment. Concerning forest area, only the data of CRUEIP (2003) is available. This data concerns the replacement rates for six towns in Central Vietnam. Gupta et al (2004) did an assignment in an area nearby the Huong River, but for the households and the rice paddy she provides only the average damage, which is useless considering the definition of Kok et al of the maximum damage value. Gupta et al do provide the rebuild costs for the road, but this significance is overtopped by De Bruijn. In table 2.4 the bold crosses mark the maximum damage values that will be used in this assignment.Table 2.4: Damage values per land use, per resource
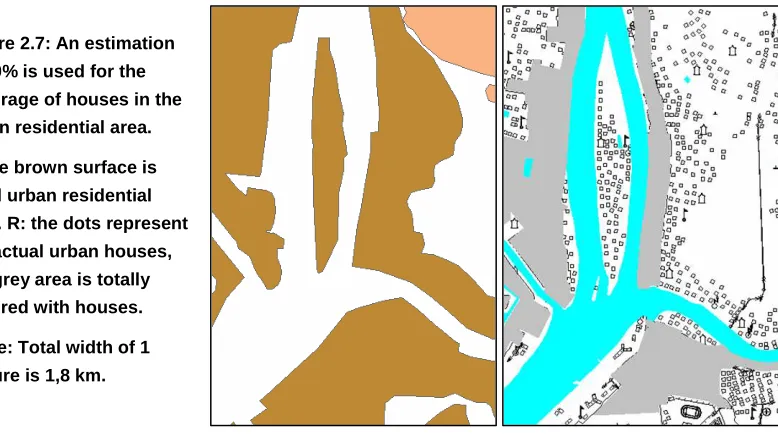
For the households various data is available. Vietnam Disaster Prevention (VDP, 2004) provides the average house value in a few communities in the Thua Thien Province, based on a field study. The document of the Asian Urban Disaster Mitigation Program (AUDMP, 2001) provides the average construction costs in the Thua Thien Hué Province, based on the study of Disaster Workshop France. Unfortunately, the original data of this study is not rise buildings (two main floors), middle-rise buildings (four main floors) and high-rise buildings (six main floors). A visit to the city of Hué and its surroundings made clear that the urban residential area nowadays includes mostly four level buildings, while in the rural residential area houses with one or two main floors are common. So for the urban residential area the middle-rise building curve will be used and for the rural residential area the low-rise building curve will be used as the depth-damage curve. The used curves are shown in figure 2.11. Using these curves, two assumptions have been made that need some explanation.
Figure 2.4: Houses in the urban area of Hué
First, an assumption is made concerning the proportion of the damage of the building to the loss of the assets within the building. The Standard Method uses the Dutch proportion to AUDMP (2001) average construction cost (49 m-2) x
M
e
th
o
d
o
lo
g
y
develop the curve. These circumstances can be different in Vietnam, but this assignment assumes that this damage proportion is similar. Second, in the Standard Method thedepth-damage curves come with a critical water speed that affect the damage factor. When inundation comes together with water speeds above this critical point, buildings can collapse and the damage factor will be 1,0. The water speeds for the Huong River Basin are not known, so the depth-damage curves that are used and displayed are not affected by the water speeds.
Figure 2.5: Houses in the rural area around Hué
Extra factors
The used curves for the damage factor are based on the sum of the direct damage, the direct damage due to production loss and the indirect damage. Since these aspects overlap, the Standard Method applies a reduction factor of 0,75 (Kok et al, 2005). This factor (γ) will also be implemented in this assignment.
In figures 2.6 and 2.7 it becomes clear that the area for urban residents and rural residents is not completely covered with buildings. A factor (β) is used to correct this information. 40% will be used for the urban residential area, 20% will be used for the rural residential area.
These two factors are implemented by using the following function, in which ED is the economic damage in USD/m2, α is the damage factor for the households that is dependent on the inundation depth in meters (d), Dmax is the maximum damage for households in USD/m2, γ is the reduction factor and β is the surface factor.
Economic damage for households:
ED
Households=
α
(
d
)
⋅
D
max⋅
γ
Rductionfactor⋅
β
SurfacefactorM
Since the damage curve of the Standard Method of Kok et al. (2005) is used, the maximum damage value can be developed with the foundations used in this Standard Method. As shown in table 2.1, the maximum damage values for a household are based on the rebuild costs for objects and the replacement value for the assets inside the house.
Table 2.4 shows the four available resources for the necessary data. According to VDP (2004), the house value is 28 USD/m2 (for an average surface of 32 m2). According to the database of AUDMP (2001), the construction costs (for an average surface of 49 m2 per building) are 16 USD/m2. So the house value of VDP is 175 % times the construction costs of AUDMP. This implies that the VDP calculated an house value that is based on construction costs plus the assets in the house. The amount of 28 USD/m2 is similar to the replacement value of 29 USD/m2 that CRUEIP (2003) rates for stone houses that are build to last up to 20 years. This type of houses is most common in the urban area of the Thua Thien Province. In the rural area, wooden houses with a shorter life estimation are more common, which CRUEIP values at 22 USD/m2. So a value of 29 USD/m2 should include the damage value of a house with its assets and is used as maximum damage value for houses in the urban residential area. For the rural residential area the value of 22 USD/m2 is used as maximum damage value.
2.1.3.3. Damage function infrastructure
Damage curve
In the thesis of De Bruijn (2005), a damage curve is developed for roads and railways in the Mekong Delta. This curve is similar for different types of roads, and the variety of the maximum damage values distinguishes the highways, provincial roads and railroads. The damage to rural roads is neglected since no maximum damage value for this type of road is known.
Extra factor
M
y
the average length of a road through a cell, and the surface of this cell. The formula for this factor (ε) is provided in figure 2.8. The factor is implemented in the following damage function, in which ED is the economic damage in USD/m2, α is the damage factor for infrastructure depending on the inundation depth d, Dmax is the maximum damage for the specific infrastructure (in USD/m2) and ε is the conversion factor.Damage function for infrastructure: This factor will be applied to all the infrastructure land uses.
Maximum damage value
The maximum damage values that are used in the thesis of De Bruijn, do not need to be adapted because they are developed for a Vietnamese situation. Only the variable market-value can have an effect to the maximum damage market-value, that is not taken into account in this assignment. The maximum damage value of the provincial road is 80 USD/m, the maximum damage value of the national road is 400 USD/m and for the railway the maximum damage value is 1000 USD/m.
2.1.3.4. Damage function agriculture
Damage curve
In Vietnam, many types of rice farming systems and rice varieties are used, depending on soil type, elevation, flood frequency, flood depth and flood duration. The varieties in Vietnam can be categorized into three main groups: Wet season rainfed rice, wet season deep water rice and dry season recession rice. The dry season recession rice is manually inundated on a regular base, but not always (like deep water rice) or never (like rainfed rice). De Bruijn (2005) developed three damage curves for the mentioned rice types in the Mekong Delta. In the rice land of the Huong River Basin mainly the dry season recession rice is cultivated, therefore the damage curve for this rice type is used. It is assumed that all the rice land in this area is of the same rice type, so the damage curve (plot in figure 2.11) will be used for the whole area.
M
e
th
o
d
o
lo
g
y
damage characteristics as the rainfed rice, since De Bruijn uses this damage curve also for other crops in the Mekong Delta in her own assignment.Figure 2.10: A recession rice field in the end of the wet season.
Maximum damage value
The depth-damage curves that Bruijn made for the agriculture in the Mekong Delta, come with maximum damage values for the particular crops. For the dry season recession rice she uses a maximum damage value of 440 USD per hectare, for the other crops than rice she uses a maximum damage value of 200 USD per hectare. These values are implemented in this assignment and are shown in table 2.5.
2.1.3.5. Damage function forest
Damage curve
Since only one depth-damage curve is available in the literature for the forest area (see table 2.4), this curve will be used in this assignment. The thesis of Huang (2005) provides the damage curve as shown in figure 2.11.
Maximum damage value
M
e
th
o
d
o
lo
g
y
2.1.3.6. Implemented functions and variablesFigure 2.11: Used depth-damage curves
Used maximum damage value
Resource characteristic Extra factors
Urban area 29 USD/m2 Construction costs & Asset value
Surface factor: 0.4 Reduction factor 0.75 Rural area 22 USD/m2 Construction costs &
Asset value
Surface factor: 0.2 Reduction factor 0.75 Provincial road 80 USD/m Construction costs Conversion factor: 1/75 National road 400 USD/m Construction costs Conversion factor: 1/75 Railway 1000 USD/m Construction costs Conversion factor: 1/75 Rice 0,044 USD/m2 Maximum damage value
Other crops 0,02 USD/ m2 Maximum damage value Forest 0,84 USD/m2 Replacement value
M
e
th
o
d
o
lo
g
y
2.2. Mortality estimation
“Regarding the characteristics of the Huong River Basin, what concepts for mortality can be used?”
Mortality is dependent of many variables, like evacuation time, evacuation possibilities, water rising speed, water depth, velocity of the water and average repetition time of the flood. For the Huong River Basin the only available information for calculating the number of casualties, is the spatial data of the water depth and of the density of the population. Concepts for simulating the number of fatalities over the area have been searched, that have the inundation depth and the density of the population as input. The only article containing a depth-mortality curve is an article of Jonkman & Asselman (s.a).
Jonkman & Asselman (s.a.) derived depth-mortality curves from the information on the 1953 flood in The Netherlands. This function is not verified on its validity for the Huong River Basin, but may give an indication about the casualties due to a flooding. When this depth-mortality curve is applied to the November 1999 flood data of the Huong River Basin, the number of total simulated casualties can be validated with the total amount of fatalities due to that particular flood.
2.2.1. Input
2.2.1.1. Population density
The data of the population density is obtained from the government of the Thua Thien Hué Province. It consists of the total amount of residents per district, together with the surface of the district. This results in the average density of the population per district. The data has been converted to ESRI files to view the data in ArcView software and in order to convert it to ASCII-files with a 90 meter grid. Figure 2.12 shows the grid data with the location of the left lower corner of longitude: 758.628.434 and latitude: 1.804.480.528. The total distance between the top and the bottom of the figure is 38,9 km.
M
e
th
o
d
o
lo
g
y
2.2.1.2. Inundation map The inundation depth map used for the mortality function (figure 2.13) is the same map used for the damage function (figure 2.2). In figure 2.14, the inundation map is displayed with the population density map in the background.Figure 2.13: Inundation map (HEC-RAS model)
Figure 2.14: Overlay:
Inundation map in black with density of population in background
2.2.2. Mortality function
Jonkman & Asselman have developed two types of depth-mortality curves. The first is for the fatalities due to drowning if the local rate of the water rising exceeds 1 m/hr (fast rising curve). The second is for fatalities caused by water that rises slower than 1 m/hr (slow rising curve). So the two curves are derived from two data sets, distinguished by the water rising speed. The fatalities of the first data set
are presumed to be drowned due to the high water depth and the second data set represent other causes of death such as hypothermia, fatigue of person or indirect causes like electrocution or heart attack. Since the rising speed of the water is not known, both the curves will be applied next to each other.
M
neglected in this assignment since only the water depth is available.The fast rising curve and the slow rising curve for the mortality factor (f) are stated below and drawn in figure 2.15. In these functions, d is the inundation depth.
d
This factor f is implemented with the next function, with n for the number of habitants per grid cell and M for the number of fatalities per cell.
n
d
f
M
=
(
)
⋅
2.3. Validation
“How can the reliability of the economic damage model and mortality model be estimated based on the reliability of their inputs?”
The reliability of the economic damage model and of the mortality model can be estimated by a validation of its inputs and its outputs. The models have several aspects, of which an overview is made in table 2.6. An aspect is capable for validation if true data is available for a situation that the model is based on. The models in this assignment are based on the measured discharges of the November 1999 flood, so the validation is dependent on the information about the economic damage and mortality of that particular flood. Since an inundation map of this flood and some data about the total damages and fatalities is known, a validation can be done for the aspects that are printed bold in table 2.6.
Aspects Validation
Table 2.6: Aspects of assignment that can be validated marked bold
Since the inundation maps that the two models use are similar, in total three validations will be implemented. The validation of the inundation map can be more extensive than the results of the two models, since the known data used for the validation of the two models only concern the total damage and total fatalities.
2.3.1. Validation of results
2.3.1.1. Total economic damage
M
e
th
o
d
o
lo
g
y
Therefore, the only validation of the result of the damage model is by comparing its accumulated damage with the accumulated damage of the November 1999 flood. 2.3.1.2. Total fatalitiesFor the validation of the mortality map, similar considerations hold as for the validation of the economic damage. The possible validation exists only of comparison of the total amount of fatalities with the reported casualties during the November 1999 flood.
2.3.2. Validation HEC-RAS inundation map
For the validation of the HEC-RAS inundation map, three methods are used. First, the location of the inundation data is compared with an inundation map that contains observed data. Second, the inundation data for the whole map is qualitative compared with the observed data. Finally, the HEC-RAS depths are compared with the observed data over one cross-cut line in the inundated area.
The inundation map that contains observed data is drawn in figure 2.16. Some data is lacking, this can be recognized by the abrupt boundaries in this map. Further on, the data is only determined in three categories of 1 meter water depth and one category for everything more than three meter water depth. In order to compare the inundation map of the HEC-RAS model with this map, the categories of this map are labelled with these inundation depths: 0-1 meter is 50 cm
1-2 meter is 150 cm 2-3 meter is 250 cm >3 meter is 400 cm.
Figure 2.16: Observed inundation depth of November 1999 flood
2.3.2.1. Spatial comparison
The location of the inundated area according to the HEC-RAS model, is compared with the location according to the observed inundation map. The total surface of the observed map is calculated and compared with the total surface of the HEC-RAS inundation map. The surface that is in both maps inundated are pointed out, as well as the inundated surface according to the HEC-RAS model that is not inundated according to the observed data. This information is described in proportion to the total surface of the observed inundated area.
2.3.2.2. Qualitative comparison
M
e
th
o
d
o
lo
g
y
inundation map and the observed inundation map. To compare these maps, the HEC-RAS inundation map is adjusted to the categories of the observed map. The real inundation map is sliced into four categories of inundation depth, so this is also done for the HEC-RAS map. Using Matlab strings (see Attachment C), the percentage of the correct data in the HEC-RAS inundation map can be derived and the data can be drawn into a map.2.3.2.3. Depth line comparison
When the depth of the map is drawn into a cross-cut, an impression of the differences between the inundations can be obtained. The line has to cut interesting areas of the map, so multiple categories of the real map and if possible the minimum depth and maximum depth of the HEC-RAS inundation map.
Two lines have been selected to make the depth line comparison, they are drawn in figure 2.17. The most interesting locations to validate are selected by its maximum and minimum depths and the areas in between. Some heavily inundated areas, recognized by its large surface of maximum inundation, are located in the South West of the map, North of the Hué City and South East of the Hué City. Further on, the high grounds in the middle of the inundated area are of interest. The two lines drawn from North to South and from West to East cover as much of these areas as possible.
R
e
s
u
lt
s
Chapter 3. Results
3.1. Economic damage
3.1.1. Damage map
The damage map that is obtained for the Huong River Basin is showed in figure 3.1. The data is drawn in the cells of 90 by 90 meters. The total width of this area is 58,3 km, the height is this map is 39,1 km and the lower left corner is located at longitude 759.530.190 and latitude 1811.030.205.
Figure 3.1: Damage map in USD/m2, using the HEC-RAS inundation depths
The accumulated damage in this damage map is 207 million USD. As presented in Chapter 2 “Methodology”, this value is based on a limited amount of land use types and the inundation depths of the HEC-RAS model using the discharge of the November 1999 flood. The spatial damage data in figure 3.1 shows that the damage per square meter is most large in the area with infrastructure. Remarkable is that in Hué City are some locations with a prediction of expensive damages, but in general the city suffers only of a few damages overall. This probably is caused by the smaller inundation depth due to the conventional irrigating system around the old Citadel of Hué. Outside Hué, the rural areas are exposed to damage until 4 USD/m2 and the rice fields have only damage below 0,5 USD/m2.
R
e
s
u
lt
s
rice land, the forest area and area with other crops have average damages most close to its maximum damage values. After these land use types, the rural and urban areas have the highest damages in comparison to its maximum damage values.Figure 3.2: Damages and inundation surfaces per land use
Average damage
Maximum damage
value
Percentage
Rice 0,0403 0,044 92 Urban 5,53 29 19 Rural 2,67 22 12 Forest 0,84 0,84 100 Highway 5,05 400 1,2 Provincial roads 1,05 80 13 Railways 12,2 1000 1,2 Other crops 0,0053 0,02 27
Table 3.1: Average calculated damage and maximum damage value per land use
3.1.2. Validation damage map
R
Table 3.2: Total calculated damage (using two different inputs) and reported damages in USD
In the comparison of table 3.2, the reported economic losses should not be taken into account because this assignment did not apply any data about the industry of commerce. Since the reported estimated damage includes a lot of facets that are not taken into account in this assignment and vice versa, the comparison is not fully accurate. However, it does give a good indication of the significance of the damage in this assignment.
3.2. Mortality
3.2.1. Mortality map
Using the mortality curves of Jonkman & Asselman (s.a.) for both rapid water rising and slow water rising, the results are extremely high (see table 3.3). Figure 3.3 shows the mortality map of the slow water rising curve with HEC-RAS inundation depths. In this map the amount of fatalities per grid cell (8100 m2)is shown, with a maximum of 715 casualties. The map
Figure 3.3: Mortality map with slow water rising curve and HEC-RAS inundation depths
R
e
s
u
lt
s
HEC-RAS inundation depths Observed inundation depths Rapid water rising curve 20.431 fatalities 48.983 fatalities Slow water rising curve 2.319 fatalities 2.821 fatalitiesTable 3.3: Total calculated fatalities due to a flood with discharges of the November 1999 flood
In table 3.3 it is not necessary to involve both the HEC-RAS inundation depths and the observed inundation depths to expel the HEC-RAS model accuracy, since they are alike in proportion to the results of the mortality model, see the validation of the mortality map. 3.2.2. Validation mortality map
According to the reports of international organisations (Reliefweb – USAID, 1999) and the local newspapers, the number of fatalities due to the November
1999 flood is 622 (see table 3.4). This number is much smaller than the smallest calculated amount with the curves of Jonkman & Asselman, so the implementation of these curves is not valid at all. The mortality map is now only to use for an indication of the locations of the areas where a high inundation is predicted together with a high population density.
Table 3.4: Reported casualties
3.3. Validation inundation map
3.3.1. Spatial comparison
When the HEC-RAS inundation map is compared with the observed inundation map (see figure 3.4), it becomes clear that according to the HEC-RAS model a smaller surface is inundated than in reality happens. 72 Percent of the HEC-RAS inundated area is similar to the location of the observed inundated surface, 28 percent of this area is in reality not inundated.
Figure 3.4: Spatial comparison
It has to be noted that the data of the observed inundation map does not stretch as far as the data of the HEC-RAS inundation map. As one can see in figure 2.16, this data has a boundary in the South East of the map. This explains the area in the South East that is
Casualties reported by international
organisations People killed People missing People injured
R
e
s
u
lt
s
inundated only according to the HEC-RAS model. Taking this into account, the numbers and percentages stated in table 3.5 would be much more positive concerning the accuracy of the HEC-RAS model.3.3.2. Qualitative comparison
Dividing the HEC-RAS inundation data to the categories of the observed map, 26 percent of the similar surface is predicted correctly by the HEC-RAS model. The correct data is spread over the whole map, except for the area where the Huong River floods into the lagoons. This can be concluded since no black spots at that location in figure 3.5 can be seen. This assumes that the prediction of the HEC-RAS model in general is of moderate quality, except for the estuary of the Huong River.
Km2 % Surface inundation of the observed inundation map 370 100 Surface inundation of the HEC-RAS inundation map 276 75 HEC-RAS inundation surface within the observed data 201 54
Spatial comparison
HEC-RAS inundation surface outside observed data 75 20 HEC-RAS inundation surface within the observed data 201 100
Qualitative comparison
Similar spatial data 52 26
Table 3.5: Spatial and qualitative comparison
Figure 3.5: Spatial comparison
3.3.3. Depth line comparison
The depth lines from West to East and from North to South are drawn in figures 3.6 and 3.7. As one can see, the HEC-RAS data is more accurate since these are not divided into categories like the observed data are. The observed depths should be considered indications for their categories, since each category has gained its own value (see part 2.3.2. Validation HEC-RAS inundation map). On the x-axes, the grid cells of Matlab are stated, each cell is 90 meter width and 90 meter long. For the North-South line the data left and right is cut off, since this part of the map contains no data.
R
e
s
u
lt
s
peaks in the East are missing. This means that the HEC-RAS model takes only a little notice of the inundated area upstream of the Bo River and no notice of the inundated area at the banks around the lagoon in the East. Alongside the North-South line, the HEC-RAS model does not predict the small peak in the North and it practically takes no notice of the many small peaks in the South. The inundated area in the North-West of Hué is predicted pretty accurately.Over all, it seems that the HEC-RAS model predicts accurate inundation depths, but the accuracy is lacking for the surface that inundates.
Figure 3.6: Water depth line (in cm) from West to East (per Matlab cell of 90 meter)
C
The used depth-damage curves seem to be capable of prediction of the amount of damage, since the accumulation of the damage of several land use types for inundation depths of the November 1999 flood appears to be in the same order as the reported damage for that particular flood. This means that the consequences of flooding of the Huong River can be predicted, as long as the prediction is limited to the economic damage.
The mortality is not to be predicted with the depth-mortality curve of Jonkman & Asselman (s.a.). Applying this curve with the inundation depth and the population density of the Thua Thien Hué Province, results in an extremely high number of fatalities, until two orders of magnitude above the reported amount of fatalities due to the November 1999 flood. Only the spatial data of the mortality map can be used as a lead to the risks that the population is subject to, but for this only a simple comparison with an inundation map and the density map is already sufficient. When comparing these, the South bank of the Huong River in Hué City would be the location of the most fatalities during a flood.
Economic consequences
For the economic damage in case of a flood like the November 1999 flood, the area around rivers in the Huong River Basin is also subject to the largest consequences. This is mostly caused by the rural settlement near the rivers and its large vulnerability for flooding. The rural area has the largest share in the total damage and suffers the second largest surface of inundation, after the rice fields. Determining the damage per square meter, it appears that the railroad and the highways suffer the most extreme damage, followed by the urban settlement. When forest area or rice fields are struck by inundation, its maximum damage is reached with only a small water depth, since the average damage of both land use types is nearly the the model is insufficient about the inundated surface, but the data within its prediction of the inundated areas is useful for a damage model like this assignment.
4.2. Discussion
Accuracy observed inundation map is lacking
C
s
Since these small differences are also not traceable in the HEC-RAS model, the accuracy of the HEC-RAS model can appear good by a validation with the observed data, while the accuracy of the observed data invalidates this conclusion.Data of land use types is incomplete
Only a small amount of land use types is processed by this assessment. These types do not represent all the existing land use types in the Huong River Basin. This means that not all the possible economic damage that the Huong River Basin suffers, is taken into account. For example the industry, the commerce, tourism, fishery, recreational areas and temples would be subject to damage. These land use types as well, will suffer economic losses due to flooding. Since these types are not taken into account in this assignment, this damage map can create a limited image of the reality.
Furthermore, the accuracy of the validation is affected by the age of the data of the processed land use types. This assignment used the most recent spatial data of land use types, while the data for the validation dates back to 1999. The discharges of the November 1999 flood are used to simulate this flood, while the spatial data of the land use types is dated from 2007. Since 1999, the industry and tourism have grown and the house value increased, so the vulnerability for flooding must be higher too and the damages should be estimated higher. However, while this recent data implies that the validation is less accurate, the data is still useful for the prediction of economic consequences of future floods.
Detailed data of the damage map is not validated
Although the total damage of the damage map is validated, the amounts of damage per land use type are not validated. Now it can be a coincidence that the total amount of damage seems to be right, since it is possible that corrupt data of one land use type can be corrected by the corrupt data of an other land use type. Validating the several land use types is only possible when data of the damages per land use type is available. Now the conclusions concerning the proportions of the damages or the spatial data per land use type can be considered guidelines and should not be considered validated.
Lots of variables are not taken into account
The HEC-RAS model only provides water depths, whereby the characteristics of the flooding that are used in the damage map, are limited. If data such as water velocity, rising speed, duration of the flood, wind speeds, and possible preparation for flooding would be available, the damage map could be modelled with more accuracy. These variables can influence the damage map by more detailed information about the damage that buildings and assets suffer, by which the damage can be defined more accurately.
For the mortality map the lack of data is larger and even more important. Mortality is dependent of many variables like warning systems, evacuation time, evacuation possibilities, water rising speed, water depth, people’s behaviour during a flood, the velocity of the water and the average repetition time of the flood. These variables all exert a great influence to the number of people that drown in case of a flooding. When these variables would available, more accurate information could be acquired about the mortality and therefore about a mortality map.
Mortality function
C
o
n
c
lu
s
io
n
s
of a flood of the Huong River, the residents are often warned by the prediction of a typhoon. These people should be able to prepare and to flee. In other assignments, first the number of people present should be estimated considering the possibilities of an evacuation.Different resource data sets
This assignment was dependent of the available data concerning the inundation depths, the population density and the land use types. Some of these data files had wrong or no spatial location attached, therefore some data files have been given spatial data manually. This is done by comparing reference points within the maps such as the recognisable shape of the Hué citadel. Although, still one can not be sure that all the spatial data of the maps now is correct. A tiny difference between the inundation map and the land use map can have a significant influence to the details of the damage map. Considering this, the damage map should be used as a guideline for general damages at a larger scale than the presented grid of 90 x 90 meters.
4.3. Recommendations
The final goal of this assignment and all the work that has been done in preparation to this assignment, is to develop a tool to describe the vulnerability of the Thua Thien Hué Province concerning a flood of the Huong River. This description can be useful to reduce economic and social consequences.
This assignment created the insight that the developed HEC-RAS model of the Huong River Basin is sufficient to predict reasonable inundation depths, but it does these predictions only in the centre of the inundated area. This model should be developed further to obtain more significant data in the boundary areas, such as upstream the Bo River, near the estuary of the Huong River and around the lagoons.
Implementing the depth damage curve seems to be a good method creating the damage map with the little information available. The result is reasonable but the quality of the resulting spatial data is not validated at all. As long as no extra data is present besides the inundation depth and the land use available, the used damage curves should be used. However, it is recommended to validate them.
Of course it is recommended to expand the significance of the damage map by updating and adding data. The inundation data should be more significant and the land use data can be expanded with data about the industry, commerce, tourism and fishery. However, not only this data should be collected, also compatible depth-damage curves are necessary for these new datasets.
It is recommended not to use the depth-mortality curve of Jonkman & Asselman (s.a.) for the estimation of fatalities in the Huong River Basin. To make such an estimation a curve should be obtained that is developed for a similar area as the Thua Thien Hué Province, that is often struck by floods and a where the population is better informed of the flooding risks.
R
s
References
Tran P., Shaw R., Chantry G., Norton J. (2007) “GIS and local knowledge in disaster management: a case study of flood risk mapping in Vietnam”. Graduate School of Global Environmental Studies, Kyoto University, Japan and Development Workshop, France.Vermue H. (2006). “Flood modeling and measure assessment for Huong River Basin”, Bachelor thesis, University of Twente.
Reliefweb – Red Cross (1999). “Vietnam: Floods Situation Report No. 1”. Source:
International Federation of Red Cross And Red Crescent Societies, 25 November 1999. http://www.reliefweb.int/rw/rwb.nsf/db900SID/OCHA-64BKYU?OpenDocument [Downloaded on 25 September 2007].
De Oude R. (2006). “Flood modeling of the Huong River System in Thua Thien Hué, Vietnam”, Bachelor thesis, University of Twente.
De Bruijn K.M. (2005). “Resilience and flood risk management”, DUP Science, Delft University Press.
Huang Y. (2005) “Appropriate modelling for integrated flood risk assessment”. University of Twente. (ISBN 90-365-2251-x).
Kok M., Huizinga H.J., Vrouwenvelder A.C.W.M. & van den Braak. W.E.W. (2005). “Standaardmethode 2005 Schade en Slachtoffers als gevolg van overstromingen” (Standard Method), Rijkswaterstaat DWW.
CRUEIP (2003). Central Region Urban Environmental Improvement Project, “Supplementary Appendix to the Report and Recommendation of the President to the Board of Directors” [Resettlement plan], Provincial People’s Committee of Thua Thien Hué. Gupta A.D., Babel M.S. & Ngoc P. (2004). “Flood damage assessment in the Mekong Delta,
Vietnam”, Water Engineering and Management, School of Civil Engineering Asian Institute of Technology. [Downloaded August 14, 2007] http://www.wrrc.dpri.ky oto-u.ac.jp/~aphw/APHW2004/proceedings/FWR/56-FWR-M167/56-FWR-M167.pdf VDP (2004). Vietnam Disaster Prevention, “Renewal of housing stock has increased
vulnerability to loss”, “Building types” & “What is involved in house reinforcement?” http://www.vietnamdisasterprevention.org [Downloaded on September 19, 2007]. AUDMP (2001). Asian Urban Disaster Mitigation Program, "Workshop on Safer Shelter in
Vietnam 4-5 September 2002", [Downloaded on September 10, 2007] http://www.adpc.net/AUDMP/library/proceedings/vn1.pdf, ADPC.
Jonkman S.N. & Asselman N. (s.a.). “Method for the Estimation of Loss of Life Caused by Floods in the Netherlands”. GIS & RS in Hydrology, Water Resources and Environment, Volume 1. WL | Delft Hydraulics, The Netherlands.
Reliefweb – USAID (1999). “Vietnam Floods Factsheet #1, FY 2000”. Source: United States Agency for International Development, 18 November 1999.
http://www.reliefweb.int/rw/rwb.nsf/db900SID/OCHA-64CT54?OpenDocument [Downloaded on 25 September 2007]
Messner F., Penning-Rowsell E., Green C., Meyer V., Tunstall S. & van der Veen A. (2006). FLOODsite report : “Guidelines for Socio-economic Flood Damage Evaluation”.
R
s
van der Veen A. & Logtmeijer C. (2004). “Economic Hotspots: Visualizing Vulnerability to Flooding”, Department of Business, Technology and Public Policy, University of Twente, Springer 2005.Genovese E. (2006). “A methodological approach to land use-based flood damage
assessment in urban areas: Prague case study”, European Commission Directorate-General Joint Research Centre. [Downloaded on Oktober 15, 2007]
http://ies.jrc.cec.eu.int/fileadmin/Documentation/Reports/Land_Management/EUR_20 06-2007/EUR_22497_EN.pdf
van der Sande C.J., de Jong S.M. & de Roo A.P.J. (2003). “A segmentation and classification approach of IKONOS-2 imagery for land cover mapping to assist flood risk and flood damage assessment”, International Journal of Applied Earth Observation and Geoinformation, pp. 217–229.
van der Sande C.J. (2001) “River flood damage assessment using Ikonos imagery”, Natural Hazards Project-Floods, Joint Research Centre of the European Commission, S.P.I. 01.147, Ispra, August 2001.http://natural-hazards.jrc.it/ documents/floods/2001-docs/2001-reports/flooddamage_report.pdf [not available]
Briene M., Koppert S., Koopman A. & Verkennis A. (2002). “Financiële onderbouwing kengetallen hoogwaterschade”. NEI, Rotterdam, The Netherlands.
Kok M (2001). “Damage functions for the Meuse River floodplain”, Communication paper to the Joint Research Centre, Ispra, Italy, 10 pp. [not available]
Penning-Rowsell E (2001). “Stage-Damage Functions for Natural Hazards Unit”. Flood Hazard Research Centre, Middlesex University, England. Communication Paper to the Joint Research Centre, Ispra, Italy, 3 pp. [not available]
IKSR (2001). “Rhine Atlas 2001, Damage”. Internationale Kommission zum Schutz des Rheins, Druckbetriebe Lettner KG. http://www.iksr.org/index.php?id=29 [Downloaded on August 4, 2007].
Dutta D., Khatun F. & Herath S., (2005). “Analysis of Flood Vulnerability of Urban Buildings and Population in Hanoi, Vietnam” Seisan Kenkyu 57, 338.
Nghiem Tien Lam (2002). “A Preliminary Study on Hydrodynamics of the Tam Giang – Cau Hai Lagoon and Tidal Inlet System in Thua Thien-Hué Province, Vietnam.”
International Institute for Infrastructural, Hydraulic and Environmental Engeneering, Delft, The Netherlands.
Villegas P. (2004). "Flood modelling in Perfume River Basin, Hué Province, Vietnam", ITC, International Institute for Geo-Information Science and Earth Observation. Enschede, The Netherlands.
H2iD (2005). Hulsbergen Hydraulic Innovation and Design. "Flood Vulnerability Analysis and Mapping in Viet Nam" NIVR project number 53407PAN. The Netherlands Agency for Aerospace Programmes and the SRON Netherlands Institute for Space Research. Bouwer L.M. & Aerts J.C.J.H. (2005). "The impact of land-cover change and climate
variability on river runoff". NIVR project number 52308IVM, Institute for Environmental Studies, VU Univerisity Amsterdam, The Netherlands.
Bouwer L.M. & Aerts J.C.J.H. (2005). "Calibration and validation for the wider Perfume River Basin in Vietnam". Part of NIVR project number 52308IVM, Institute for
Environmental Studies, VU Univerisity Amsterdam, The Netherlands.
R
e
fe
re
n
c
e
s
Vietnam”, Unesco-IHE Instutue for Water Education, MSc researches. http://www.unesco-ihe.org/about/academic_departments/hydroinformatics _and_ knowledge_management/msc_research_topics/flood_hazard_modeling_in_thua_thie n_Hué_province_vietnam [Abstract downloaded on November 10, 2007].A
This assignment is founded on literature about damage functions and mortality concepts. The information of the considering literature that is significant for this assignment is summarised and presented in this literature review. Finally, all the known researches in the same area are summarized.
Damage functions
Damage functions exist in many types and are used in many different approaches. First, the literature about the possible damage functions is obtained. Then the damage function is unravelled in damage curve and the associated maximum damage value. Finally the known damage assignments that have been carried out in Vietnam are presented.
Flood damage functions
Messner et al (2006) provide a guideline for socio-economic flood damage evaluation. Their FLOODsite report bundles different approaches of flood damage. A difference is made between damage functions on the levels macro, meso and micro. Micro uses the most precise data and costs the most effort per unit of area, it is for implementation on local scale. Macro has the least precise data output, but can cover more area with the same efforts and is best used for large (international) areas. Meso is in between these levels, and therefore it is best to implement a meso approach on regional scale. Furthermore, the FLOODsite report provides a couple of questions that can give insight considering the best approach per damage assignment.
Van der Veen & Logtmeijer (2004) extend the known concept about damage functions with the indirect economic effects on the rest of the regional and national economy. He introduces the definition ‘vulnerability’, a function of dependence, redundancy and susceptibility. When an area with high vulnerability (an economic hotspot) is flooded, the significant indirect
Briene et al. (2002) studied the financial foundations of the prefixes concerning damage due to flooding. The article is not available.
A
However, the articles of Kok (2001), Penning-Rowsell (2001) and Van der Sande (2001) are not available. Their functions can be taken from the thesis of Huang (2005), but the only resource for the foundations of these damage functions is the Standard Method of Kok et al. (2005).
Damage curves
The Rhine-Atlas of the IKSR (2001) creates a damage map for the Rhine, using self developed damage curves. These curves use the inundation depth determine the damage factor. With the maximum damage values per land use the damage map is created. For the estimated value and the vulnerability per land use, IKSR first calculates the value of the affected assets and then defines the material damage. The affected assets are determined by their mean values. Local data is obtained by German statistics, which is extrapolated for other areas. The used functions are dependent on the available data for land use, in this case of the CORINE database. Considering this, the damage functions are separated into mobile and immobile assets.
In The Netherlands, the government has developed the Standard Method (Kok et al, 2005) to calculate the amount of expected damage and victims due to a flooding. With these calculations, risk analyses can be done in vulnerable areas. The Standard Method is the result of the adjustments from several studies concerning the same subject to the Standard Method of 2000. The Standard Method provides damage curves that use damage factors per land use, dependent of the inundation depth. This damage factor comes with maximum values per land use, that here is specified for the Dutch environment.
Maximum damage values
The supplementary appendix of the Central Region Urban Environmental Improvement Project (CRUEIP, 2005), provides the values for land acquisition and resettlement requirements concerning this project. This resettlement plan aims to improve the conditions in five poor towns in the Thua Thien Hué Province, constructing infrastructure and facilities. The replacement values are estimated on land use data in each project area and on technical designs. The provided replacement values are not yet fully adapted to the actual households affected by the project and the actual market value, but it provides an indication of the replacement costs of some assets.
Damage assignments in Vietnam
Development Workshop carried out a participatory Geographic Information System hazard-mapping project in Vietnam (Tran et al, 2007). Linking community knowledge of local flooding risks with modern techniques, Tran et al were capable to give the local communities the possibility to participate in decisions concerning disaster management. The implemented damage function uses data acquired from households in a village in the Thua Thien Hué Province, and separates the households in risk categories using the weights ‘intensity of natural events’, ‘exposure to the hazard’ and the ‘vulnerability for harm due to a hazard’. The methodology of this research is of value for a local assignment.
A
circumstances. This information can be helpful for this assignment to develop maximum damage values for damage functions.Gupta et al (2004) based their flood damage assignment on the actual flood damage information available for the year 2000 flood and the potential flood damages to different categories of land use activities in the delta obtained through questionnaire survey. However Gupta et al mainly collected average damage due to this flooding, some data can be used in order to create maximum damage values in this assignment.
De Bruijn (2005) attends to the matter of resilience and researches how the resilience of a flooding risk area should have impact to the precautions for flooding. The research proved that resilience and resistance are both system characteristics that express the ability of an area to cope with flooding. One of the case studies is done in the Mekong Delta, Vietnam, and uses a depth-damage function to calculate the damage due to flooding. This function can be used in this assignment.
Research in the Huong River Basin
Nghiem Tien Lam (2002) studied the hydraulic characteristics of the Tam Giang-Cau Hai lagoon system. The main objectives were to set-up a numerical model to simulate and investigate the hydraulic behaviour of the system to evaluate the stability situations of the inlets. An 1D numeric model is used to simulate the hydraulic behaviour of the system. The model results indicate that river flows are the most important acting force of the system during floods. In the dry season, the most important factors influencing the hydrodynamic characteristics of the system are tides, sea level rise and inlet openings. The stability situation of the Thuan An inlet is in a “fair to poor” situation, the Tu Hien inlet, is always in a “poor” stability condition
In the study of Villegas (2004), data of the Tropical Rainfall Measuring Mission (TRMM) is compared with ground rain gauge records through the discharges obtained by GIS modelling. The comparison shows that the most reliable estimation during the flooding period so far is the TRMM data. The rain gauge collected data is more efficient during the normal conditions. A reservoir model was developed to estimate the volume of water stored in the flood plain and the temporal variation of the flood was estimated using a digital elevation map inundation technique.
H2iD (2005) uses the topographic height and its aspects, land use and the land use changes as input for simple, easy-to-understand vulnerability maps for the wider Huong river basin, the Mekong river basin and the Red river basin. H2iD gave a series of workshops for Vietnamese that indicated an interest in applying the flood vulnerability methodology in practice. This has to lead to a global flood vulnerability service via the Internet to publish this kind of information to interested citizens and professionals.
T