© 2018 IJSRCSEIT | Volume 3 | Issue 3 | ISSN : 2456-3307
Airline Crash Investigation Using Data Mining Techniques
Manasvi Dedania1, Ekta Bhosale1, Ankit Champaneria1, Shubam Lotlikar1, Prof. Rovina D’britto2
1Department of information Technology Mumbai University Maharashtra, India
2Assistant Professor, Department of information Technology Mumbai University Maharashtra, India
ABSTRACT
Air transportation systems are designed to ensure that aircraft accidents are rare events. To minimize these accidents, factors causing or contributing to accidents must be understood and prevented. Previous research has studied accident data to determine these factors. In this research work crash investigation and analysis of the flights are done. Airplane crash may be caused due to pilot error, mechanical failure, bad weather, sabotages or human error. In this research we employed a data mining technique to conduct a holistic analysis of aircraft incident data in relation to the accident data. The analysis identifies relationships between the accident and incident data and finds patterns of causal and contributory factors which are significantly associated with aircraft accidents.
Keywords: Data Mining, Clustering K-Means Clustering, Cosine Similarity
I.
INTRODUCTION
The major objective of this research is to use data mining techniques to find out unknown patterns in the international Airplane Crash dataset. It is carried on aircraft crash and fatalities data collected from the year 1908 to 2016. The work is carried out using K-Mean clustering data mining technique and cosine similarity measure. We search the Airplane Crash database using a time period, location, type of occurrence (i.e. what happened), and type of aircraft for introducing the field of data mining and clustering data. The research is carried on aircraft crash and fatalities data collected from the year 1908 to 2016. The work is carried out using K-Mean clustering data mining technique and cosine similarity measure.
The paper is further structured as follows: theoretical background, methodology, experimental setup, analysis and conclusion.
II.
THEORETICAL BACKGROUND
Aircraft never crash because of one single issue. It’s almost always a combination of factors that lead to an accident and therefore it’s very difficult to provide accurate statistics as to what the cause of an aircraft crash is statistics for the causes of aircraft crashes are not always clear. It is however widely accepted that the following statistics are a reasonable representation:55% Pilot Error,17% Aircraft Mechanical Error,13% Weather,8% Sabotage,7% Other (ATC, Ground Handling, Unknown).
mining, Baysian classifier, probability distribution ,global expert system Data mining is a computing technique that can be used to discover unknown patterns from the massive dataset. It is a wide field that was produced to make expectations for future data in light of examples found in gathered data.
Data mining techniques involves classification, prediction, association and clustering. The clustering technique in data mining is the grouping of a particular set of objects based on their characteristics, aggregating them according to their similarities. Regarding to data mining, this metodology partitions the data implementing a specific join algorithm, most suitable for the desired information analysis. There are several different ways to implement this partitioning, based on distinct models. Distinct algorithms are applied to each model. Different algorithms can be used in data clustering such as DBSCAN, Agglomerative Clustering ,Means, Means (Kernel), Means (fast), X-Means, K-Medoiods, Expectation Maximization Clustering, Support Vector Clustering, Random Clustering.
Cosine similarity
Cosine similarity is a measure of similarity between two non-zero vectors of an inner product space that measures the cosine of the angle between them. Cosine distance is a term often used for the complement in positive space, that is Dc(A,B)=1-Sc(A,B) where Dc is the cosine distance and Sc is cosine similarity.
The cosine of two non-zero vectors can be derived by using the Euclidean dot product formula which is equation 1.
a⋅b=‖a‖_2 ‖b‖_2 cosθ……(1)
Where Ai and Bi are the components of vector A and B respectively.
K- means clustering:
K-means clustering is a type of unsupervised learning, which is used when you have unlabeled data (i.e., data without defined categories or groups). The goal of this algorithm is to find groups in the data, with the number of groups represented by the variable K. The algorithm works iteratively to assign each data point to one of K groups based on the features that are provided. Data points are clustered based on feature similarity.
Algorithmic steps for k-means clustering
Let X = {x1,x2,x3,……..,xn} be the set of data points and V = {v1,v2,…….,vc} be the set of centers.
1) Randomly select ‘c’ cluster centers.
2) Calculate the distance between each data point and cluster centers.
3) Assign the data point to the cluster center whose distance from the cluster center is minimum of all the cluster centers..
4) Recalculate the new cluster center using:
where, ‘ci’ represents the number of data points in ith cluster.
5) Recalculate the distance between each data point and new obtained cluster centers.
6) If no data point was reassigned then stop, otherwise repeat from step 3
III.
METHODOLOGY
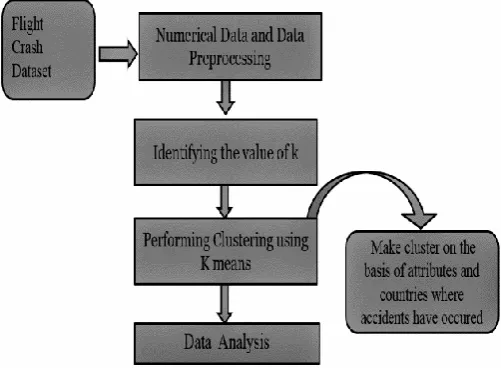
Figure 1. Block diagram of the system
The investigating system consists of four modules and they are as follows:
1. Airplane crash dataset
The airline crash dataset contains structured as well as unstructured dataset. It contains Various attributes like date, time, location, operator, flight number, route, plane type, and Registration, cn/ln, aboard, fatalities, ground and summary. It was collected from Opendata.socrata.com.
2. Data reduction/pre-processing
The dataset has structured(date, time, location, etc.) And unstructured (summary of the Airplane crash) data. The dataset is reduced by considering certain attributes for the analysis And by removing the empty rows. The reduced numerical dataset contains the following Attributes: location, operator, route, aboard, fatalities and ground while the reduced Unstructured dataset contains only 1 attribute, i.e. Summary. The numerical dataset is used To find out the fatality rate of air crashes while the unstructured dataset is used for finding Content similarity from the summary.
3. Identifying the value of ‘k’
The value of ‘k’ is verified using the average silhouette operator. The value of ‘k’ which Has the highest average silhouette width is selected.
4. Clustering using k-means number, route, plane type, registration, cn/ln, aboard, fatalities, ground and summary.
B. Tool Used:
Visual studio 2010- Visual Studio provides a suite of component-based development tools and other technologies that you can use to build powerful, high-performance applications. In addition, Visual Studio is optimized for team-based design, development, and deployment of enterprise solutions.
Most applications revolve around reading and updating information in databases. To enable data integration in distributed, scalable applications, Visual Studio provides support for integrating data into your applications. Visual Studio provides many design-time tools to help you create applications that access data. This introduction presents an overview of the basic processes involved in creating applications that work with data. The information here deliberately skips over many details and is designed as a source of general information and a jumping-off point to the many other Help pages associated with creating a data application.
As you develop applications that access data in Visual Studio, you will have different requirements. In some cases, you might simply want to display data on a form. In other cases, you might need to devise a way to share information with other applications or processes.
very useful to understand the basic data concepts, as well as the data tools (wizards and designers) available in Visual Studio.
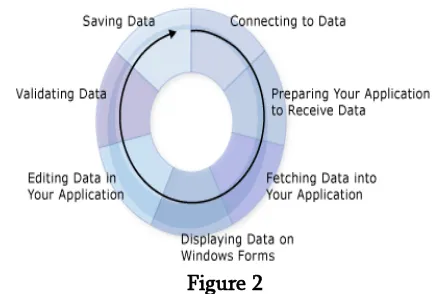
The overall task of working with data in an application can be broken down into several top-level processes. For example, before you display data to a user on a form, you must first connect to a data source (possibly a database or a service that provides data), and then fetch the data you want to display. After you bring this data into your application, you typically store the data in objects; by using a data model. The application may then allow users to add to, or modify the existing data in the data model. Then an application will likely send the modified data back to a data store.
A typical data application will use most of the processes illustrated in the following diagram:
The Data Cycle
Figure 2
As you create your application, think of the task you are trying to accomplish. Use the following sections to assist in finding the Visual Studio tools and objects that are available to you.
C. Cluster model:
Data clustering is considered as a form of unsupervised learning [14]. K-Means clustering is done using visual studio for flight crash dataset. The value of ‘k’ considered is ‘5’. The cluster model consists of 5 clusters. The total number of items in case of numerical dataset are 3535 out of which 709 items are in cluster 0, 708 itemsin cluster 1, 706 items are in cluster 2, 706 items are in cluster 3 and 706
items are in cluster 4.The total number of items in case of unstructureddataset are 65 out of which 14 items are in cluster 0, 11 items in cluster 1, 13 items are in cluster 2, 12 items are in cluster 3 and 15 items are in cluster 4.
V.
ANALYSIS
5.1. Clustering of Numerical Dataset
The factors considered in the analysis are as follows: 1. Fatality rate with operator
2. Fatality rate with location
The above factors were considered for
ground/aboard fatality. 5.1.1. Case Study 1: Fatality rate with Operator
Figure 3. Operator v/s Fatality with respect to Ground
The ID 3148 refers to the highest fatality rate, i.e. 583, that was caused by the Pan American World Airways/KLM at Tenerife, Canary Island while travelling from Tenerife to Las Palmas. The Id 3148 resides in cluster 2. The range for ground is 0 to 2750 (Refer Figure 3) which can be referred from the different colors scaled above the graph (blue, green, red).
Figure 4. Operator v/s Fatality with respect to Aboard
Figure 5. Operator v/s Fatality with respect to Ground/Aboard
The graph above (Refer Figure 5) refers to the fatality rates that are equal to and greater than 50% of 583(50% of the highest fatality rate), i.e 291.5. This is the result for all the clusters collectively where the highest fatality is 583 caused by the Pan American World Airways/KLM. The second highest is caused by the Japan Airlines amounting to 520. The third highest is 349 that is caused by the Saudi Arabian Airlines/Kazastan Airlines. Turkish Airlines amounting to 346, Air India amounting to 329 and Saudi Arabian Airlines amounting to 301.
5.1.2. Case Study 2: Fatality rate with Location The range for the ground is 0 to 2750 while for aboard is 1 to 644 (Refer Figure 10), which can be referred from the different colors scaled above the graph.
5.1.2.1. Result Analysis for Cluster 0
Figure 6. Location v/s Fatality with respect to Ground/Aboard
aboard. Aeroflot has the maximum fatality, i.e. 4266, of all the other operators. The route Tenerife Las Palmas has got the maximum number of fatalities. The research work can be extended using other clustering techniques like Density Based, Hierarchical clustering. The summary report of the dataset is used to identify better clusters using distance measures like cosine similarity. Cosine similarity is used for finding the similarity among the crashes. Majority of the flights crashed in USA. The flights with id 4818, 3136, 4667, 4508 and 4430 crashed in USA either in Atlantic Ocean or land due to technical issues and other factors. Majority of the Aeroflot flights crashed due to other factors like error made by air traffic controller, or inexperienced crew, etc. Majority of the Boeing flights crashed due to hardware, technical and other issues and crashed into either mountains or ocean out of which some caught fire or suffered from mid-air collision.
VII.
ACKNOWLEDGEMENT
We acknowledge our sincere thanks to Socrata for allowing us to use the metadata. The dataset was taken from the website:
https://opendata.socrata.com/Government/Airplane-Crashes-and-Fatalities-Since-1908/q2te-8cvq [16].
VIII.
REFERENCES
[1].Oluwatuyi,O.,&Ileri,O. N. (2013). Air disaster and its implications in the developing countries: a case study
of Nigeria. Modern Social Science
Journal,2014,Article-ID.
[2].SAFETY,A. (2002). Australian Aviation Accidents Involving Fuel Exhaustion and Starvation.
[3].Airplanes,C. (1959). Statistical Summary of Commercial Jet Airplane Accidents. Worldwide Operations,2008.
[4].Nazeri,Z.,Donohue,G.,& Sherry,L. (2008). Analyzing Relationships Between Aircraft Accidents and Incidents. In Proceedings of the International Conference on Research in Air Transportation.
[6].Iwadare,K.,&Oyama,T. (2015). Statistical Data Analyses on Aircraft Accidents in Japan: Occurrences,Causes and Countermeasures. American Journal of Operations Research,5(03),222.
[7].Lagos,A.,Motevalli,M.,& Sakata,N. (2005,March). Analysis of the Effect of Milestone Aviation Accidents on Safety Policy,Regulation,and Technology. In 46th
Annual Transportation Research