Corpora for conceptualisation and zoning of scientific papers
Maria Liakata
1, Simone Teufel
2, Advaith Siddharthan
3, Colin Batchelor
41Department of Computer Science, Aberystwyth University, mal@aber.ac.uk 2Computer Laboratory, University of Cambridge, Simone.Teufel@cl.cam.ac.uk
3Department of Computing Science, University of Aberdeen, advaith@abdn.ac.uk
4Informatics R&D, Royal Society of Chemistry, batchelorC@rsc.org
Abstract
We present two complementary annotation schemes for sentence based annotation of full scientific papers, CoreSC and AZ-II, which have been applied to primary research articles in chemistry. The AZ scheme is based on the rhetorical structure of a scientific paper and follows the knowledge claims made by the authors. It has been shown to be reliably annotated by independent human coders and has proven useful for various information access tasks. AZ-II is its extended version, which has been successfully applied to chemistry. The CoreSC scheme takes a different view of scientific papers, treating them as the humanly readable representations of scientific investigations. It therefore seeks to retrieve the structure of the investigation from the paper as generic high-level Core Scientific Concepts (CoreSC). CoreSCs have been annotated by 16 chemistry experts over a total of 265 full papers in physical chemistry and biochemistry. We describe the differences and similarities between the two schemes in detail and present the two corpora produced using each scheme. There are 36 shared papers in the corpora, which allows us to quantitatively compare aspects of the annotation schemes. We show the correlation between the two schemes, their strengths and weaknesses and discuss the benefits of combining a rhetorical based analysis of the papers with a content-based one.
1.
Introduction
Annotation schemes and corpora for scientific texts, es-pecially in the biomedical domain, are becoming increas-ingly important in enabling the automatic processing of information. Such schemes look at annotating mostly ab-stracts of papers and less often full papers, with the major-ity focussing on annotation at the token level for keywords, (Korhonen et al., 2009; Thompson et al., 2009). However, many consider more complex linguistic phenomena such as negation, hedges, dependencies and semantic relations at either the token or sentence level (Vincze et al., 2008; Med-lock and Briscoe, 2007; McIntosh and Curran, 2009) and at the sentence level for discourse-based categories (Hirohata et al., 2008; Teufel et al., 2009).
In the following we present and compare two comple-mentary sentence-based annotation schemes, CoreSC and AZ-II, which we have used to annotate full scientific pa-pers in chemistry.
2.
The CoreSC scheme
2.1. Core Scientific ConceptsThe CoreSC annotation scheme adopts the view that a scientific paper is the human-readable representation of a scientific investigation and therefore seeks to mark the com-ponents of a scientific investigation as expressed in the text. CoreSC is ontology-motivated and originates from the CISP meta-data (Soldatova and Liakata, 2007), a subset of classes from EXPO (Soldatova and King, 2006), an ontol-ogy for the description of scientific investigations. CISP consists of the concepts: Motivation,Goal,Object,
Method, Experiment, Observation, Resultand
Conclusion, which were validated using an on-line sur-vey as constituting the indispensable set of concepts neces-sary for the description of a scientific investigation. CoreSC
implements these as well as Hypothesis, Model and
Background, as a sentence-based annotation scheme for 3-layered annotation. The first layer pertains to the pre-viously mentioned 11 categories, the second layer is for the annotation of properties of the concepts (e.g. “New”, “Old”) and the third layer caters for identifiers (conceptID), which link together instances of the same concept, e.g. all the sentences pertaining to the same method will be linked together with the same conceptID (e.g. “Met1”).
If we combine the layers of annotation so as to give flat labels, we cater for the categories in table 1.
The CoreSC scheme was accompanied by a set of 45 page guidelines which contain a decision tree, detailed description of the semantics of the categories, 6 rules for pairwise distinction and examples from chemistry papers. These guidelines are available from http://ie-repository.jisc.ac.uk/88/.
2.2. The CoreSC corpus
Table 1: The CoreSC Annotation scheme
Category Description
Hypothesis A statement not yet confirmed rather than a factual statement
Motivation The reasons behind an investigation
Background Generally accepted background knowledge and previous work
Goal A target state of the investigation where intended discoveries are made Object-New An entity which is a product or main theme of the investigation Object-New-Advantage Advantage of an object
Object-New-Disadvantage Disadvantage of an object
Method-New Means by which authors seek to achieve a goal of the investigation
Method-New-Advantage Advantage of a Method Method-New-Disadvantage Disadvantage of a Method
Method-Old A method mentioned pertaining to previous work Method-Old-Advantage Advantage of a Method
Method-Old-Disadvantage Disadvantage of a Method
Experiment An experimental method
Model A statement about a theoretical model or framework
Observation the data/phenomena recorded in an investigation Result factual statements about the outputs of an investigation
Conclusion statements inferred from observations & results relating to research hypothesis
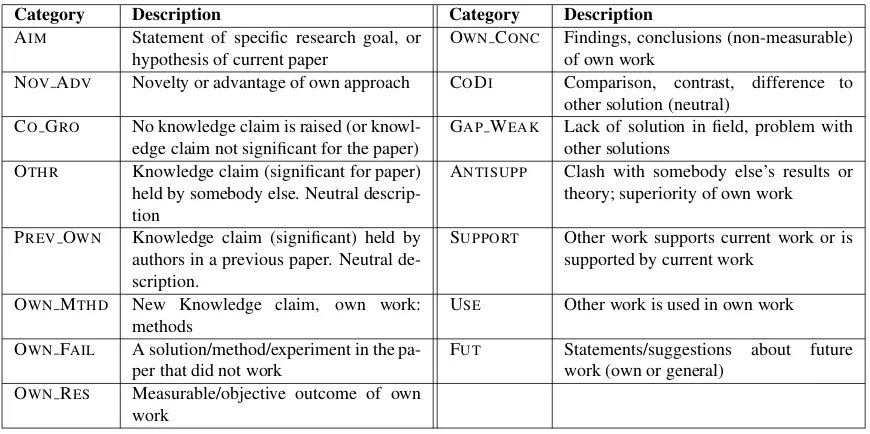
Table 2: AZ-II Annotation Scheme.
Category Description Category Description
AIM Statement of specific research goal, or hypothesis of current paper
OWNCONC Findings, conclusions (non-measurable) of own work
NOVADV Novelty or advantage of own approach CODI Comparison, contrast, difference to other solution (neutral)
COGRO No knowledge claim is raised (or knowl-edge claim not significant for the paper)
GAP WEAK Lack of solution in field, problem with other solutions
OTHR Knowledge claim (significant for paper) held by somebody else. Neutral descrip-tion
ANTISUPP Clash with somebody else’s results or theory; superiority of own work
PREVOWN Knowledge claim (significant) held by authors in a previous paper. Neutral de-scription.
SUPPORT Other work supports current work or is supported by current work
OWNMTHD New Knowledge claim, own work: methods
USE Other work is used in own work
OWNFAIL A solution/method/experiment in the pa-per that did not work
FUT Statements/suggestions about future work (own or general)
OWNRES Measurable/objective outcome of own work
Evaluation statistics from phase I are presented in section 5.1. Work in progress involves evaluation of annotation in phase II. The corpus can be downloaded from:
http://www.aber.ac.uk/en/ns/research/cb/projects/art/art-corpus/
3.
The AZ-II annotation scheme
3.1. The AZ-II categoriesIn contrast to CoreSC, the AZ-II annotation scheme (Ta-ble 2) models rhetorical and argumentational aspects of scientific writing, and in particular concentrates on rhetori-cal statements and on connections between the current pa-per and cited papa-pers (there are two roughly negative or ad-versarial categories (GAP WEAK and ANTISUPP), a neu-tral one that marks contrasts (CODI) and several positive ones (USEand SUPPORT).
The main ordering principle of AZ-II is based on who a given knowledge claim belongs to: the authors of the
paper, some other cited work (OTHR), or nobody in gen-eral (CO GRO). The majority of the paper is reserved for the new knowledge claim that the authors are try-ing to defend in the paper. These parts of the paper are shared between the categories OWN MTHD(methods), OWN RES (results), OWN CONC (conclusion), and local failure (OWN FAIL).
3.2. The AZ-II corpus
The AZ-II annotated corpus consists of 61 articles from the Royal Society of Chemistry. 30 of the papers are an-notated by three annotators; the remaining ones by one or two annotators. Reliability was measured on the 30 papers. More information can be found in (Teufel et al., 2009).
4.
CoreSC and AZ-II comparison
as-Table 3: Summary as-Table of category distributions and annotation performance for CoreSC categories in phase I
Category Freq. (Cohenκ)(Byrtκ) Category Freq. (Cohenκ)(Byrtκ)
Conclusion 10.56% 0.89 0.79 Experiment 16.8% 0.65 0.58
Background 16.6% 0.87 0.75 Goal 1.82% 0.6 0.58
Observation 13.68% 0.79 0.67 Hypothesis 2.39% 0.46 0.44
Object 3.48% 0.81 0.77 Motivation 2.25% 0.46 0.44
Result 18.51% 0.78 0.6 Model 5.34% 0.43 0.39
Method 9.82% 0.74 0.6
sumes that a paper is the attempt of claiming ownership for a new piece of knowledge and aims to recover the rhetorical structure and the relevant stages in this argument.
CoreSC on the other hand treats scientific papers as the humanly readable representations of scientific investiga-tions. It therefore seeks to retrieve the structure of the in-vestigation from the paper in the form of generic high-level Core Scientific Concepts. Thus, they have different focus with CoreSC containing more categories pertaining to the content of the paper whereas AZ categories elaborate on the path to various knowledge claims.
The two schemes also differ in that CoreSC so far has used expert knowledge for annotation, whereas AZ-II has been annotated by expert-trained non-experts in a proce-dure specified in (Teufel et al., 2009). The schemes have common ground, in the sense that they are both sentence based and target scientific papers. They even share some category names in common, such as “Method”, “Result” and “Conclusion”, even though these are defined differently in the two schemes and differ in granularity.
More specifically,Backgroundin CoreSC covers gen-erally accepted neutral background knowledge but also existing knowledge claims, represented in AZ-II through the OTHR, PREV OWN and CO GRO categories. The AIM category in AZ-II is a statement of research goal; In CoreSC this is split into three categories: Goal (the target state of the investigation), Hypothesis (a state-ment not yet confirmed) and Object (a statement per-taining to a particular entity-product of the investigation). Object, though, can also refer to any statement assign-ing novelty or advantage properties to a principle entity of the investigation. OWN MTHD andMethod both re-fer to methods used. However, CoreSC allows the dis-tinction into experimental method (Experiment), other types of methods used in the current workMethod-New
and methods used in other work mentioned in the pa-per (Method-Old). OWN RES corresponds to the CoreSC category Observation, which represents the data/phenomena recorded within an investigation. By con-trast, the CoreSC categoryResultpertains to the factual statements derived fromObservation. Conclusion
in CoreSC involves statements inferred from observations and results, relating to theHypothesis. AZ-II contains a category called NOV ADV, which stands for the nov-elty or advantage of the approach mentioned in the pa-per. In CoreSC, one can annotate the novelty and advan-tage ofMethodandObject. The rest of the categories are completely distinct for the two schemes. In CoreSC,
Hypothesis,Motivation,ObjectandModel com-plete the underlying investigation structure whereas in AZ-II CODI, GAP WEAK, SUPPORT, ANTISUPP, USE and FUTfollow the connection with other work and OWN FAIL expresses local failure.
5.
Annotation results
5.1. CoreSC annotation resultsThe inter-annotator agreement presented here for CoreSC is based on phase I of the corpus development (41 papers). Work in progress involves evalutation of papers in phase II (225 papers). The inter-annotator agreement for the 9 best performing annotators was κ= 0.57 for the pa-per common across all annotators (N=255,n=11,k=9)1. For the rest of the papers, the inter-annotator agreement was
κ=0.5 (N=5022,n=11,k=9). The score we report is Cohen’s
κ(Cohen, 1960), butκcalculated according to Siegel and Castellan’s (1988) formula were very similar. As the qual-ity of annotators was determined post-hoc, it is independent of group assignment. Hence, groups often consist of more and less reliable annotators. Thus, theκscore is based on an annotator’s agreement within their group, which often consisted of reliable and less reliable annotators.
The frequency and distinguishability of categories is given in Table 3. Result and Experiment are the most frequent categories at roughly 17–18.5%, the 5 least fre-quent categories taken together (Goal, Hypothesis,
Motivation, Model, Object) make up 15.28% of the corpus. Distinguishability was measured accord-ing to Krippendorff’s (1980) diagnostic, which collapses all categories but the one in focus into one category and then measures reproducibility. If it goes up sig-nificantly, this category is better distinguished than the overall distinction of categories. We report Cohen’s
κ and Byrt’s (Byrt et al., 1993) κ. Conclusion,
Background,Observation and Object are easier to recognise, whereasHypothesis,Motivationand
Model are harder to recognise than the average taken at
κ=0.55.
5.2. AZ-II annotation results
The inter-annotator agreement for the AZ-II corpus was
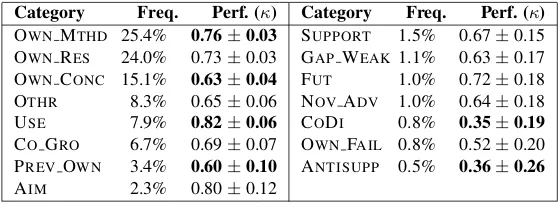
κ = 0.71 (N=3745,n=15,k=3), here reported in terms of the (Fleiss, 1971) κ. The frequency and distinguishabil-ity of categories is given in Table 5.1.. OWNMTHD and
1N stands for the number of sentences, n for the number of
Table 4: Frequency and Annotation Performance of AZ-II Categories.
Category Freq. Perf. (κ) Category Freq. Perf. (κ)
OWNMTHD 25.4% 0.76±0.03 SUPPORT 1.5% 0.67±0.15 OWNRES 24.0% 0.73±0.03 GAP WEAK 1.1% 0.63±0.17 OWNCONC 15.1% 0.63±0.04 FUT 1.0% 0.72±0.18 OTHR 8.3% 0.65±0.06 NOVADV 1.0% 0.64±0.18 USE 7.9% 0.82±0.06 CODI 0.8% 0.35±0.19
CO GRO 6.7% 0.69±0.07 OWNFAIL 0.8% 0.52±0.20 PREVOWN 3.4% 0.60±0.10 ANTISUPP 0.5% 0.36±0.26
AIM 2.3% 0.80±0.12
Table 5: Contingency table for CoreSC and AZ-II
AIMANTISUPPCODICOGROFUTGAP- NOV-OTHROWN-OWN- OWN- OWN-PREVOWNSUPPUSE 0 Total
CoreSC WEAKADV CONCFAILMTHDRES
Background 7 3 13 259 17 22 10 200 55 3 93 23 77 6 11 74 873
Conclusion 22 5 15 6 28 2 26 5 278 8 16 32 2 15 0 25 485
Experiment 1 0 1 0 0 0 0 10 5 3 608 39 10 1 184 21 883
Goal 23 0 0 1 1 0 5 0 4 0 29 3 1 0 2 1 70
Hypothesis 2 0 0 5 4 0 1 3 59 0 21 0 1 0 0 4 100
Method-New 5 0 3 0 1 0 1 1 8 0 124 5 2 0 20 13 183
Method-New-Adv 0 1 1 1 0 0 6 0 4 1 19 0 0 0 0 0 33
Method-New-Dis 0 0 0 0 0 0 0 0 2 0 2 0 0 0 0 1 5
Method-Old 0 0 0 19 0 2 0 21 1 0 30 5 15 0 30 6 129
Method-Old-Adv 0 0 0 8 0 0 4 1 0 0 0 0 1 0 0 0 14
Method-Old-Dis 0 0 0 4 0 5 0 0 1 1 0 0 1 0 0 0 12
Model 0 0 0 11 1 0 0 12 43 2 86 23 3 0 15 14 210
Motivation 0 0 0 38 0 13 2 1 2 0 4 0 4 0 0 2 66
Object-New 31 1 0 2 0 0 1 0 2 0 50 3 1 1 3 18 113
Object-New-Adv 1 0 0 1 0 0 0 0 0 0 1 0 0 0 0 0 3
Observation 3 1 2 2 0 0 0 2 27 6 45 414 3 2 4 137 648
Result 17 6 13 2 3 1 4 5 203 7 68 407 5 18 4 68 831
Total 112 17 48 359 55 45 60 261 694 31 1196 954 126 43 273 384 4658
OWNRESare the most frequent categories at roughly 24– 25%, whereas the 7 least frequent categories taken to-gether (SUPPORT, GAP WEAK, FUT, NOV ADV, CODI, OWNFAILand ANTISUPP) only make up 6.7% of the cor-pus. Distinguishability was measured according to Krip-pendorff’s diagnostic. Significance was measured using the (Fleiss et al., 1969) formula; boldfaced numbers indicate significantly better or worse performance. OWN MTHD and USE are significantly easier to recognise, whereas OWNCONC, PREV OWN, CODIand ANTISUPP are sig-nificantly harder to recognise than the average AZ-II cate-gory.
6.
The joint CoreSC-AZ set
6.1. Measured association between the two schemes
36 papers have been annotated both with AZ-II and CoreSC. This allowed us to calculate the correlation be-tween the two schemes as reflected within the papers, map categories between schemes and assess the level of their complementarity. For instance, we were able to find the relation between OWN RESandObservations, OWNCONC vsResults, Conclusionsand how the knowledge claim AZ categories are distributed among the rest of the content-based CoreSC categories.
Table 5 gives the contingency matrix between the two schemes, where the CoreSC categories constitute the rows and the AZ-II categories constitute the columns.
As a first step we wanted to assess whether there is a sta-tistically significant correlation between the two schemes, that is, whether there is some sort of association between the rows and columns of the contingency table. We calcu-lated the chi-squared Pearson statistic and the chi-squared likelihood ratio both of which showed a definite association between CoreSC and AZ-II categories. This result was fur-ther backed by the values of the contingency coefficient and Cramer’s V (Table 6)2.
However, these measures cannot give an indication of the degree of association between the two schemes or whether the association is symmetric, i.e. whether it goes both di-rections and to what extent. To obtain a measure for the differential association between CoreSC and AZ-II we cal-culated the Goodman-Kruskal lambda L statistic (Siegel and Castellan, 1988), which gives us the reduction in er-ror for predicting the categories of one annotation scheme, if we know the categories assigned according to the other scheme. When using AZ-II (columns) as the independent variable, we obtained a Goodman-Kruskal lambda of 0.38, which means that knowing the AZ-II categories assigned would help us reduce the error in predicting the CoreSC categories by 38%. When using CoreSCs as the indepen-dent variable, the reduction in prediction error of AZ-II cat-egories given CoreSC catcat-egories was calculated as 35%, according to the Goodman Kruskal lambda. To test the
sig-2
Table 7: Differential association between CoreSC and AZ-II
L P(Ho:l=.33) P(Ho:l=.35)
Goodman-Kruskal lambda (cols/AZ-II) 0.3793377 <0.00003 0.00023
Goodman-Kruskal lambda (rows/CoreSC) 0.3523975 0.0099 0.4013
Table 8: CoreSC categories expressed in terms of AZ-II
CoreSC AZ Category distribution in (%)
Background CO GRO29.6% OTHR22.9% OWNMTHD10.65% PREV OWN8.8% 0 8.4% OWNCONC
6.3% OWNRES2.6% GAPWEAK2.5% FUT1.9% USE1.26% NOVADV1.13% AIM0.8% SUPPORT0.68% (OWNFAIL, ANTISUPP) 0.34%
Conclusion OWNCONC57.31% OWNRES6.59% FUT5.77% NOVADV5.36% 0 5.15% AIM4.53% OWNMTHD3.3% (CODI, SUPPORT) 3.1% OWNFAIL1.64% COGRO1.23% (ANTISUPP
, OTHR) 1% (GAP WEAK, PREV OWN) 0.41%
Experiment OWNMTHD 68.85% USE20.8% OWNRES 4.41% 0 2.37% (OTHR , PREVOWN) 1.1% OWNCONC0.56% OWN FAIL0.33% (AIM, SUPPORT, CODI) 0.11%
Goal OWNMTHD 41.4% AIM 32.86% NOVADV7.1% OWNCONC5.71% OWNRES 4.28% USE2.85% (CO GRO, FUT, PREVOWN,0) 1.4%
Hypothesis OWNCONC 59% OWNMTHD 21% COGRO 5% (FUT ,0) 4% OTHR 3% AIM 2% (NOV ADV, PREVOWN) 1%
Method-New OWNMTHD67.75% USE10.9% 0 7.1% OWN CONC4.37% (AIMOWNRES) 2.73% CODI
1.64% PREVOWN1% (FUT, NOVADV, OTHR) 0.5%
Method-New-Advantage OWNMTHD57.57% NOVADV18.1% OWNCONC12.1% (ANTISUPP, CODI, COGRO, OWNFAIL) 3%
Method-New-Disadvantage OWNMTHD40% OWNCONC40% 0 20%
Method-Old (OWNMTHD , USE) 23.25% OTHR 16.27% CO GRO 14.7% PREV OWN11.6% 0 4.6% OWNRES3.87% GAP WEAK1.5% OWNCONC0.77%
Method-Old-Advantage CO GRO57.14% NOV ADV28.43% (OTHR, PREVOWN) 7.1%
Method-Old-Disadvantage GAP WEAK41.66% CO GRO33.3% (OWNCONC, OWNFAIL, PREVOWN) 8.33% Model OWNMTHD 40.95% OWNCONC20.47% OWN RES10.95% USE7.14% 0 6.66% OTHR
5.71% CO GRO5.23% PREV OWN1.42% OWNFAIL0.95% FUT0.47%
Motivation CO GRO 57.57% GAP WEAK 19.69% (OWNMTHD , PREV OWN) 6% (SUPPORT , OWNCONC,0) 3% OTHR1.5 %
Object-New OWNMTHD 44.2% AIM 27.43% 0 15.9% (OWNRES , USE) 2.65% (CO GRO , OWNCONC) 1.76% (ANTISUPP,SUPPORT, NOVADV, PREV OWN) 0.88%
Object-New-Advantage (AIM, COGRO, OWNMTHD) 33.33%
Observation OWNRES63.88% 0 21.1% OWNMTHD6.94% OWNCONC4.16% OWNFAIL0.93% USE
0.62% (AIM, PREVOWN) 0.46% (CODI, COGRO, OTHR, SUPPORT) 0.3% ANTISUPP
0.15%
Result OWNRES 48.97% OWNCONC24.4% (OWNMTHD,0) 8.2% SUPPORT2.16% AIM2% CODI1.56% OWNFAIL0.84% ANTISUPP0.72% (OTHR, PREV OWN) 0.6% (NOV ADV, USE) 0.48% FUT0.36% COGRO0.24% GAP WEAK0.12%
same holds for OWN MTHD and the CoreSC Method, since OWN MTHDis expressed as 50.84%Experiment, 14.64%Method(incl. properties), 7.78%Background, 7.19% Model, 5.68% Result, 4.18% Object-New. NOV ADV(novelty or advantage of own approach) is 49.06% Conclusion, 15.09% Background, 11.32%
Method-New-Advantage, 9.43%Goal. This is sim-ilar in principle to Method-New-Advantage (hence the overlap), but is broader as it is not necessarily con-fined to methods. GAP WEAK(lack of solution in field) is 48.88%Background, 28.88%Motivation, 11.11%
Method-Old-Disadvantage, 4.44%Method-Old, 4.44%Conclusion). The overlap with Motivation
andMethod-Old-Disadvantageis encouraging with respect to the semantics of the two schemes.
The rest of the AZ-II categories permeate across
dif-ferenct CoreSC concepts, which is what we expect since by design they follow the progress of knowledge claims. For example, PREV OWN (knowledge claim held by the author’s in previous paper) is 61.1% Background
and 11.9% Method-Old. CO GRO(No knowledge claim) is 72.06%Background, 10.61%Motivation, 8.64%Method-Oldand 3% Model. OTHR(Significant knowledge claim made by other researchers) is 76.63%
Background, 8.05% Method-Old, 4.6% Model, 3.83%Experiment. USE(other work used in own work) is 67.4% Experiment, 10.99% Method-Old, 7.33%
Method-New, 5.49% Model. CODI(neutral compar-ison to other work) is 31.25% Conclusion, 27.1%
Result, 27.1% Background, 8.35% Method-New, 4.16% Observation. SUPPORT(other work
Table 9: AZ-II categories expressed in terms of CoreSC
AZ-II CoreSC Category distribution in (%)
AIM Object-New 27.67 % Goal 20.53% Conclusion 19.64% Result 15.18%
Background 6.25% Method-New 4.46% Observation 2.67% Hypothesis 1.78% (Object-New-Advantage,Experiment) 0.89%
ANTISUPP Result 35.29% Conclusion 29.41% Background 17.64% (Object-New, Method-New-Advantage,Observation) 5.88%
CODI Conclusion 31.25% (Background,Result) 27.1% Method-New 6.25% Observation 4.16% (Method-New-advantage,Experiment) 2.1%
COGRO Background 72.14% Motivation 10.61% Method-Old 5.3% Model 3.07%
Method-Old-Advantage 2.23% Conclusion 1.67% Hypothesis 1.4%
Method-Old-Disadvantage 1.11% (Object-New-Advantage,Observation,Result) 0.56% (Goal,Object-New-Advantage,Method-New-Advantage) 0.28%
FUT Conclusion 50.9% Background 30.9% Hypothesis 7.27% Result 5.45%
(Goal,Method-New,Model) 1.81%
GAP WEAK Background48.88% Motivation 28.88% Method-Old-Disadvantage 11.11% (Method-Old, Conclusion) 4.44%Result2.22%
NOVADV Conclusion 49.06% Background 16.66% Method-New-Advantage 11.32% Goal 9.43% (Result,Method-Old-Advantage) 7.54% (Hypothesis,Object-New,Method-New,Motivation) 1.88%
OTHR Background76.63%Method-Old8.05%Model4.6%Experiment3.83% (Result,Conclusion) 1.91%Hypothesis1.14%
Observation 0.77% (Motivation, Method-New-Advantage,Method-Old-Disadvantage) 0.38%
OWNCONC Conclusion 40.06% Result 29.25% Hypothesis 8.5% Background 7.92% Model 6.19% Observation3.89% Method-New1.15% Experiment0.72% (Goal,Method-New-Advantage) 0.58% (Motivation, Method-New-Disadvantage,Object-New) 0.28% (Method-Old,Method-Old-Disadvantage) 0.14%
OWNFAIL Conclusion 25.8% Result 22.58% Observation 19.35% (Background,Experiment) 9.68% Model6.45% (Method-Old-Disadvantage, Method-New-Advantage) 3.22%
OWNMTHD Experiment 50.84% Method-New 10.37% Background 7.78% Model 7.19% Result 5.68% Object-New 4.18% Observation 3.76% Method-Old 2.5% Goal 2.42% Hypothesis 1.76% Method-New-Advantage 1.59% Conclusion 1.34% Motivation 0.34%
Method-New-Disadvantage0.17%Object-New-Advantage0.08%
OWNRES Observation43.4%Result42.66%Experiment4%Conclusion3.35% (Background,Model) 2.41% (Method-New,Method-Old) 0.52% (Goal,Object-New) 0.31%
PREVOWN Background 61.1% Method-Old 11.9% Experiment 7.94% Result 3.97% Motivation 3.17% (Model,Observation) 2.38% (Method-New,Conclusion) 1.59% (Hypothesis,Goal,Object-New,Method-Old-Advantage,Method-Old-Disadvantage) 0.79%
SUPPORT Result43.9%Conclusion36.59%Background14.63%Observation4.88%
USE Experiment 67.4% Method-Old 10.99% Method-New 7.33% Model 5.49% Background 4% (Observation,Result) 1.46%Object-New1%Goal0.73%
unassigned(0) Observation35.68%Background19.27%Result17.7%Conclusion6.5%Experiment5.47% Object-New4.69%Method-New3.39%Method-Old1.56%Hypothesis1%Motivation0.5% (Goal,Method-New-Advantage) 0.25%
Conclusion, 14.63% Background and 4.88%
Observation. ANTISUPP(clash with other work and superiority of own) is 35.29% Result, 29.41%
Conclusion, 17.64% Background and 5.88% for each of Object-New, Method-New-Advantage
andObservation. FUT(statements about future work) is 50.9% Conclusion, 30.9% Background, 7.27%
Hypothesis and 5.45% Result. OWNFAIL(a so-lution/method/experiment in the paper that didn’t work) is 25.8% Conclusion, 22.58% Result, 19.35%
Observation, 9.68% for each of Experiment and
Backgroundand 6.45%Model.
Interestingly, the categories that remain unassigned by
AZ-II seem to spread across different CoreSCs, with the majority being assigned toObservation(35.68%),
Background (19.27%) and Result (17.7%). This indicates that the AZ-II OWN RES doesn’t quite cover
Observation and Result. Unassigned AZ-II sen-tences also includeConclusion(6.5%),Experiment
(5.47%), Object-New (4.69%) and Method-New
(3.39%).