Drift Detection Based Model Selection
Framework For Real-Time Anomaly Detection In
Iot
Sanjith S L, Dr. E George Dharma Prakash Raj
Abstract: Increased automated devices has not only increased dependencies on such devices, but also the increased attacks on them. Although several anomaly detection architectures exists in literature, the specific issues observed in this domain requires specialized anomaly detection models. This paper presents an effective model selection framework that selects anomaly detection models based on the level of concept drift existing in the data. The temporal aspects of the data are decomposed to determine the drift level. Depending on the levels, three varied models have been constructed and used for effective detection of anomalies. Experiments were performed in benchmark datasets and comparisons were performed with recent works in literature. Comparisons indicate effective performance of the proposed model.
Index Terms: Anomaly Detection; IoT; Concept Drift; Temporal data; Trend; Ensemble Model
————————————————————
1I
NTRODUCTIONIncreasing necessity for automated architectures has resulted in a huge increase in the number of Internet of Things (IoT) based devices [1]. People have been accustomed to automated architectures and this demand is increasing day by day. Attacks on IoT based devices is one of the major concerns at this point. With the increase in the number of IoT based architectures, the number of threats on IoT devices are also growing to a large extent. Detecting anomalies in these architectures are also considered, however, the complexities associated with IoT devices increases the difficulty levels in identifying anomalies [2,3]. Machine learning algorithms are the general go-to solutions for such issues. The machine learning models bring both automation and speed to the prediction process. Although being highly beneficial, machine learning models also face several issues when it comes to predictions on streaming sensor data [4]. Learning from data streams is of primal importance for any machine learning model.
However, the issues in the data has a very drastic impact on the models. Concept drift is one major issue faced by models in streaming environments [5]. Concept drift or drift is the process of change in the distribution of data. The change can be fast and drastic or can also be slow and gradual [6]. Considering the IoT environment, concept drift occurs when data transmission levels vary due to changes in user’s behavior. This incorporates a temporal aspect in the streaming data. Concept drift requires continuous learning from the part of the learning model. The remainder of this paper is structured as follows; section II provides the literature review, section III presents the proposed model, section IV presents the results and discussion and section V concludes the work. IJSTR staff will edit and complete the final formatting of your paper.
2
R
ELATED WORKSAnomaly detection in IoT has become one of the major requirements of the today’s interconnected world. This is one of the research domains that is currently in its growth stage. This section discusses some of the most recent contributions in the domain of anomaly detection on IoT data. Usage of machine learning models to identify anomalies in IoT data has become one of the highly explored areas. An analysis of multiple machine learning models and their performance in detecting anomalies in IoT sensor data was discussed by Hasan et al. [7]. This work applies multiple machine learning models on sensor data to identify anomalies. A comparison of the performances indicates Random Forest to be the best performer in terms of detecting anomalies. An unsupervised model to detect anomalies in streaming data was proposed by Ahmad et al. [8]. The detection model is based on the Hierarchical Temporal Memory algorithm. The unsupervised nature of the algorithm aims to handle concept drifts effectively in data streams. Other clustering based models that for online anomaly detection includes a distributed model by Chen et al. [9], an online drift detection model by Spinosa et al. [10], a multi-class based model by Faria et al. [11], a dynamic k-means model by Lee et al. [12] and the RampLoss model by Bamakan et al. [13].Concept drift has become one of the major issues in the data generated from IoT devices. A real-time _________________________________
Sanjith S L is working as Systems Administrator in Indian Institute of management Tiruchirappalli. He has more than 18 years of experience in the Planning, Designing, Implementation and Management of IT Infrastructure of reputed organizations out of which 12 + years in academic organizations. Currently he is pursuing PhD in Computer Science and Engineering from Bharathidasan University, India, E-mail: [email protected] Dr. E. George Dharma Prakash Raj completed his Master’s Degree
647 [14]. This model proposes a parallel classifier that uses the
Micro-Cluster Nearest Neighbor classifier model and operates on Big Data generated from numerous IoT devices to provide predictions. A detection mechanism that identifies the presence of concept drift was proposed by Dernsar and Bosnic [15]. Concept drift is detected using the process of model explanation. The model also proposes micro and macro visualization mechanisms that can be useful in detecting and interpreting concept drift. The process of detection is performed by combining multiple model explanations over time and observing the changes. An ensemble based concept drift modelling technique was proposed by Iwashita et al. [16]. The model proposes the Optimum Path Forest model that is created as an ensemble to identify and handle concept existing in data streams. The model proposes to handle both sudden variations and also slow and gradual variations effectively. Other similar ensembles for handling concept drift in streaming data includes LOCE model by ZareMoodi et al. [17], weighted voting based ensemble model by Stanley et al. [18] and weighted ensemble model by Kolter and Maloof [19]. A novel framework to handle adversarial concept drift was proposed by Sethi and Kantardzic [20]. The model proposes the Predict-Detect framework to handle concept drift in streaming data. An unsupervised model for identifying concept drift in data streams was proposed by Mello et al. [21]. This model employs McDiarmid’s inequality to provide the level of divergence. A model to build an anomaly detection engine for IoT based smart applications was proposed by Mohamudally and Mohaboob [22]. This work presents the issues and challenges encountered in designing an anomaly detection model for smart devices. A dynamic model selection approach for environments exhibiting concept drift was proposed by Almeida et al. [23]. This technique models a time dependency, thereby effectively modelling the concept drift levels. Other similar models that can effectively handle concept drift in unsupervised scenarios include models by Spinosa et al. [24], Masud et al. [25], Sethi and Kantardzic [26] and Faria et al. [27].
3
P
ROPOSEDT
EMPORAL BASEDM
ODELS
ELECTION FORI
OT
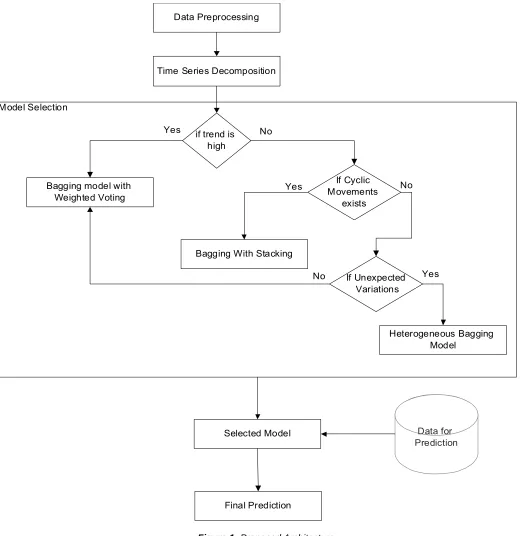
The proposed model identifies time series based components available in the streaming data to identify the type of ensemble suitable for the prediction process. The proposed architecture is shown in figure 1.
3.1 Data Preprocessing
The input data obtained from IoT devices can be composed of
data containing several types of data. Numerical data is the only format that is acceptable by the machine learning models, however the data might contain data in several formats. One major format encountered in automatically generated data is categorical data types. These types are to be converted to numerical formats by using techniques like one-hot-encoding. The resultant data can be in varied ranges. To enable faster and effective model creation, the data is normalized to convert data into defined range levels. This completes the preprocessing stage, and the resultant data can be used for machine learning.
3.2 Time Series Decomposition
Figure 1: Proposed Architecture
3.2.1. Trend
Trend represents the overall movement of data. The value can be increasing or decreasing. The upward or downward movement of data results in creating a trend. Presence of trend in the data indicates a change in the behavior of data. Trend is usually long term. Hence it can be observed only on data collected for sufficient time. Trends in IoT data are unavoidable, as the current scenario sees a huge adoption in such devices, hence leading to a huge increase in the number of users. Trends can be identified in a data by fitting a linear model to the data and identifying the intercept and the
co-3.2.2. Seasonality
649 3.2.3. Cyclic Movements
Cyclic movements are similar to seasonality based variations, however, they are long term recurring patterns. They are cyclic; however, the cyclic nature has a longer time extension compared to seasonality, hence are difficult to identify. These patterns can be observed on the trend lines. Identifying and isolating these movements is mandatory for providing effective predictions.
3.2.4. Unexpected Variations
Unexpected variations are sudden changes in the data patterns that cannot be categorized under any of the previously defined terms. These are sometimes termed as noise. However, these patterns cannot be totally ignored. They must be treated carefully to ensure efficiency of the model. These might even correspond to missed cyclic patterns or the initial occurrence of a cyclic pattern. If identified as short term or one-time occurrence, they can be eliminated. A model handling such data should be robust to effectively manage such instances. These patterns in their initial stage pose as outliers. Hence the machine learning model must be robust to handle these issues appropriately without bias.
3.3. Model Designs
The model designs for the proposed model is made in three levels. The first level model is a bagging based machine learning model to handle data exhibiting high trend levels. The next level model integrates stacking with the bagging approach to handle cyclic redundancies and the next level model is designed with heterogeneous bagging models to handle unexpected variations.
3.3.1. Level 1
The level 1 model is constructed as a bagging model with a voting combiner [28]. The bagging model is composed of three phases. The bag creation phase, base learner training phase and the combiner phase. The bags are created by dividing the data into multiple overlapping subsets. These subsets are passed to multiple base learners and training is performed. The trained models are used for prediction. The models however provide multiple predictions. Significance of each base learner is weighed based on the prediction accuracy. The predictions are combined based on the weights and the final predictions are returned. The bagging model with weighted voting enables effective analysis on data exhibiting high trend levels. High trend levels in data indicates faster changes. This in turn shows that the domain is evolving at a faster phase and hence the drift level is higher. This results in training data exhibiting low representation levels for each of the data. Hence such data requires models that can operate on small amount of data to provide effective predictions. Homogeneous models operating on overlapped subsets can operate better in such scenarios, as the domain only contains limited data. Constructing multiple similar models as a part of the bagging process reduces under-fitting to a large extent by capturing high fluctuations in the trend levels effectively.
3.3.2. Level 2
The level 2 model is constructed as an extension of the begging model. This model is composed of a stacking architecture, that
enables effective capturing of cyclic movements in the data along with the regular trends [29]. The stacking model is composed of a two level architecture. The first level is the bagging architecture, which uses multiple homogeneous models and trains them based on data subsets. The second level is called the meta model, which is trained on the predictions obtained from the first level architecture. The meta model learns the prediction patterns of the first level models to provide the final prediction. Bagging model incorporated with stacking mechanism is effective on data exhibiting low trend levels and data containing cyclic movements. If multiple cyclic patterns are observed in the data, the level 2 model can be used for effective predictions. Cyclic movements in data exhibits repeating patterns in data. Learning such complex patterns along with the trends is complex. A multi-level model with bagging mechanism can effectively enable learning of such complex patterns. Such complex patterns can also be modelled based on the time based changes, hence enabling effective predictions.
3.3.3. Level 3
Level 3 model is constructed by combining a heterogeneous bagging model combined with a voting combiner [30]. This model was observed to exhibit high immunity towards unexpected variations in the data. The heterogeneous bagging model is constructed by using varied classifier models for each of the base learner. The results from each of these models is combined using a voting combiner to provide the final predictions. The heterogeneous bagging ensemble can be effectively applied on data with unexpected variations in the data, or in other words, noisy data. Unexpected variations leads to outliers, which in turn can be major causes of bias in the models. These outliers can sometimes even depict actual predictions and not anomalies. Hence a robust model that can isolate and operate on such instances is necessary. Utilizing a heterogeneous model for prediction can effectively accommodate such variations, and bias in one model can be overridden by other models, hence enabling effective predictions.
4
R
ESULT ANDD
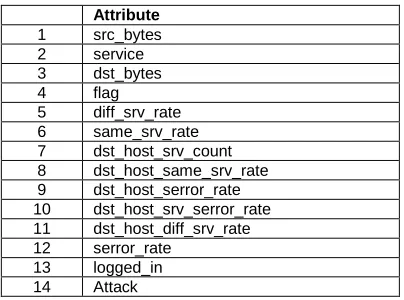
ISCUSSIONSThe proposed model for drift detection and the multi-level prediction models have been implemented using Python. NSL-KDD dataset is used to measure the performance of the model. Details about the NSL-KDD dataset is shown in table 1 below.
Table 1. Attributes of NSL-KDD Dataset
Attribute 1 src_bytes 2 service 3 dst_bytes 4 flag 5 diff_srv_rate 6 same_srv_rate 7 dst_host_srv_count 8 dst_host_same_srv_rate 9 dst_host_serror_rate 10 dst_host_srv_serror_rate 11 dst_host_diff_srv_rate 12 serror_rate
ROC curve, depicting the performance of the proposed model in terms of TPR and FPR is shown in figure 2. It could be observed that the ROC curve exhibits highest TPR levels of 99% and very low FPR levels 0.5%. This shows that the proposed model exhibits high anomaly detection levels, hence enabling effective predictions.
Figure 2 :ROC Curve Analysis
PR curve depicting the precision and recall levels of the proposed model is shown in figure 3. High precision and high recall levels are required for an effective prediction model. It could be observed that the proposed model exhibits very high precision and recall levels (>99%). This shows that the proposed model exhibits high prediction levels. Hence it could be proved that the drift detection architecture functions effectively to identify the appropriate models, hence making accurate predictions.
Figure 3: PR Curve Analysis
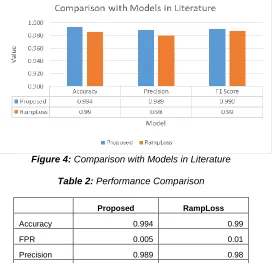
Comparisons is performed with the RampLoss model [13], to identify the effectiveness of the proposed model. It could be observed from figure that the proposed model exhibits higher predictions in terms of all the metrics when compared with the RampLoss model. This depicts the efficiency of the proposed model. A tabulated view of the metrics is shown in table 2.
Figure 4: Comparison with Models in Literature
Table 2: Performance Comparison
Proposed RampLoss
Accuracy 0.994 0.99
FPR 0.005 0.01
Precision 0.989 0.98
F1 Score 0.990 0.99
5
R
ESULT ANDD
ISCUSSIONSWidespread use of IoT systems mandates effective anomaly detection models to ensure safety of user’s information. The property of concept drift associated with the streaming domain complicates the prediction process. This work presents a multi level model, that identifies the level of drift to select the appropriate classifier model for prediction. Three models have been defined, which can be used for varied drift levels. A drift identification module has been proposed, that decomposes the temporal components to identify the occurrence of drift. The level of drift is identified and the model that can be appropriately used for training and predicting on that data is selected and used for prediction. Experimental results compared with existing models in literature exhibits high performance of the proposed model.
A
CKNOWLEDGMENTWe are indebted to our colleagues, Bharathidasan University and our friends for the kind support provided during our study.
R
EFERENCES[1] V. Chandola, V. Mithal, V. Kumar, Comparative evaluation of anomaly detection techniques for sequence data, in: Proceedings of the 2008 Eighth IEEE Interna- tional Conference on Data Mining, 2008, pp. 743–748, doi: 10.1109/ICDM.2008. 151 .
[2] A. Lavin, S. Ahmad, Evaluating real-time anomaly detection algorithms –the Numenta anomaly benchmark, in: Proceedings of the 14th International Con- ference on Machine Learning Application, Miami, Florida, IEEE, 2015, doi: 10. 1109/ICMLA.2015.141 .
651 concept drifts, Neurocomputing 191 (2016) 304–329, doi:
10.1016/j.neucom.2016.01.049 .
[5] A.J. Fox , Outliers in time series, J. R. Stat. Soc. Ser. B. 34 (1972) 350–363 .
[6] Somasundaram, A., & Reddy, S. (2019). Parallel and incremental credit card fraud detection model to handle concept drift and data imbalance. Neural Computing and Applications, 31(1), 3-14.
[7] Hasan, M., Islam, M. M., Zarif, M. I. I., & Hashem, M. M. A. (2019). Attack and anomaly detection in IoT sensors in IoT sites using machine learning approaches. Internet of Things, 7, 100059.
[8] Ahmad, S., Lavin, A., Purdy, S., & Agha, Z. (2017). Unsupervised real-time anomaly detection for streaming data. Neurocomputing, 262, 134-147.
[9] P.Y. Chen, S. Yang, J.A. McCann, Distributed real-time anomaly detection in net- worked industrial sensing systems, IEEE Trans. Ind. Electron 62 (2015) 3832–3842, doi: 10.1109/TIE.2014.2350451 .
[10] E.J. Spinosa, A.P.D.L.F. De Carvalho, J. Gama, OLINDDA: a cluster-based approach for detecting novelty and concept drift in data streams, in: Proceedings of the 2007 ACM Symposium on Applied Computing, 2007, pp. 448–452, doi: 10.1145/ 1244002.1244107 .
[11] E.R. Faria, J. Gama, A.C. Carvalho, Novelty detection algorithm for data streams multi-class problems, in: Proceedings of the 28th Annual ACM Symposium on Applied Computing, 2013, pp. 795–800, doi: 10.1145/2480362. 2480515 .
[12] S. Lee, G. Kim, S. Kim, Self-adaptive and dynamic clustering for online anomaly detection, Expert Syst. Appl. 38 (2011) 14891–14898, doi: 10.1016/j.eswa.2011. 05.058 . [13] Bamakan, S. M. H., Wang, H., & Shi, Y. Ramp loss
K-support vector classification-regression; a robust and sparse multi-class approach to the intrusion detection problem. Knowledge-Based Systems, 126, pp.113-126 (2017).
[14] Tennant, M., Stahl, F., Rana, O., & Gomes, J. B. (2017). Scalable real-time classification of data streams with concept drift. Future Generation Computer Systems, 75, 187-199.
[15] Demšar, J., & Bosnić, Z. (2018). Detecting concept drift in data streams using model explanation. Expert Systems with Applications, 92, 546-559.
[16] Iwashita, A. S., de Albuquerque, V. H. C., & Papa, J. P. (2019). Learning concept drift with ensembles of optimum-path forest-based classifiers. Future Generation Computer Systems, 95, 198-211.
[17] P. ZareMoodi, H. Beigy, S.K. Siahroudi, Novel class detection in data streams using local patterns and neighborhood graph, Neurocomputing 158 (2015) 234– 245.
[18] K. Stanley, Learning Concept Drift with a Committee of Decision Trees, Tech. Rep. AI03-302, The University of Texas at Austin, Department of Computer Sciences, 2003. J. Kolter, M. Maloof, Dynamic weighted majority: An ensemble method for drifting concepts, J. Mach. Learn. Res. 8 (2007) 2755–2790.
[19] Sethi, T. S., & Kantardzic, M. (2018). Handling adversarial concept drift in streaming data. Expert Systems with Applications, 97, 18-40.
[20] de Mello, R. F., Vaz, Y., Grossi, C. H., & Bifet, A. (2019). On learning guarantees to unsupervised concept drift detection
on data streams. Expert Systems with Applications, 117, 90-102.
[21] Mohamudally, N., & Peermamode-Mohaboob, M. (2018). Building An Anomaly Detection Engine (ADE) For IoT Smart Applications. Procedia computer science, 134, 10-17.
[22] Almeida, P. R., Oliveira, L. S., Britto Jr, A. S., & Sabourin, R. (2018). Adapting dynamic classifier selection for concept drift. Expert Systems with Applications, 104, 67-85.
[23] Spinosa, E. J., de Leon F. de Carvalho, A. P., & Gama, J. a. (2007). Olindda: A cluster-based approach for detecting novelty and concept drift in data streams. In Proceedings of the 2007 ACM Symposium on Applied Computing SAC ’07 (pp. 448–452). New York, NY, USA: ACM.
[24] Masud, M. M., Chen, Q., Gao, J., Khan, L., Han, J., & Thuraisingham, B. (2010). Classification and novel class detection of data streams in a dynamic feature space. In Proceedings of the 2010 European Conference on Machine 695 Learning and Knowledge Discovery in Databases: Part II ECML PKDD’10 (pp. 337–352). Berlin, Heidelberg: Springer-Verlag.
[25] Sethi, T. S., & Kantardzic, M. (2017). On the reliable detection of concept drift from streaming unlabeled data. Expert Syst. Appl., 82 , 77–99.
[26] Faria, E. R., Gama, J. a., & Carvalho, A. C. P. L. F. (2013). Novelty detection algorithm for data streams multi-class problems. In Proceedings of the 630 28th Annual ACM Symposium on Applied Computing SAC ’13 (pp. 795–800). New York, NY, USA: ACM.
[27] Sanjith S L, E George Dharma Prakash Raj "Reinforcement based Heterogeneous Ensemble for Anomaly Detection in Streaming Environment ", International Journal of Intelligent Enterprise, (DOI: 10.1504/IJIE.2019.10022335 )
[28] Sanjith S L, E George Dharma Prakash Raj " Decentralized Bagged Stacking Ensemble Model (DBSEM) for Anomaly Detection ", Lecture Notes in Networks and Systems, (In communication)