JOHNSON MATTHEY
TECHNOLOGY REVIEW
www.technology.matthey.com
Methane Emission Control
A review of mobile and stationary source emissions abatement technologies for
natural gas engines
By Agnes Raj
Johnson Matthey Technology Centre, Blount’s Court, Sonning Common, Reading RG4 9NH, UK
Email: [email protected]
Natural gas is of increasing interest as an alternative fuel for vehicles and stationary engines that traditionally use gasoline and diesel fuels. Drivers for the adoption of natural gas include high abundance, lower price and reduced greenhouse gas emissions compared to other fossil fuels. Biogas is an option which could reduce such emissions further. The regulations which cap emissions from these engines currently include Euro VI and the US Environmental Protection Agency (EPA) greenhouse gas legislation. The regulated emissions limits for methane, nitrogen oxides (NOx) and particulate matter (PM) for both stoichiometric and lean burn compressed natural gas engines can be met by the application of either palladium-rhodium three-way catalyst (TWC) or platinum-palladium oxidation catalyst respectively. The drivers, policy and growth of this Pd based catalyst technology and its remaining challenges to be overcome in terms of cost and catalyst deactivation due to sulfur, water and thermal ageing are described in this short review.
Introduction
There is increased interest in recent years in replacing traditional gasoline and diesel fuels with natural gas for
a number of reasons, such as increasing energy prices, depletion in oil resources and political uncertainty, but mainly due to increasing concern about global warming (1). Natural gas is composed mainly of methane (typically 70–90%) with variable proportions of other hydrocarbons such as ethane, propane and butane (up to 20% in some deposits) and other gases (2, 3). It can be commercially produced from oil or natural gas fields and is widely used as a combustion energy source for power generation, industrial cogeneration and domestic heating. It can also be used as a vehicle fuel. Natural gas has a number of environmental benefits: it is a cleaner burning fuel typically containing few impurities, it contains higher energy (Bti) per carbon than traditional hydrocarbon fuels resulting in low carbon dioxide emissions (25% less greenhouse gas emissions), and it has lower emissions of PM and NOx compared to diesel and gasoline. In the EU there is an aim for more than a 60% reduction in CO2 emissions from transport by 2050 from 1990 levels (4) and using natural gas as a vehicle fuel can contribute to this (1). From the economic point of view, natural gas can be less expensive than diesel and gasoline. For example Table I displays gasoline, diesel and natural gas prices during 2014 and 2015 (5, 6).
Table I Comparison between Gasoline, Diesel and Natural Gas prices 2014–2015 (5, 6)
Fuel Price, US$ per GGEa
July 2014 October 2015
Gasoline 3.70 2.35
Diesel 3.51 2.30
Natural Gas 2.17 2.09
aGGE = gasoline gallon equivalent
predicted 30% average annual growth especially in internal combustion engines.
This short review focuses on the demand, policies and growth of natural gas globally and methane abatement via aftertreatment systems for mobile and stationary applications.
Legislation and Challenges
Natural gas engines emit very low PM and NOx (up to 95% and 70% less, respectively) compared to heavy-duty and light-duty diesel engines. Presently, methane is not included in criteria emissions regulations, but the US EPA greenhouse gas legislation caps methane emissions at 0.1 g bhp–1 h–1 for heavy-duty engines and 0.05 g mile–1 for pickup trucks and vans (7). Euro VI natural gas vehicles are required to meet both total hydrocarbon (THC) and methane emissions limits and therefore need methane emission control aftertreatment devices. The current EU emission standards for heavy-duty gas engines are shown in Table II. The methane limits apply for only gas engines and the PM limit is not an issue for CNG vehicles.
The US EPA has also proposed new standards towards meeting the US government’s pledge to reduce the methane emissions mainly from the oil and gas sectors by 40–45% by 2025 from 2012 level (9).
This is further emphasised recently in May 2016 to limit methane emissions from industry leaking compressors, wells and pumps (10).
Natural Gas Resources and the Natural Gas Vehicles Market
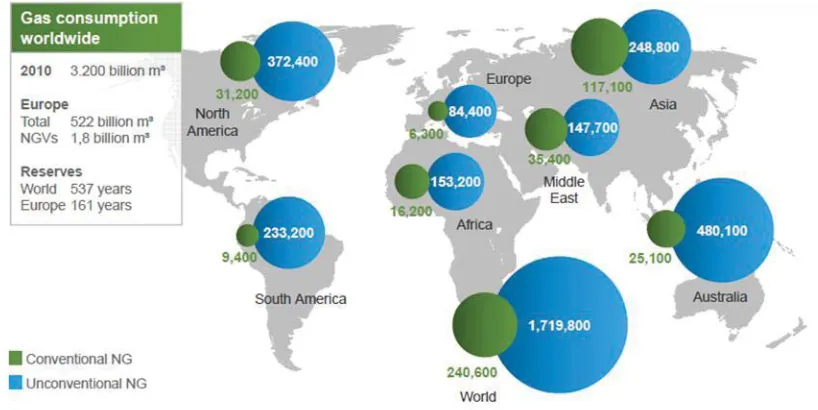
Natural gas is available in abundance worldwide. As shown in Figure 1, the worldwide proven reserves of
3
natural gas exceed 204.7 × 10¹² m and world gas reserves will last for 537 years, another 161 years in Europe (1).
The worldwide natural gas vehicle population increased at an average growth rate of 20% per annum between 1991 and 2007 and some sources predict it to increase further as shown in Figure 2 (11).
Fuel Options
Natural gas can be used as transportation fuel in the form of CNG and liquefied natural gas (LNG). CNG is carried in tanks pressurised to 3600 psi (~248 bar) and has an energy density around 35% of gasoline per unit volume (12). LNG has an energy density 2.5 times that of CNG and is mostly used for heavy-duty vehicles. It is cooled to liquid form at –162ºC and as a result the volume is reduced 600 fold meaning LNG is easier to transport than CNG (2). In general, natural
Table II EU Emission Standards for Heavy-Duty Gas Engines: Transient Testing (8)
Stage Date Test
Limit, g kWh–1
CO NMHC CH4 NOx PM European Transient
Euro V October 2008 Cycle (ETC) 4.0 0.55 1.1 2.0 0.03
World Harmonised
Euro VI January 2013 Transient Cycle 4.0 0.16 0.5 0.46 0.01 (WHTC)
Fig. 1. Worldwide natural gas reserves (units = 109 m3) (1). Source: NGVA Europe
(a)
Number of vehicles, thousands
600
400
200
0
Light-duty, % Medium- and heavy-duty, %
0.05 0.14 0.5 1.4
Light-duty vehicles
Medium- and heavy-duty vehicles 17%
2009 2010 20112012 2013 2014 2015 2016 2017 2018 2019 2020
129 135 143 159 171 200
237 282
328 382 448
520
45 52 56 68 80 93 91
49 87 84
337 285 239 204 176 144 119 103
103 183
143 124 105
2001 1.7 M NGV
2007 7 M NGV
Jan 2011 13M NGV
163
CAGR 2013–2020
15–20%
12–18%
Number of vehicles, millions
80 70 60 50 40 30 20 10 0
15% 26% 18% (assumed)
annual growth
2020 65 M NGV (9% market)
1991 1995 1999 2003 2007 2011 2015 2019 2023 7%
(b)
10 years 6 years 13 years
Fig. 2. CNG vehicles in: (a) USA, where CAGR ranges are based on different assumptions regarding CNG vehicle adoption and penetration (in %) is calculated relative to all vehicles currently in use in the USA; and (b) Europe markets as a proportion of worldwide natural gas vehicle with 5% market share for Europe in 2020 and 9% possible for Europe in 2030 (11) (Reproduced with kind permission from Eunseok Kim, Heesung Catalysts, South Korea)
gas vehicles are more expensive than petrol or diesel vehicles mainly due to the cost of the high-pressure or insulated fuel tank which is required to store LNG or CNG.
Alternatively, using gas-to-liquids (GTL) technology (13), the natural gas can be converted to liquid fuels which have ignition characteristics similar to diesel or gasoline fuels and can be used for transportation purposes. Other options include reforming natural gas
to generate hydrogen for hydrogen fuel cell vehicles and generation of electricity for electric vehicles by firing a power plant by natural gas (14).
incentives such as reduced duties in various countries or regions (19).
Emission Aftertreatment Technologies
Based on the combustion conditions, two main operating modes are used for methane fuelled engines: stoichiometric conditions (λ = 1) and lean burn conditions (λ ≥ 1.3). Figure 3 (11) shows the CO2 emission comparison of the various technologies, and it can be seen that natural gas contributes lower emissions than diesel under all conditions.
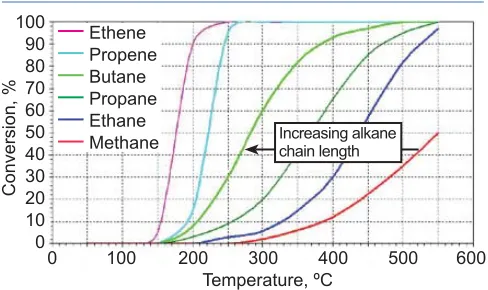
Methane is the least reactive hydrocarbon and high energy is required to break the primary C–H bond. The
ignition temperature of alkanes generally decreases with increasing fuel to air ratio and increasing hydrocarbon chain length which correlates with the C–H bond strength. Palladium-based catalysts are well known as the most active type of catalyst for methane oxidation.
Figure 4 illustrates how different hydrocarbon species are converted to CO2 and H2O under lean conditions with increasing exhaust temperature over a Pd based catalyst. It is shown that methane has a higher light-off temperature compared to other hydrocarbons, reaching 50% conversion at 550ºC.
When operating in stoichiometric conditions (λ = 1), a TWC is used as an effective and cost effi cient aftertreatment system to combust methane. Mostly bimetallic Pd-Rh catalysts with high total platinum
Speci
fi
c
CO
2
emissions, g kWh
–1 800
700
600
500
400
300
200
Diesel Natural gas Natural gas Natural gas
lean stoichiometric stoichiometric
with EGR
Displacement ≈ 7 l, 1200 rpm Full load
30% load
Fig. 3. CO2 emission dependence on technologies in HDD CNG engines (11). EGR = exhaust gas recirculation (Reproduced with kind permission from Eunseok Kim,
group metal (pgm) loadings of >200 g ft–3 are needed for high levels of methane conversion to meet end of life THC regulations due to the very low reactivity of
Conversion, %
Ethene Propene Butane Propane Ethane Methane 100
90 80 70 60 50 40 30 20 10 0
0 100 200 300 400 500 600 Temperature, ºC
Increasing alkane chain length
Fig. 4. Hydrocarbon species conversion of Pd based Heesung Catalysts, South Korea) catalyst as a function of temperature under lean conditions
(a) (b)
110 110
ciency
, % 100
90
CO, %
ciency
, %
100 90
80 HC, %
NOx, % 80
Conversion ef
fi
Conversion ef
fi
70 60 50 40
0.97 0.98 0.99 1.00 1.01 1.02 1.03 0.97 0.98 0.99 1.00 1.01 1.02 1.03
Lambda Lambda
Fig. 5. Comparison of the performance of an aged Pd:Rh (120/0:11:1) TWC as a function of lambda at 450ºC on: (a) a gasoline engine; (b) a stoichiometric CNG engine
this hydrocarbon and catalyst deactivation via thermal and chemical effects. Figure 5 shows the performance of a typical Pd-Rh TWC as a function of engine lambda on a standard gasoline engine compared to a stoichiometric CNG engine (a gasoline engine fuelled by CNG). Stoichiometric operation is chosen for CNG because it is easier to reduce both methane and NOx emissions under stoichiometric conditions than under lean conditions. It is evident that in the gasoline engine going from rich to lean operation, carbon monoxide combustion improves and reaches 100% above λ = 0.995 and remains the same during lean operation. 100% HC conversion is seen on rich operation, but starts dropping slightly when going lean; NOx shows a dramatic drop with increase in λ value. On the stoichiometric CNG engine, the CO and NOx conversion follow a similar trend to the gasoline engine, but HC conversion is much lower especially lean of stoichiometry. Use of high pgm loadings will improve the overall HC conversion in stoichiometric CNG engines. However, high methane conversions can be achieved with relatively low pgm based on engine calibration, i.e. controlling air to fuel ratio so as to operate near stoichiometric or rich of stoichiometric; the pgm loading can also be varied corresponding to the regional legislation requirement with regards to methane and non-methane conversions.
Figure 6 shows the difference in light-off combustion temperatures of a series of catalysts used in both gasoline and stoichiometric CNG applications. The need for high pgm loadings for CNG applications in order to attain similar light off combustion temperatures as for gasoline applications is clearly evident. The explanation lies in the fact that hydrocarbon emissions from natural gas vehicles consist mostly of methane which is much more difficult to oxidise than the alkenes,
100
aromatics and longer chain alkanes which are present in gasoline engine exhausts.
One of the advantages of using lean burn engines is high fuel economy. However, unlike with stoichiometric engines, a reductant needs to be injected into the exhaust stream in order to be able to reduce NOx in the presence of excess oxygen. This is normally in the form of ammonia (NH3), and thus lean burn applications require a completely different catalyst system to those that are stoichiometric, where effi cient NOx reduction can be achieved with the use of CO or HC at slightly rich or stoichiometric conditions. Other technical problems with lean burn engines include the possibility of misfiring at high air-to-fuel ratios resulting in higher emissions. The reduction of NOx and oxidation of methane is also more difficult under very oxidising conditions. For lean burn CNG applications, Pd-Pt at high total pgm loadings (>200 g ft–3) are needed for methane combustion at lower temperatures.
Due to the unreactive (or poorly reactive) nature of methane at lower temperatures, increased methane emissions result during cold start and idle situations, mainly for lean burn where the exhaust temperatures are lower than stoichiometric. In order to improve the reactivity of methane at lower temperatures, one of the options is to use high pgm loadings. Figure 7 shows the signifi cant benefit in methane conversion with increase in pgm loading from 100 to 200 g ft–3 of Pd, however the benefit diminishes above 200 g ft–3.
Other Challenges
CNG catalysts, especially Pd-based catalysts, suffer from poisoning by water (5–12%) and sulfur (<0.5 ppm SO2 in lube oil) especially under lean conditions, which results in drastic reduction of conversion rate of the catalyst over time. The
T50%
, CH
4
CNG 10 g TWC
480 TWC 10g
440
420
Conversion ef
fi
ciency
, % 80 CNG 80 g
TWC 80 g CNG 460
CNG 120 g TWC 120 g CNG 230 g TWC 230 g
0
0 100 200 300 400 500 600 400
50 100 150 200 250 300 350 400 450 Temperature, ºC
Pd loading, g ft–3
Fig. 6. Effects of pgm loadings (g ft–3) on HC conversion of
Fig. 7. Effect of Pd loading on lean burn methane Pd:Rh catalyst: gasoline (TWC) vs. CNG
conversion
60
40
deactivation due to water is significant due to the formation of hydroxyl, carbonates, formates and other intermediates on the catalyst surface (20). The activity is reversible, and can be recovered completely if water is removed (Figure 8). However, this is impractical as methane combustion feed always contains a high level of water due to the high content of H in methane. H2O can be either an inhibitor or a promoter depending on the air-to-fuel ratio, i.e. lambda. Under stoichiometric and reducing conditions, lambda 1, H2O can act as a promoter for the oxidation of hydrocarbons through the steam reforming reaction in both CNG and gasoline engines. However for lean burn CNG operating at lambdas >1, H2O acts as an inhibitor for methane oxidation. It is critical to understand the water inhibition effect and design catalysts which are more tolerant to the presence of H2O. This would allow for improvement when trying to control methane emissions from lean burn CNG.
Though the sulfur level is very low in the engine exhaust, Pd-based catalysts deactivate significantly upon sulfur exposure due to the formation of stable sulfates (21, 22). Regeneration of the catalyst in order to restore the activity following sulfur poisoning is challenging and will usually require high temperatures, rich operation or both. This is easily achievable in stoichiometric operation but more difficult in lean burn. A lean burn vehicle operates with a much higher air-to-fuel ratio than a stoichiometric vehicle and will need injection of a much higher concentration of reductant to switch to rich operation. Thermal deactivation resulting from a high level of misfire events due to poor engine transient control and ignition systems destroys the
CH
4
conversion, %
100
80
60
40
20
0
Pd catalyst
0 50 100 150
Time, min
H2O on H2O off H2O on H2O off
Fig. 8. Effect of water on methane conversion of Pd catalyst
catalyst and correspondingly leads to a high level of exhaust emissions. This problem is common to all types of engine, but some catalysts are more resistant to the thermal deactivation. This leads to a high demand for catalyst efficiency and durability.
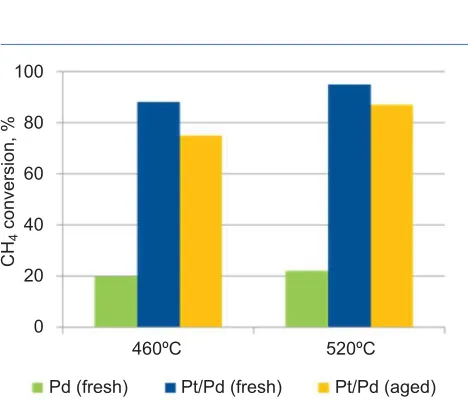
Figure 9 shows the effect of high-temperature thermal ageing and sulfur exposure on the methane conversion of a Pd-based oxidation catalyst. It is evident that the catalyst deactivates under both conditions, but sulfur poisoning has a more dramatic impact than thermal ageing. Both the thermal durability and sulfur poisoning can be improved by the addition of small amounts of Pt to the Pd catalyst (23, 24), as shown in Figures 10
and 11. Figure 11 shows that the sulfur inhibition due
Conversion, %
100 90 80 70 60 50 40 30 20 10 0
100 200 300 400 500
Temperature, ºC Fresh
700ºC 850ºC
1st SO2
2nd SO2
Fig. 9. Effect of thermal ageing and sulfur poisoning on a Pd-based methane oxidation catalyst. ‘1st SO2’ and ‘2nd
SO2’ show successive sulfation
CH
4
conversion, %
100
80
60
40
20
0
460ºC 520ºC
Pd (fresh) Pt/Pd (fresh) Pt/Pd (aged)
Fig. 10. Role of Pt in methane conversion (11) (Reproduced with kind permission from Eunseok Kim, Heesung Catalysts, South Korea)
100
80
60
40
20
0
0 25 50 75 100 125 150 175 Engine running time (approx.), h
Pt:Pd Pd Reference
CH
4
conversion, %
Fig. 11. Impact of Pt addition to reduce the impact of sulfur poisoning on Pd-based oxidation catalysts (25)
200
to formation of palladium sulfates can be reduced significantly on addition of Pt (25).
Abbreviations
CH4 methane
CNG compressed natural gas
CO carbon monoxide
CO2 carbon dioxide
EGR exhaust gas recirculation ETC European Transient Cycle GTL gas-to-liquids
HC hydrocarbons HDD heavy duty diesel LNG liquified natural gas
NMHC non-methane hydrocarbons NOx nitrogen oxides
pgm platinum group metal PM particulate matter THC total hydrocarbons TWC three way catalyst
WHTC World Harmonised Transient Cycle
Conclusions
An increased interest in the use of natural gas as an alternative fuel in mobile and stationary applications is apparent. Some of the main reasons are its relative high abundance, lower cost compared to other fuels and most importantly the urge to meet targets for the reduction of greenhouse gas emissions. Methane emissions and total hydrocarbons (including methane) are capped by regulations globally including the US EPA greenhouse gas legislation and Euro VI, requiring vehicles to use
methane emissions control aftertreatment. The obvious path for natural gas is via methane for stationary and mobile applications, where it can be used in the form of either CNG or LNG. With further improvement in natural gas fuelling infrastructure and an increase in the number of natural gas engines, the rate of uptake of natural gas vehicles can be enhanced to a greater extent. Pd-Rh TWC under stoichiometric conditions, while Pd-Pt catalyst under lean conditions are used to deal with methane combustion. High methane combustion can be achieved at lower temperatures by altering the pgm loading and through engine calibration depending on the regional legislation requirements. However, these might make the technology rather expensive. Further challenges include the issues with catalyst deactivation due to sulfur (from lubricant), water, thermal ageing and methane slip at low temperatures. These need to be addressed quickly so that this technology is readily available to meet the current and upcoming stricter legislation and challenges.
Acknowledgements
The author would like to gratefully acknowledge Lee Gilbert, Andy Walker, Gudmund Smedler, Raj Rajaram, Dave Thompsett and Joseph McCarney, all of Johnson Matthey Plc, for their contributions towards writing the report.
References
1 M. Maedge, ‘Methane as a Vehicle Fuel in Europe’, in: Gaseous Fuels for Road Vehicles, Institution of Mechanical Engineers, London, UK, 11th September, 2014
2 NaturalGas.org: http://naturalgas.org/ (Accessed on 4th July 2016)
3 A. Demirbas, “Methane Gas Hydrate”, Springer-Verlag, London, UK, 2010
4 ‘Communication From the Commission to the European Parliament, the Council, the European Economic and Social Committee and the Committee of the Regions: A Roadmap for Moving to a Competitive Low Carbon Economy in 2050’, Brussels, Belgium, 8th March, 2011
6 E. Bourbon, ‘Clean Cities Alternative Fuel Price Report, October 2015’, Energy Efficiency and Renewable Energy, US Department of Energy, Washington, DC, USA, 10th December, 2015
7 Heavy-Duty Vehicles: GHG Emissions & Fuel Economy, Other Standards and Provisions, Diesel net:
https://www.dieselnet.com/standards/us/fe_hd.php
(Accessed on 5th July 2016)
8 EU Emission Standards for Heavy-Duty Diesel and Gas Engines: Transient Testing, Heavy-Duty Truck and Bus Engines, Diesel net: https://www.
dieselnet.com/standards/eu/hd.php (Accessed on 4th
July 2016)
9 ‘FACT SHEET: Administration Takes Steps Forward on Climate Action Plan by Announcing Actions to Cut Methane Emissions’, The White House, Office of the Press Secretary, Washington, DC, USA, 14th January, 2015
10 E. Jones, ‘EPA Releases First-Ever Standards to Cut Methane Emissions from the Oil and Gas Sector’, US EPA Press Office, Washington, DC, USA, 12th May, 2016
11 E. Kim, H. Han, I. Im and N. Choi, ‘Development of Durable Pd-based Catalyst System for Lean-CNG Application’, in SAE 2014 Light Duty Emissions Control Symposium, Troy, Michigan, USA, 9th–10th December, 2014
12 ‘Few Transportation Fuels Surpass the Energy Densities of Gasoline and Diesel’, US Energy Information Administration, US Department of Energy, Washington, DC, USA, 14th February, 2013
13 E. F. Sousa-Aguiar, F. B. Noronha and A. Faro Jr, Catal. Sci. Technol., 2011, 1, (5), 698
14 S. J. Curran, R. M. Wagner, R. L. Graves, M. Keller
and J. B. Green, Energy, 2014, 75, 194
15 P. van der Gaag, ‘Analysing Challenges of Producing Bio-LNG and Building the Infra for It’, in: Brussels Global Biomethane Congress, Brussels, Belgium, 10th October, 2012
16 D. J. van Kasteren, ‘Upgrading Biogas to Bio LNG’, BioenNW, European Bioenergy Research Institute, Eindhoven, Netherlands, 31st October, 2014
17 H. P. van Kemenade, R. J. van Benthum and J. J. H. Brouwers, Energy Technol., 2014, 2, (11), 874
18 ‘Detailed carbon intensity data year 7 version 7.0’, in “Renewable Transport Fuel Obligation (RTFO) guidance: year 7”, Department for Transport, London, UK, 8th April, 2014
19 T. Rydberg, M. Belhaj, L. Bolin, M. Lindblad, Å. Sjödin and C. Wolf, ‘Market conditions for biogas vehicles’, IVL Report B1947, Swedish Environmental Research Institute, Göteborg, Sweden, 2010
20 D. Ciuparu, E. Perkins and L. Pfefferle, Appl. Catal. A: Gen., 2004, 263, (2), 145
21 P. Gélin and M. Primet, Appl. Catal. B: Environ., 2002,
39, (1), 1
22 M. Honkanen, M. Kärkkäinen, T. Kolli, O. Heikkinen, V. Viitanen, L. Zeng, H. Jiang, K. Kallinen, M. Huuhtanen, R. L. Keiski, J. Lahtinen, E. Olsson and M. Vippola, Appl. Catal. B: Environ., 2016, 182, 439
23 K. Narui, H. Yata, K. Furuta, A. Nishida, Y. Kohtoku and T. Matsuzaki, Appl. Catal. A: Gen., 1999, 179, (1–2), 165
24 A. Ersson, H. Kušar, R. Carroni, T. Griffin and S. Järås, Catal. Today, 2003, 83, (1–4), 265
25 G. Corro, C. Cano and J. L. G. Fierro, J. Mol. Catal. A: Chem., 2010, 315, (1), 35
The Author