An investigation into the
role of pregnancy in the
development of stress
incontinence of urine.
Thesis submitted to The University of
London for the Degree of Doctor of
Medicine
Victoria Ann Mills Cook M.R.C.O.G
ProQuest Number: U 642685
All rights reserved
INFORMATION TO ALL USERS
The quality of this reproduction is dependent upon the quality of the copy submitted.
In the unlikely event that the author did not send a complete manuscript and there are missing pages, these will be noted. Also, if material had to be removed,
a note will indicate the deletion.
uest.
ProQuest U642685
Published by ProQuest LLC(2015). Copyright of the Dissertation is held by the Author.
All rights reserved.
This work is protected against unauthorized copying under Title 17, United States Code. Microform Edition © ProQuest LLC.
ProQuest LLC
789 East Eisenhower Parkway P.O. Box 1346
Abstract
An investigation into the role of pregnancy in the
development of stress incontinence of urine.
Methods :
For the prospective observational study, 250 women were recruited from
the antenatal clinics o f University College London Hospital and The
W hittington Hospital at their booking appointment. All women were less
than 20 weeks pregnant at booking. The patients were interviewed with a
standard questionnaire at booking, 28 weeks, 34 - 36 weeks o f pregnancy
and at 6 and 12 weeks postpartum. At the first interview patients were
asked about incontinence prior to the pregnancy. The patients then
completed a frequency volume voiding chart for each visit except the first.
They were asked to attend the clinic with a full bladder and performed a
standing stress test at the 28 and 34 - 36 week visit. The delivery details
were collected at the first postpartum interview.
For the retrospective study 300 primiparous patients who had delivered at
The Whittington hospital were sent a questionnaire three months after
delivery.
Results :
181 women completed the prospective study. The reported frequency o f
micturition increased during pregnancy and declined after delivery. The
frequency o f micturition recorded on the charts showed a similar pattern.
The total volume voided per day increased during pregnancy and declined
after delivery whereas the mean volume voided at each micturition
in the mean volume voided in the women who reported incontinence
compared to those women who were dry.
The numbers o f women reporting incontinence increased in pregnancy to
44.8% at 28 weeks and then declined after delivery to 12.2% at 12 weeks
postpartum.
58.1% o f the retrospective questionnaires were returned. 32.9% had some
form o f incontinence at the time o f completing the questionnaire whereas
Table of Contents
Ab s t r a c t...2
De c l a r a t i o n... 8
Ac k n o w l e d g e m e n t s... 9
Pr e s e n t a t i o n s... 10
De f i n i t i o n s...11
CHAPTER 1 - INTRODUCTION... 13
1.1 Th eu s eo fo r d in a ls c a l e st od e s c r ib eq u a n t it a t iv ed a t a... 14
1.2 Th eu s eo fl o n g it u d in a ls t a t e m e n t sf o rc r o s ss e c t io n a ld a t a... 15
1.3 Co r r e l a t io n, c a u s a t io n a n dc o in c i d e n c e... 15
1.4 Da t ad r e d g i n g... 15
CHAPTER 2 - REVIEW OF THE LITERATURE...16
2.1 Th el o w e ru r in a r yt r a c t; s t r u c t u r ea n df u n c t io n... 17
2 .2 Ur in a r y In c o n t i n e n c e... 20
2.2.1 Catises...20
2.2.2 Prevalence o f incontinence...22
2.2.3 Impact o f incontinence...25
2.2.4 Management o f incontinence by general practitioners...26
2.3 Th e Lo w e r Ur in a r y Tr a c t In Pr e g n a n c y...28
2.3.1 Frequency o f micturition and nocturia...28
2.3.2 Incontinence...31
2.3.3 Incontinence postpartum...34
2.3.4 Incontinence during pregnancy...38
2.3.5 Detrusor instability and pregnancy...41
2.3.6 Prospective studies o f stress incontinence during pregnancy and after delivery...43
2 .4 Pa t h o p h y s io l o g yo fi n c o n t in e n c einr e l a t io nt op r e g n a n c ya n dc h i l d b i r t h... 48
2.4.1 Neurological sphincter damage...48
2.4.2 Primary muscle damage to the urethral sphincter...53
2.4.3 Hormonal effects...55
2.4.4 Vascular pulsations...56
2.4.5 Total and functional urethral length...57
2.4.6 Loss o f urethral support...58
2.5 Fa e c a l In c o n t i n e n c e...60
2.5.1 The anal sphincters and maintenance o f continence...61
2.5.2 Faecal incontinence and childbirth...62
2.5.3 Constipation and childbirth...63
2.5.4 Relevance o f bowel symptoms to project...63
CHAPTER 3 - METHODS OF INVESTIGATION... 65
3.1.1 Symptom questionnaires...66
3.1.2 Frequency volume voiding charts...68
3.1.3 Pad test...69
3.1.4 Cough stress test...69
3.1.5 Urodynamics...71
3 .2 Me t h o d s...74
3.2.1 The prospective Study...74
3.2.2 The Retrospective Study...75
3.3 Th en u l lh y p o t h e s i s... 77
3 .4 St a t i s t i c s... 78
3 .5 Pa t i e n t Qu e s t io n n a ir e sa n d Co n s e n t Fo r m s... 80
3 .6 Va l id a t io no ft h e Qu e s t i o n n a i r e... 87
CHAPTER 4 - RESULTS...95
4.1 Qu e s t io n n a ir e St u d y...96
4.1.1 Questionnaire - Urinary Symptoms...102
4.1.1.1 Frequency o f m icturition and n o ctu ria... 102
4.1.1.2 Incontinence...103
4.1.1.3 Urgency and Urge Incontinence... 105
4.1.1.4 Stress Incontinence... 107
4.1.2 Questionnaire - Bowel Symptoms...110
4.1.2.1 Frequency o f d efaecation ... 110
4.1.2.2 Urgency to defaecate...112
4.1.2.3 Faecal In co n tin en ce...112
4 .2 St a n d i n g St r e s s Te s t...114
4.3 Fr e q u e n c y Vo l u m e Vo id in g Ch a r t... 115
4 .4 Co m p a r is o n b e t w e e nt h eq u e s t io n n a ir ea n df r e q u e n c yv o l u m ev o id in gc h a r td a t a 124 4 .5 Re t r o s p e c t iv eq u e s t io n n a ir ed a t a...125
CH APTERS- DISCUSSION... 134
5.1 Fr e q u e n c ya n d No c t u r i a...137
5 .2 In c o n t i n e n c e...140
5.3 St a n d in g St r e s s Te s t... 144
5 .4 Bo w e l Sy m p t o m s...145
5.5 Th e Re t r o s p e c t iv e Qu e s t i o n n a i r e... 149
5 .6 Cr it ic is m so ft h es t u d y... 153
CHAPTER 6 - CONCLUSIONS... 155
6.1 Fu r t h e r Re s e a r c h... 157
Table of Tables
Ta b l e 1 St u d ie so f Pr e v a l e n c eo f In c o n t i n e n c e...23
Ta b l e 2 St u d ie so f In c o n t in e n c ein Pr e g n a n c y... 32
Ta b l e 3 St u d ie so f In c o n t in e n c e Po s t p a r t u m... 35
T a b l e 4 P r o s p e c t i v e S t u d i e s o f S t r e s s I n c o n t i n e n c e D u r i n g P r e g n a n c y & P o s t p a r t u m ... 43
Ta b l e 5 Pr e v a l e n c eo f De t r u s o r In s t a b il it y Du r in g Pr e g n a n c y & Po s t p a r t u m ( Cu t n e r) ...4 6 Ta b l e 6 Co n t in u a t io nr a t ef o rt h ew h o l es a m p l e...96
Ta b l e 7 Co n t i n u a t i o n Ra t e By Ho s p i t a l... 97
Ta b l e 8 Ra c i a l Di s t r i b u t i o n... 98
Ta b l e 9 Mo d eo f De l i v e r y... 99
Ta b l e 10 St r e s s In c o n t in e n c e - Al l...109
Ta b l e 11 Fr e q u e n c yo f De f a e c a t i o n... i l l Ta b l e 12 Fr e q u e n c y Vo l u m e Vo id in g Ch a r t s Co m p l e t e db y Ge s t a t i o n... 115
Ta b l e 13 Mo d eo fd e l iv e r yf o rr e t r o s p e c t iv eq u e s t i o n n a i r e... 125
Ta b l e 14 Mo d eo fd e l iv e r yr e s p o n d a n t sv sn o n-r e s p o n d a n t s... 126
Ta b l e 15 Su m m a r yo fr e p l ie sf r o mr e t r o s p e c t iv eq u e s t i o n n a i r e... 129
Ta b l e 16 f r e q u e n c y o fm ic t u r it io nint h et h r e eg r o u p s...132
Table of Figures
Fi g u r e 1 Q -Q Pl o to f Fd^tclosl... 88
Fi g u r e 2 Pour cLosu inw o m e nw it ha n dw it h o u tg e n u in es t r e s si n c o n t i n e n c e...90
Fig u r e 3 Pdut.closuinw o m e nw it ha n dw it h o u ts y m p t o m so fs t r e s si n c o n t i n e n c e (o nc o u g h in go r .SNEEZING)... 9 0 Fig u r e 4 Pd^t.closuinw o m e nw it ha n dw it h o u ts y m p t o m so fu r g ei n c o n t i n e n c e... 91
Fig u r e 5 Po^T cmsu inw o m e nw it hs y m p t o m so fu r g e n c y...91
Fig u r e 6 Ra c i a l Dis t r i b u t i o n... 98
Fig u r e 7 Mo d eo f De l i v e r y... 100
Fig u r e 8 Da y t i m e Mic t u r it io n Fr e q u e n c yb y Vis it (f r o mq u e s t io n n a ir e) ... 102
Fig u r e 9 No c t u r ia Fr e q u e n c y b y Vis it (f r o mq u e s t io n n a ir e) ... 103
Fig u r e 10 In c o n t i n e n c e Du r in g Th e Da y...104
Fig u r e 11 Co m p a r is o no f In c o n t in e n c ein Pa t ie n t s Co m p l e t in gt h e St u d ya n d Th o s e Dr o p p in g Ou t Ea r l y...105
Fig u r e 12 Ur g e n c y... 106
Fig u r e 13 Ur g e In c o n t i n e n c e... 106
Fig u r e 14 St r e s s In c o n t in e n c e - Co u g ho r Sn e e z e...107
Fig u r e 15 St r e s s In c o n t in e n c e - Wa l k in go r St a n d i n g...108
F i g u r e 16 I n c o n t i n e n c e - No F e e l i n g ... 110
Fig u r e 17 Fr e q u e n c y o f De f a e c a t i o n... 111
Fig u r e 18 Ur g e n c yt o De f a e c a t e... 112
Fig u r e 19 Fa e c a l In c o n t i n e n c e...113
Fig u r e 2 0 Mic t u r it io n Fr e q u e n c y (7 d a yd a t a) b y Vis it (f r o mf r e q u e n c yv o l u m ec h a r t s) .... 116
Fig u r e 21 Mic t u r it io n Fr e q u e n c y - Co m p a r in gv o l u m em e a s u r e dd a y sa g a in s tu n m e a s u r e d DAYS... 118
Fi g u r e 2 2 To t a l Da il y Vo id e d Vo l u m eb y Vis i t...119
Fi g u r e 23 Me a n Vo id e d Vo l u m eb y Vis it (2 d a ym e a s u r e dd a t a) ...120
Fi g u r e 24 Da il y Mic t u r it io n Fr e q u e n c yb y Vis it (f r o mf r e q u e n c yv o l u m ed a t a) - Co m p a r in g WET AND DRY WOMEN AT THAT VISIT (DETERMINED FROM QUESTIONNAIRE)...122
Fi g u r e 2 5 Me a n Vo i d in g Vo l u m eb y Vi s it (f r o mf r e q u e n c yv o l u m ed a t a) - Co m p a r i n gw e ta n d DRY WOMEN AT THAT VISIT (DETERMINED FROM QUESTIONNAIRE)... 123
Fig u r e 2 6 Fr e q u e n c yo f Mic t u r it io nint h ew h o l eg r o u p... 127
Fi g u r e 2 7 No c t u r i aint h ew h o l eg r o u p...128
Fi g u r e 28 f r e q u e n c yo fm ic t u r it io nint h et h r e eg r o u p s...131
Declaration
The work contained in this thesis was carried out at The Obstetric Hospital
o f University College London Hospitals Trust and The Whittington
Hospital between August 1997 and August 1999.
All o f the work is my own. None o f the data forms part o f any other thesis.
The study was approved by the Joint UCL/UCLH Committees on the
Ethics o f Human Research, Camden and Islington Community Health
Services NHS Trust Research Ethics Committee and The W hittington
Hospital Ethics Committee. All patients gave informed consent prior to
their involvement in the study.
Acknowledgements
I would like to thank John Osborne for his help and encouragement
throughout my tim e as his clinical research fellow. It was a pleasure
working with him.
I would also like to thank James Malone-Lee for his help in planning,
performing and writing up this work. Without his inspiration, guidance and
above all his enthusiasm this thesis would not have been written.
I would like to thank Clive Spence-Jones for his support and help on The
W hittington Hospital site.
Last but not least I would like to thank my husband Michael Gadsdon who
has provided encouragement, child care and computer support throughout
Presentations
The work from this thesis has been presented to the following learned
societies:
An investigation into the role o f pregnancy in the damage to the urethral
sphincter mechanism that leads to stress incontinence o f urine.
Presented to The London Urodynamic Club, January 1998
Pregnancy and not delivery associated with postpartum incontinence in
primigravid women
Presented to The International Continence Society, Denver, August 1999
Also presented to The London Urodynamic Club, January 2000
Lower urinary tract symptoms in pregnancy and after delivery
Presented to The International Continence Society (UK), M anchester April
2001
Lower urinary tract symptoms in pregnancy and after delivery
Definitions
The following definitions apply throughout this thesis and, where
appropriate comply with the ‘Standardisation o f terminology o f lower
urinary tract function’ recommended by The International Continence
Society ^
In co n tin en ce is ‘a condition o f involuntary urine loss that is a social or
hygienic problem and is objectively demonstrable.’
Stress incontinence indicates the patients statement o f involuntary loss o f
urine during physical exertion.
G enuine stress incontinence is the involuntary loss o f urine when
intravesical pressure exceeds the maximum urethral closure pressure in the
absence o f detrusor activity. It is a diagnosis made by urodynamics, it is
characterised by the symptom o f stress incontinence and is caused by a
failure o f one or more components o f the urethral sphincter mechanism.
U rgency is a strong desire to void.
U rg e incontinence is the involuntary loss o f urine associated with a strong
desire to void.
D e tru so r instability is a detrusor that is shown objectively to contract,
spontaneously or on provocation, during the filling phase o f cystometry
w hilst the patient is attempting to inhibit micturition. These contractions
m ay or may not result in leakage o f urine. Detrusor instability is
characterised by symptoms o f frequency, urgency, urge incontinence and
Frequency is the number o f voids during waking hours. Often an arbitrary
value is assigned to denote abnormal frequency, for example voiding
greater than seven tim es per day.
Nocturia is the num ber o f times the patient has to wake from sleep to void.
Nocturnal enuresis is the involuntary passage o f urine during sleep.
The overactive bladder is characterised by symptoms o f frequency and
Urinary incontinence is common and its prevalence increases with age and
parity. The development o f stress incontinence is often assumed to be due
to vaginal delivery, particularly operative vaginal delivery. Some women
and obstetricians are now beginning to discuss the option o f elective
caesarean section in order to prevent the development o f urinary
incontinence. However before this becomes widespread practice it is vitally
important to establish whether or not there is a link between mode o f
delivery and the development o f urinary stress incontinence. It is with this
in mind that we have performed the following studies.
I would like to start by reviewing the literature in order to then illustrate the
reasons as to why we performed the study and the methods that we have
used.
In order to simplify some o f the criticisms o f previous studies I will first
discuss some errors which are commonly made in published research.
1.1 The use of ordinal scales to describe
quantitative data
Commonly arbitrary ordinal scales are applied to continuous variables
which is inappropriate. For example in the description o f frequency of
micturition a figure is chosen, above which the frequency o f micturition is
abnormal, the data set is then described as normal or abnormal, rather than
using statistical methods appropriate for the description o f such quantitative
1.2 The use of longitudinal statements for cross
sectional data
The data obtained from longitudinal studies is different from that obtained
from cross sectional studies and so appropriate statistical tests and
statements should be made in each case.
1.3 Correlation, causation and coincidence
It is important to remember the differences between correlation and
causation. Correlation means that variables are associated whereas
causation means that one variable has caused the other. It should always be
remembered that findings may be due to coincidence. In order to avoid
error it is vital to start with an appropriate null hypothesis and then use
appropriate methods to prove or disprove the null hypothesis. If the results
are then found to be significant then they are unlikely to be due to
coincidence
1.4 Data dredging
It is unfortunate that much research employs this technique. Data is
collected, often retrospectively, and is then examined for any correlations.
I f a correlation is found it is then often interpreted as a causation. This
method o f research should only be used in the preliminary stages o f a
study, so that the results are then used to design an experiment to prove or
2.1 The lower urinary tract; structure and
function
The bladder is a muscular reservoir designed for the storage o f urine. It
comprises three layers. The outer serous layer, the peritoneum, is only
present over the fundus. The muscular layer, the detrusor muscle, is made
up o f three layers o f smooth muscle, contraction o f this muscle results in
reduction in the dimensions o f the bladder in all directions simultaneously.
The inner layer is made up o f transitional cell epithelium. The trigone is the
triangular area o f the bladder between the two ureteric orifices and the
urethral orifice, it’s embryological origin is different and so the detrusor
muscle in the trigone comprises only two layers.^’
The female urethra is around 4cm long, it lies between the internal meatus
in the bladder and the external meatus in the vestibule o f the vagina. The
lining o f the upper urethra is made up o f transitional cell epithelium, this
gradually changes to non-keratinizing stratified squamous epithelium as it
approaches the external urethral meatus. The submucosa contains a
vascular plexus which is thought to assist in forming a water-tight closure
o f the mucosa. The muscular elements o f the urethra are rather complex.
There is smooth muscle at the level o f the bladder neck known as the
internal sphincter, this is made up o f a ring o f smooth muscle and elastin,
known as the trigonal ring, and a loop o f detrusor muscle, known as the
detrusor loop. The function o f these muscles is not fully understood, it is
thought that they may facilitate opening and closure o f the bladder neck. A
circular ring o f striated muscle, the rhabdosphincter, runs from 20 to 80%
o f the length o f urethra, it is thickest anteriorly, thins laterally and is
virtually absent posteriorly. This muscle contains slow twitch fibres and is
Continence has been thought to be maintained by a combination o f factors.
In addition to the rhabdosphincter and the vascular plexus already
mentioned, the fibres o f the levator ani muscle form a ring around the
urethra ju st below the level o f the rhabdosphincter. These are mostly made
up o f fast twitch fibres and so can contract very efficiently but for short
periods o f time, thereby helping to maintain continence at times o f
increased abdominal pressure. The final factor in the maintenance o f
continence is the support o f the bladder neck and upper urethra maintaining
these structures within the abdominal cavity. Any increase in abdominal
pressure is therefor transmitted equally to the bladder and to the upper
urethra, the urethral pressure is maintained higher than bladder pressure
and so continence results.^’ ^
This concept has been challenged by DeLancey.^'^ He realised that the
traditional view did not explain the clinical situations in which some
women with significant anterior wall prolapse, and hence prolapse o f the
bladder neck outside o f the abdominal cavity, remained continent whereas
other women with a bladder neck supported within the abdominal cavity
suffered from incontinence.
DeLancey’s theory is dependant on the urethral support mechanisms which
comprise the arcus tendineus fasciae pelvis, the levator ani muscles and the
endopelvic fascia around the urethra and vagina. The arcus tendineus fascia
pelvis, otherwise known as the white line, is a fibrous band which lies on
either side o f the pelvis, extending from the pubic bone anteriorly to the
ischial spine posteriorly. The urethra and the anterior vaginal wall are
intimately connected by the endopelvic connective tissue. The endopelvic
connective tissue between the proximal urethra and vagina is adherent to
the white line. Connective tissue around the vagina interpenetrates the
fibres o f levator ani. The connections between urethra, vagina, levator ani
urethra and bladder neck. The levator ani muscle is contains slow twitch
fibres which maintain a constant tone maintaining the high position o f the
bladder neck at rest.
Increases in abdominal pressure, for example with a cough, will compress
the proximal urethra against the anterior vaginal wall and endopelvic fascia
as long as they remain attached to the levator ani and the white line. Thus
provided these connections remain intact the mechanism will continue to
function even if the anterior vaginal wall prolapses outside o f the
abdominal cavity.
Anterior to the bladder neck there is a thickening o f the endopelvic
connective tissue which contains smooth muscle, the pubovesical ligament.
The pubovesical ligament is attached to the white line and is thought to
contract at the time o f voiding, pulling anteriorly on the bladder neck and
facilitating it’s opening.
Continence is said to be maintained by several mechanisms, the urethral
rhabdosphincter, the urethral support mechanism and the vascular plexus
causing a water-tight seal o f the epithelial lining. When incontinence
occurs it can be because any one, or all o f these mechanisms has failed. In
many cases, for instance after childbirth, it is probable that one or more o f
these factors has failed but continence is maintained by compensation o f
2.2 Urinary Incontinence
The International Continence Society has defined incontinence as ‘a
condition o f involuntary urine loss that is a social or hygienic problem and
is objectively demonstrable.’
2.2.1
Causes
Continence is maintained by a combination o f factors, as discussed above.
The bladder is a low pressure reservoir for the storage o f urine, the
complex urethral sphincter mechanism maintains a high pressure in the
urethra and so prevents leakage o f urine. In order for incontinence to occur
there has to be a disturbance o f neurological or psychological control, a
disturbance o f muscle function or structural abnormalities. ^
The major causes o f incontinence are
• Genuine stress incontinence
• Detrusor instability
• Overflow incontinence
• Fistulae (vesicovaginal, ureterovaginal, urethrovaginal)
• Congenital (e.g. epispadias, ectopic ureter)
• Urethral diverticulum
• Temporary (e.g. Urinary tract infection, faecal impaction, drugs)
• Functional (e.g. immobility)
W hen considering incontinence in pregnancy not all the above causes are
with an impacted retroverted uterus at about sixteen weeks o f pregnancy
As a result overflow incontinence is not a common problem in pregnancy.
In developed countries the most common cause o f fistulae is
gynaecological surgery such as abdominal hysterectomy and so fistulae
are not a cause o f incontinence in pregnancy in this country. Congenital
causes o f incontinence and urethral diverticulum are both rare and so do
not significantly contribute to incontinence in pregnancy Temporary
causes by their very nature do not cause ongoing incontinence through
pregnancy. Functional problems leading to incontinence will be confined to
groups such as the elderly, the handicapped and those with psychiatric
problems and so again will not be a major cause o f incontinence in
pregnancy in the general population. As a result only genuine stress
incontinence and detrusor instability will be considered further.
Genuine stress incontinence is defined by The International Continence
Society as the involuntary loss o f urine when intravesical pressure exceeds
the maximum urethral closure pressure in the absence o f detrusor activity.^
It is a diagnosis made by urodynamics, it is characterised by the symptom
o f stress incontinence and is caused by a failure o f one or more components
o f the urethral sphincter mechanism.
Detrusor instability is defined by The International Continence Society as a
detrusor that is shown objectively to contract, spontaneously or on
provocation, during the filling phase o f cystometry whilst the patient is
attempting to inhibit m icturition\ These contractions may or may not result
in leakage o f urine. Detrusor instability is characterised by symptoms o f
frequency, urgency, urge incontinence and nocturia. The pathophysiology
o f detrusor instability is poorly understood and so m ost cases are classified
as idiopathic detrusor instability.
2.2.2
Prevalence o f incontinence
There have been a number o f large studies examining the prevalence o f
incontinence in the community. These have been conducted either as postal
questionnaire studies or as interviews (on the telephone or face to face).
These have demonstrated that incontinence is common, 14% to 60% o f
women admitted to some form o f incontinence. The advantage o f these
studies is that it is easy to obtain data from large numbers o f women,
how ever there are several disadvantages. It is difficult to ensure a random
population as those women who suffer incontinence are more likely to
participate in the study than those without symptoms. The range o f
prevalence in these studies is very wide (14% - 60%) and this highlights
another o f the problems o f questionnaire studies. Many different
questionnaires have been developed and used in these studies with no
validation as to the accuracy o f their results. In order to assess the
reliability o f a questionnaire the data that it produces should be compared
to some objective data, such as urodynamics in the case o f incontinence, in
order to validate the questionnaire prior to its use in a study.
The results o f the major studies into prevalence o f incontinence will be
presented in a table form and then will be considered individually. It can be
seen from this table that it is difficult to directly compare data from these
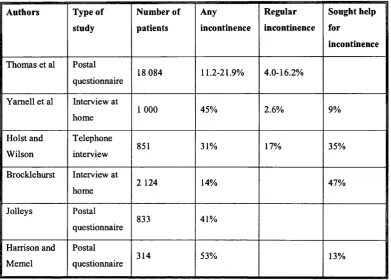
Table 1 Studies o f Prevalence of Incontinence
Authors Type of
study Number of patients Any incontinence Regular incontinence Sought help for incontinence
Thomas et al Postal
questionnaire 18 084 11.2-21.9% 4.0-16.2%
Yamell et al Interview at
home 1 000 45% 2.6% 9%
Holst and Wilson
Telephone
interview 851 31% 17% 35%
Brocklehurst Interview at
home 2 124 14% 47%
Jolleys Postal
questionnaire 833 41%
Harrison and Memel
Postal
questionnaire 314 53%
In the study by Thomas et al incontinence in women increased with age
and with parity. 4% o f 15- 24 year olds reported regular incontinence
whereas 11.8% o f 45-54 year olds and 16.0% o f 75-84 year olds
complained o f regular incontinence. The numbers were greater but the
trend the same for those women complaining o f occasional incontinence.
Incontinence was reported less commonly by nulliparous than multiparous
women at all ages.
O f the women interviewed by Yamell et al 45% o f the women admitted
to some degree o f incontinence, stress incontinence was reported by 22%
and urge incontinence by 10% o f women and 14% complained o f mixed
symptoms. 3% o f the women reported that the incontinence interfered with
their social or domestic life yet only h alf o f these women had sought
Holst and Wilson interviewed 851 women, 31% o f the women had some
degree o f incontinence and 17% had regular incontinence Only one third
o f the women with incontinence had sought medical help, reasons for not
seeking help were that incontinence was not perceived as abnormal (81%)
or low expectation o f benefit from treatment (10%). The more socially
debilitating the incontinence the more likely it was that the women would
seek help.
Brocklehurst analysed a MORI poll o f 4007 randomly selected adults, 2124
o f the sample were women O f the women questioned 14% admitted to
some incontinence and as has been seen in previous studies the prevalence
o f incontinence increased with age. 80% o f those with incontinence had
consulted their general practitioner at some time.
Jolleys found that the prevalence o f incontinence increased to age 54 and
then decreased, 31% o f women age less than 25, 60% o f 45-54 year olds
and 20% o f 75-84 year old women complained o f incontinence. Rates o f
incontinence were higher in multiparous than nulliparous women,
incontinence was not related to type o f delivery
Harrison and Memel found that the overall prevalence o f incontinence
was 53%, 46% o f these women complained o f stress incontinence, 8%
complained o f urge incontinence and 43% had mixed incontinence. Once
again the prevalence increased with increasing parity and there was no
relation between incontinence and mode o f delivery. Those women who
reported incontinence on the first questionnaire were sent a second
questionnaire, only 46.7% were returned. O f these women 34.6% admitted
to worrying about their incontinence but only 26.9% o f these had spoken
to their general practitioner. Reasons given for not consulting the doctor
nothing could be done, incontinence is a usual w om en’s complaint and
embarrassment.
2.2.3
Impact o f incontinence
It is difficult to measure the impact o f incontinence on quality o f life as it is
a very subjective issue. Different authors have tackled the problem in a
variety o f ways. Any questionnaire study will have the same problems as
those which have already been discussed, in particular all questionnaires
used should be properly validated. It is also important to consider the group
that is being questioned, many o f the studies have questioned women who
either are attending for investigation o f their incontinence or those who
have been investigated and are undergoing treatment. From the data which
has already been examined many incontinent women do not present for
help and so how representative are the groups that are being studied? Some
authors have questioned women about how their incontinence has affected
their lives but without any validation o f the questionnaires. Quality o f life
questionnaires are an excellent method o f assessing the impact o f
incontinence on a patient’s life as they take into account the consequences
o f the incontinence from the patients point o f view. There are a number o f
quality o f life questionnaires that have been fully validated for use in
relation to incontinence
Norton et al questioned 201 women, attending for initial assessment at an
urodynamic clinic, about their urinary symptoms. Two thirds o f the women
described urinary incontinence as their worst symptom, o f these women
57% complained o f stress incontinence and 43% o f urge incontinence. Two
fifths o f the women consulted a doctor within a year o f noticing
incontinence, a third delayed for up to five years and a quarter delayed for
more than five years. Reasons given for delay were that they hoped
normal and fear o f surgery. When questioned about the effect o f
incontinence on their daily lives 60% avoided going away from home and
58% felt their work was affected, significantly more than the women who
were continent. W hen questioned about stigma attached to their
incontinence 47% felt less attractive as a result o f their symptoms, again
significantly more than in the continent group.
Clark and Romm sent questionnaires to 90 patients who had been seen in
their urodynamic clinic to ask about the effect o f urinary incontinence on
sexual activity in women. Unfortunately only 48 (53%) o f the
questionnaires were returned, 22 women had stress incontinence, 15 had
detrusor instability and 7 had mixed incontinence. Clinically significant
incontinence occurred in all diagnostic groups. Only 3 o f 16 women
reported decreased frequency o f sexual intercourse however the patients
did complain o f decreased spontaneity as a result o f concerns about odour
and the need to dispose o f wet pads. The numbers in this study were rather
small due to the poor response rate.
Kobelt et al have reviewed the use o f several quality o f life questionnaires
in patients with the overactive bladder (SF36, EuroQol, the Incontinence
QoL Index and the K ing’s Healthcare Questionnaire) They found that
those patients with the symptoms o f frequency and incontinence had lower
scores compared to the normal population. The scores improved with
treatment indicating that quality o f life improves as symptoms resolve.
2.2.4
Management of incontinence by general
practitioners
Even when women do present to their general practitioner complaining o f
urinary incontinence they may not be managed appropriately. Briggs and
about referral to the continence advisory service They found that o f 101
practitioners, 42 had never used the continence advisory service for their
patients over 65 years o f age. The continence advisory service, led by a
trained nurse continence advisor had been operating in that area for several
years and was accessible to general practitioner referrals.
In the study by Brocklehurst that has already been discussed the women
were asked about the actions o f their general practitioners when they
consulted them. On the whole the actions were limited to taking a urine
sample, referring to a specialist or prescribing tablets. Only in a minority o f
cases was an abdominal, rectal or vaginal examination performed therefore
suggesting that medication is prescribed without clinical examination and
without a diagnosis being made. Fewer than 5% were referred to a nurse or
continence clinic.
Grealish and O ’Dowd studied general practitioners awareness o f urinary
incontinence in women and their attitude to management o f the
incontinence They interviewed 11 male and 9 female GPs. The GPs
were aware o f the prevalence and under-reporting o f urinary incontinence.
M any o f the doctors were unhappy with their own management o f
incontinence. The male doctors on the whole were reluctant to perform a
vaginal examination. The GPs mentioned teaching o f pelvic floor exercises
and bladder drill but expressed little enthusiasm about their success rate.
M edication was used frequently but was generally considered ineffective or
intolerable. The services o f incontinence nurses were under-utilised as
2.3 The Lower Urinary Tract In Pregnancy.
2.3.1
Frequency o f micturition and nocturia.
Although it has been stated over many years that frequency o f micturition
is very common in pregnancy, there have been few trials that have
examined frequency and nocturia during pregnancy. The ideal method to
study any urinary symptoms during pregnancy would be to collect a cohort
o f women and then follow them prospectively though pregnancy in a
longitudinal study, however this would take many months due to the length
o f human gestation. Many o f the studies that have been conducted have
either been cross-sectional, using different groups o f women at different
gestations, or retrospective questioning women in the postpartum period,
both these methods introduce bias. Another criticism o f these studies is
that there is no standard definition o f frequency or nocturia. The data
obtained in these studies is quantitative data yet instead o f treating it as
such the authors have used ordinal scales by applying arbitrary definitions
o f normal and abnormal frequency or nocturia. Some o f the authors have
compared the values to those o f non-pregnant women which is a superior
method compared to the setting o f arbitrary values however it would be
more appropriate to use quantitative statistics. Finally any study which
includes objective data, such as in the form o f a frequency volume voiding
chart, is better than a purely questionnaire based study.
One o f the first people to study frequency and nocturia prospectively
though pregnancy was Francis She studied 400 healthy pregnant women
(nulliparous and multiparous) through pregnancy and 50 normal non
pregnant women. She found that the non-pregnant women voided up to six
times during the day and only occasionally during the night whereas in the
pregnant group 81% voided seven times or more by day and once or more
gradually worsen though pregnancy. Having asked 100 women to complete
a record o f their total fluid intake and output over a 72 hour period, 40 in
the first trimester, 30 in the second trimester and 30 in the third trimester,
her conclusion was that the frequency was due to polydypsia and polyuria.
The women were selected ‘according to their intelligence and willingness
to co-operate’ which o f course could have introduced bias. Twenty o f the
women recorded their intake and output in all three trimesters so the study
is partially longitudinal and partially cross-sectional, however the
longitudinal data is limited by the small numbers.
Paboosingh and Doig studied nocturia in pregnancy with direct
questioning and frequency volume charts, they defined nocturia as night
time voiding on three nights in a one week period and so introduced error
by incorrectly using ordinal scales for quantitative data. They found that
58% o f women complained o f nocturia in the first trimester, 57% in the
second trimester and 66% in the third trimester, this was a cross sectional
study. The frequency volume charts confirmed the findings o f Francis, that
the urine output was increased.
Stanton et al questioned 181 healthy women prospectively though
pregnancy about various urinary symptoms. They defined frequency as
being seven or more voids during the day and nocturia as voiding more
than once at night, thus introducing error as has already been discussed.
The group consisted o f 83 nulliparous and 98 multiparous women.
Frequency o f micturition was more common in the nulliparous group and
the incidence increased in both groups until term, the incidence had
returned to the pre-booking level at the postpartum visit. The incidence of
nocturia increased in the same way, however diurnal frequency was more
Cutner recruited 165 women at 20 weeks gestation and followed them at 28
and 36 weeks gestation and 7 weeks postnatal, 119 women (71 nulliparous
and 48 multiparous) completed the study The women completed
symptom questionnaires at each visit and a frequency volume chart, 58
women completed all four charts. Frequency o f micturition increased
during pregnancy and declined after delivery but not quite to the pre
pregnancy level. Nocturia also increased during pregnancy but did return to
the pre-pregnancy level by the post natal visit. When the relationship
between the number o f stated voids on direct questioning and the number
on the frequency volume chart was examined it was found that the women
tended to overestimate the number o f voids on direct questioning.
Viktrup et al questioned 305 primiparous women on the third to fifth
postpartum day. Frequency was defined as voiding seven or more times
during the day and nocturia was defined as voiding twice or more during
the night, this again introduces error by treating quantitative data in an
ordinal way. They found that frequency and nocturia increased during
pregnancy and returned to pre-pregnancy levels by three months
postpartum.
Rasmussen et al sent questionnaires to 207 women, up to 18 months
postpartum, and received 180 replies. The aim o f their study was to
examine if obesity was a predictor for postpartum urinary symptoms. They
defined frequency as voiding 10 or more times per day and nocturia as
voiding twice or more at night. They found that before pregnancy none o f
the women suffered from frequency whereas 2.1% o f the normal weight
women and 3.5% o f the obese women suffered from nocturia. During
pregnancy 30.9% o f normal and 31.8% o f obese women complained of
frequency and 34% o f normal and 50.8% o f obese complained o f nocturia.
6 to 18 months postpartum the frequency had decreased to 4% o f normal
and 5.8% o f obese women. The fact that their definition o f frequency is
more stringent than the other studies may explain the lower rates o f
frequency in the women o f normal weight however it would have been
more appropriate to use quantitative statistics.
2.3.2
Incontinence
There have been many retrospective studies which have questioned women
many years after childbirth in order to try to find the link between
pregnancy, childbirth and incontinence. Once again these are all
questionnaire studies with all the disadvantages that have already been
discussed. As these were retrospective studies the data obtained was cross-
sectional and so should be analysed as such. The studies varied in the time
period between pregnancy and the time o f the study, recall bias will worsen
with a longer time interval. The population varied between studies, some
chose a random population whereas others (for example Beck and Hsu)
recruited patients attending a gynaecology clinic which would introduce
bias. The response rates to the questionnaires varied greatly, the
significance o f the results from the studies with low response rates should
be questioned. Finally the definition o f incontinence varied between studies
with some authors including any episode o f incontinence whereas others
include only regular incontinence. None o f the studies used the
International Continence Society definition that has already been
mentioned.
The relevant studies are summarised in the following table and are then
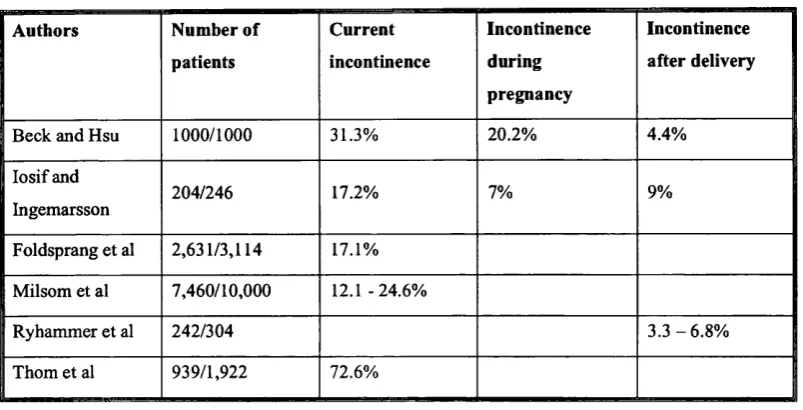
Table 2 Studies of Incontinence in Pregnancy -Number of patients Current incontinence Incontinence during pregnancy Incontinence after delivery
Beck and Hsu 1000/1000 31.3% 20.2% 4.4%
Iosif and
Ingemarsson 204/246
17.2% 7% 9%
Foldsprang et al 2,631/3,114 17.1%
Milsom et al 7,460/10,000 12.1 -24.6%
Ryhammer et al 242/304 3.3-6.8%
Thom et al 939/1,922 72.6%
In 1965 Beck and Hsu questioned 1000 women, who attended their
outpatient clinic, about the presence or absence o f stress incontinence,
pregnancy and menstrual status and about the circumstances surrounding
the onset o f the incontinence/^ They found that 31.3% o f the group
complained o f stress incontinence with 5% o f the group describing the
incontinence as a major problem. 32.9% o f the incontinent group first
developed incontinence whilst pregnant and continued to be incontinent
after delivery, a few o f this group developed perm anent incontinence
following the first delivery but more commonly the incontinence became
gradually worse during successive pregnancies until it became permanent.
14.1% o f the incontinent women first developed stress incontinence after
delivery and all o f this group had permanent symptoms.
Io sif and Ingemarsson sent questionnaires to 246 women who had been
delivered by elective caesarean section up to seven years previously.
77% o f the women returned the questionnaires. 7% o f women had had
stress incontinence during the pregnancy only whereas 9% o f the women
had developed permanent stress incontinence with onset either during the
had been delivered by elective caesarean section due to a narrow pelvis,
they do not state whether or not any o f the women had laboured in any o f
their pregnancies, which could have affected the development o f
incontinence.
In 1992 Foldspang et al sent a questionnaire to 3114 women selected at
random, 85% were returned 17.1% o f the women had experienced some
type o f incontinence during 1987 (the year that they were questioned about)
o f which 14.8% was stress incontinence. 8.6% was urge incontinence and
7.1% was mixed incontinence. The prevalence o f incontinence was found
to be associated with parity. Among the types o f incontinence stress
incontinence consistently showed the strongest association with parity. It
should be remembered that this is cross-sectional data and so the findings
should be confirmed with a longitudinal study.
Another study was published by Milsom et al in 1993. They sent
questionnaires to 10,000 random women and had a 74.6% response rate.^^
They found that there was an association between increasing prevalence o f
incontinence and increasing age. There was a linear association between
prevalence o f incontinence and increasing parity. The greatest increase in
prevalence occurred after the birth o f the first child. Once again the
limitations o f cross-sectional retrospective data should be remembered.
Ryhammer et al sent questionnaires to 304 women who had delivered in
their department without a complete tear o f the anal sphincter.^"^ This group
was selected to act as a control group for another study involving women
with complete tear o f the anal sphincter and so the women selected were
those that had delivered vaginally just before and after those women with
anal sphincter tears. 80% o f the women responded to the questionnaire.
3.3% o f the women became permanently incontinent after their first
Although the selection o f patients was appropriate for a study about anal
sphincter tears, it is not random.
Thom et al published a postal questionnaire study in 1997.^^ They sent out
questionnaires to 1922 randomly selected women, o f age 60 or over, 49%
were returned fully completed. 682 women reported any incontinence over
the previous year, 115 (12.3%) reported daily incontinence and 205
(30.2%) reported weekly incontinence. O f those women who were
incontinent 23.3% complained o f stress incontinence, 32.8% complained o f
urge incontinence and 32.5% complained o f mixed incontinence. Women
with incontinence reported more pregnancies and births. Parturition factors
were examined in the 791 women with at least one live vaginal birth, only
prolonged labour and use o f oxytocin were significantly associated with
incontinence. These final results are limited by the fact that they are a result
o f data dredging and so could be due to coincidence.
2.3.3
Incontinence postpartum
There have been a number o f studies which have questioned women in the
postpartum period. Once again these were retrospective questionnaire
studies with no longitudinal data. Due to the nature o f the data the results
can show correlation but not causation. The time interval between delivery
and questioning varied from study to study as did the definition o f
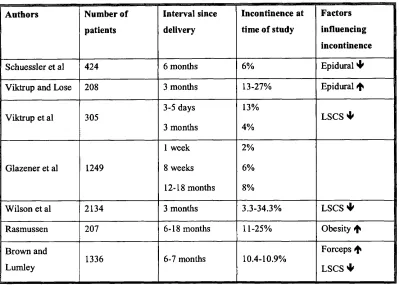
Table 3 Studies of Incontinence Postpartum
Authors Number of
patients
Interval since
delivery
Incontinence at
time of study
Factors I
influencing |
incontinence
Schuessler et al 424 6 months 6% Epidural 4^
Viktrup and Lose 208 3 months 13-27% Epidural *
Viktrup et al 305
3-5 days
3 months
13% 4%
l s c s4^
Glazener et al 1249
1 week
8 weeks
12-18 months
2%
6%
8%
Wilson et al 2134 3 months 3.3-34.3% l s c s4^
Rasmussen 207 6-18 months 11-25% Obesity ^
Brown and Lumley
1336 6-7 months 10.4-10.9%
Forceps *
l s c s4^
In 1988 Schuessler at al questioned 424 primiparous women six months
after delivery/^ They found that none o f the women were incontinent prior
to pregnancy and none o f the women who were delivered by caesarean
section (58) became incontinent however 6% o f those who had a vaginal
delivery were incontinent at six months. They found no significant
connection between incontinence and birth weight, large head
circumference, prolonged second stage o f labour, instrumental vaginal
delivery and maternal age. The women who had had an epidural for
analgesia during labour had a lower incidence o f incontinence. It may be
expected that the women with epidurals would have had a higher incidence
o f complex labours and so a higher rate o f incontinence. The authors
explanation o f the results is that the epidural relaxes the pelvic floor
but there is no evidence for this and the results may be ju st due to
coincidence.
Viktrup and Lose followed up this study with one in which 208
primiparous patients were questioned three months postpartum.^^ The
group selected initially was all the primiparous patients who delivered in a
six month period, however as the aim o f the study was to study the effect o f
epidurals on the incidence o f incontinence, the number o f patients who had
an epidural for analgesia in this original group was too low, so all
primiparous women who delivered having had an epidural for analgesia in
labour in the subsequent 25 months were also included. This method o f
selecting patients could well have introduced errors as the two groups o f
women did not deliver in the same time period. They found that 27% of
women with an epidural developed incontinence de novo after delivery
compared to 13% o f women who delivered without an epidural so the
hypothesis that epidural analgesia relaxes the pelvic floor and so protects
against damage leading to stress incontinence was not supported.
In another study by Viktrup et al 305 primiparous women were
questioned three to five days after delivery. They were questioned about
urinary symptoms prior to and during pregnancy and after delivery. 293
women were followed up at three months postpartum. None o f the women
delivered by caesarean section developed incontinence after delivery
whereas 13% o f those who had had a vaginal delivery were incontinent
immediately postpartum and 4% remained incontinent at three months.
In 1995 Glazener et al^^ published a questionnaire survey o f 1249 postnatal
patients at one and eight weeks postpartum and 12 to 18 months after
delivery. The women were questioned about many aspects o f postnatal
morbidity including incontinence. The women were selected at random, the
How ever the third questionnaire was only sent to h alf the original sample
o f women, those delivering in the second six months o f the study. 2% of
women complained o f incontinence in the immediate postpartum period,
eight weeks after delivery 6% o f women complained o f incontinence and
by 18 months after delivery 8% o f women complained o f incontinence.
Urinary incontinence was the morbidity which was least often treated. The
rising rate o f incontinence as time elapsed after delivery may be explained
by the fact that women with morbidity are more likely to return the
questionnaires therefor introducing error also the women who were sent the
third questionnaire were not the whole sample which might have
introduced error. Another explanation for the increasing rates o f
incontinence over time may be that the women were becoming more active
over time, age may play a part however whether ageing over eighteen
months is a significant factor in the development o f incontinence is not
known. There is no mention o f breastfeeding rates in the study and there
m ay be a connection with breastfeeding and incontinence.
W ilson et al published a postal questionnaire survey in 1996^^ they sent
questionnaires to 2134 women at three months postpartum, 70.5% were
returned. They found that 34.3% o f women complained o f some
incontinence and 3.3% o f women complained o f daily incontinence. Those
women delivered by caesarean section had a significantly lower prevalence
o f incontinence compared to those that had delivered vaginally, however
there was no significant difference between those women delivered by
elective caesarean section and those who had caesarean sections during the
first or second stage o f labour. Those women who had had three or more
caesarean sections had a prevalence o f incontinence similar to those that
had delivered vaginally. As this is retrospective data is shows a correlation
Rasmussen et al studied 207 women six to eighteen months after delivery
in order to investigate the relationship between pre-pregnancy obesity and
urinary symptoms prior to and during pregnancy and postpartum. Prior to
pregnancy 10.6% o f the obese women complained o f stress incontinence
whereas 1% o f the women o f normal weight had stress incontinence.
During pregnancy these values increased to 39% and 23% respectively and
six to eighteen months postpartum 25% o f obese women and 11% o f
normal weight women remained incontinent.
In 1998 Brown and Lumley published a postal survey o f 1336 women who
had delivered six to seven months previously The aim o f the study was to
determine the prevalence o f maternal physical and emotional health
problems after delivery. 10.4% o f primiparae and 10.9% o f multiparae
complained o f urinary incontinence. When the rates o f incontinence were
compared to mode o f delivery the results were as follows: 10.9% after
vaginal birth, 18.2% after forceps or vacuum extraction, 6.8% after
emergency caesarean section and 2.4% after elective caesarean section.
2.3.4
Incontinence during pregnancy
There have been a number o f studies, conducted in the postpartum period,
enquiring into incontinence prior to, during pregnancy and postpartum.
Io sif questioned 1500 women in the immediate postpartum period, 1411
completed the questionnaire, those women who complained o f urinary
incontinence were then referred to an urologist.'^^ Six to twelve months
after delivery all those women who had complained o f incontinence on the
initial questionnaire were sent a further questionnaire, there was a 90%
response rate. A third questionnaire was sent to 300 women selected at
random from those who had not been incontinent from the initial
questionnaire. All three questionnaires were different. 22.7% o f women
replied to the second questionnaire. 8.5% o f these women were incontinent
prior to pregnancy, 72.5% became incontinent during the pregnancy and
19% were incontinent after delivery o f which 11% were still incontinent six
to tw elve months after delivery. O f the 300 women who were sent the third
questionnaire 88% responded, 6% described mild stress incontinence one
to three months after delivery. The data during pregnancy and prior to
pregnancy is all retrospective in this study which introduces recall bias,
also all three questionnaires that were used were different which could add
error.
Viktrup et al studied 305 primiparous women on the third to the fifth
postpartum day, they were then questioned again on the telephone three
months postpartum and those that reported stress incontinence at the
second interview were interviewed again at one year.'*^ The same
questionnaire was used each time. Twelve women were lost to follow-up at
three months and one further women was lost to follow-up at one year. 4%
o f women were incontinent prior to pregnancy, 32% became incontinent
during pregnancy, 19% were incontinent during the puerperium, 6%
rem ained incontinent at three months and 3% were incontinent at one year
postpartum. Among the women that were not incontinent prior to or during
pregnancy, o f the 35 that were delivered by caesarean section none became
incontinent postpartum compared to 13% o f those w ho had a vaginal
delivery, at three months 4% remained incontinent. Once again the problem
with this study is that it relies on retrospective data.
M arshall et al distributed questionnaires to 2062 women two to three days
after delivery, they then mailed a follow-up questionnaire at three months
postpartum to a cluster o f 335 women who had delivered during a random
month, o f these 152 (45%) were returned. Finally a further questionnaire
was sent to a random sample o f 180 women randomly selected from those
questionnaire, 72 (40%) replied."^^ 59% o f women experienced some
leakage o f urine immediately postpartum, the incidence increased with
parity. 31% o f the multiparous women and 11% o f the primiparous women
were incontinent prior to pregnancy. At three months postpartum 63% o f
the women that returned the questionnaire were still leaking. The final
questionnaire revealed that 33% o f the women that replied were still
leaking. The high rates o f incontinence continuing postpartum may well be
due to the low rates o f response to the second and third questionnaire.
Chiarelli and Campbell performed a structured interview on 304 women on
the postnatal ward They questioned the women about incontinence in the
last month o f pregnancy and about any advice they had been given about
bladder control during pregnancy. They found that 64% o f women reported
incontinence during pregnancy. Those women who had had regular bouts
o f coughing during the pregnancy were more likely to report incontinence.
Only 23% o f the women reported having spoken to a healthcare
professional regarding loss o f bladder control. As this study did not
separate the women according to parity and also did not question about
incontinence prior to pregnancy the results are rather meaningless. It is the
long term morbidity associated with incontinence following childbirth that
is important rather than the short term incontinence during pregnancy, this
study did not address incontinence postpartum at all.
In 1998 Marshall et al published a questionnaire study involving 7771
women who were questioned on day two or three p o s t p a r t u m . 1.4% o f
women were incontinent prior to but not during the pregnancy. The women
were divided into groups according to parity: primiparous, multiparous (2-
4) and multiparous (5+). The incidence o f incontinence before pregnancy
increased from 5% in the primiparous group to 21.4% in the multiparous
(2-4) group to 32.2% in the multiparous (5+) group. The onset o f
Once again this study did not address the issue o f postpartum incontinence
presumably because the questionnaire was issued so soon after delivery,
however by missing out on such important data it looses its value.
2.3.5
Detrusor instability and pregnancy
Up to this point the studies discussed have focussed on incontinence o f
urine generally in relation to pregnancy and childbirth. The number o f
studies examining the relationship between pregnancy and genuine stress
incontinence and detrusor instability are very limited. Few authors have
performed urodynamics in pregnancy and so as a result the number o f
studies with proven genuine stress incontinence or detrusor instability are
very small. Some authors have instead asked about symptoms such as
frequency, urgency and urge incontinence in order to estimate the
prevalence o f detrusor instability during pregnancy. In those studies that
have done urodynamic studies in pregnancy there has been poor correlation
between urodynamic findings and symptoms.
In 1991 Cutner et al published a study o f 47 women who underwent
urodynamics prior to termination o f pregnancy 26 o f the women were
nulliparous and 21 were parous. 62% complained o f urgency (28% mild,
15% moderate, 19% severe) 18% complained o f urge incontinence (6%
mild, 6% moderate, 6% severe) and 15% complained o f stress incontinence
(11% mild, 4% moderate). 23% o f the women had phasic detrusor
contractions on cystometry. Detrusor instability appeared to be more
common in women who complained o f urgency and urge incontinence but
these differences were not significant. The urodynamic findings did not
correlate with symptoms. Their conclusions were that although urgency is a
very common symptom in early pregnancy it does not vary with the
urodynamic findings o f detrusor instability. They were unable to explain