LATION ANALYSIS TO EXPLOSIVES
DETEC-TION AND POLYMER CRYSTALLIZADETEC-TION
THESIS BY
Diana Sergeievna Smirnova
In Partial Fulfillment of the Requirements for the
Degree of
Doctor of Philosophy
CALIFORNIA INSTITUTE OF TECHNOLOGY
Pasadena, California
2010
ii
© 2010
Diana Sergeievna Smirnova
iii
ACKNOWLEDGEMENTS
I am very fortunate because I have the pleasure to acknowledge a large number of
people, many of whom I can thank for a variety of different things.
First, I must thank my thesis committee: Prof. Julie Kornfield, Prof. Rick Flagan,
Prof. Dave Tirrell, and Prof. Bob Grubbs, for taking the time to read my thesis and
evalu-ate my work.
As my advisor, Julie’s contribution to my scientific work cannot be overstated.
Through her creativity, generosity, and enthusiasm for science, Julie has had an
enor-mous impact on both my professional and personal growth. In addition to providing
les-sons on melt dynamics, she shared invaluable lesles-sons on writing, presenting, and
net-working. She has inspired creative thinking and risk taking. I no longer fear public
speak-ing because of the many conferences I have attended at her encouragement. She pushed
me to spend three months living in France which was an experience so spectacular that
words are not sufficient to describe it. And she encouraged me to take advantage of the
interview opportunity with ExxonMobil and is the reason I have a place to go from here.
I have had the opportunity to have mentors in others as well. Prof. Flagan’s door
was always open for questions regarding atmospheric chemistry, scientific writing, or
mechanical engineering. Lucia Fernandez Ballester has been instrumental in my getting
to this point. She taught me a great deal when I first started and still does. She was a great
teacher, colleague, and friend. Lucia introducing me to the synchrotron experience
en-iv joyable conversations. The majority of the x-ray data presented in the following pages
was obtained with their invaluable help. There are few people that one can spend a
week’s worth of sleepless, stress-filled nights with and still want to talk to at the end of
the experience; even fewer that could make that week enjoyable. I was very fortunate to
have many beamtimes with Tim and Lucia. I will always remember coke, blue pop,
mu-sica (Radiohead, Muse, Arctic Monkeys just to name a few), TextTwist, Chili’s, Kinder
Bueno and many other memories that still make me smile.
My trip to France allowed me to broaden my perspective both personally and
pro-fessionally. Along with Julie, Wim Bras’s generosity made the trip possible, as well as
my travels to other facilities in Europe. While at DUBBLE, Lucia and Giuseppe Portale
taught me proper x-ray data analysis techniques and Didier Grandjean was very patient in
helping me through many software setbacks during my analysis. Other members of the
DUBBLE staff were very welcoming and greatly contributed to my experience: Sergey
Nikitenko, Guy Luijckx, Dirk Detollenaere, Kristina Kvashnina, Lian Apostol, and
Val-erie Clement.
I have had the pleasure to be part of a number of collaborative efforts. The
poly-ethylene studies have been done with the support of David Lohse’s team at ExxonMobil,
specifically Manika Varma-Nair and Cindy Mitchell. The IED detection project came to
us through Ravi Verma and Andrew Pepino from Tanner Labs. Andrew has spent more
than a few hours sharing his insights on lasers and optics. David Boyd has brought
in-sights on Raman spectroscopy and SERS to the project. Additionally, while at Caltech, I
v Specifically, Manabu Kato, a Japanese visitor, greatly improved our instrument software
during his stay. Additionally, a significant portion of the DSC data and some x-ray data
presented in this thesis is the work of Dr. Soo-Young Park.
There are a number of current and former members of the Kornfield group that I
have come to for scientific answers, advice, or just some stress-relief. Lucia was always
willing to answer my multitude of questions, even when she had no time to spare. Neal
Scruggs either had the answer or knew where to find it, he is a very handy human
thesau-rus, and was a great office mate. Rafael Verduzco, Michael Mackel, and Matthew
Mattson were always willing to share their wisdom and time. I was fortunate to have
Zuleikha Kurji accompany me to one of my beamtimes at Berkeley and assist me in data
collection. In my last year, post-doc Bradley Olsen provided inspiration and great advice.
Other members of the Kornfield group that I got to share my research experience with are
Joyce Huynh, Ryan Turner, Ameri David, Bahar Bignol, Zachary Williams, Yan Xia,
Jeremy Wei, Iman Hajimorad, and Rohan Hule.
Many members of the Caltech staff probably do not always get all the credit they
deserve. Mike Roy and Steve Olsen from the machine shop and Rick Gerhart from the
glass shop are talented and necessary to the success of mine and many other theses. Cory
and Moses always gave me reason to smile in addition to providing the right tools and
accessories. Kathy Bubash is invaluable in ushering students into and out of their time at
Caltech and, along with the other department secretaries, she ensures that the time in
be-tween flows fairly smoothly also. Finally, we might all regress back to the dark ages
vi A unique feature of Caltech is that its small size fosters personal connections with
people. Enough credit cannot be given to Anne Hormann and Marcy Fowler, who
as-sisted with both administrative matters and sanity maintenance. Liz Muira Boyd was a
great help with Raman spectroscopy and inspired recreational goals. John Doyle and
alum Jorge Palamara inspired my triathlon hobby that was a great part of my Caltech
ex-perience.
My Caltech experience has been greatly enriched by the people I met here. I
found a great friend in Mary Louie by spending hours on the roads trying to outrun our
research hiccups. Jeff Hanna and other members of the Caltech tri club encouraged my
crazy antics to blow off steam. Yvonne Chen and Havala Pye were always up for ladies’
night. And I must also thank my friend Emma Gregory who has managed to provide
in-calculable support while going through her own thesis experience on the other side of the
country. My support network is vast and grounded in my family. My parents and sister
have always been there for my smallest and biggest moments, and I owe to them all of
the good things that I have in my life. My father has read almost every word of this thesis
and some of them were incomprehensible before his feedback. Thank you for your time
and great patience. And finally, at the end of the day, whether it was the best day or the
worst day, I had the joy of coming home to a husband whose patience, understanding,
and support have reached levels above and beyond the call of duty—especially in these
vii
ABSTRACT
This thesis presents two novel applications of two-dimensional (2D) correlation
analysis: (1) long standoff detection of explosives using Raman spectroscopy and (2)
ex-amination of morphology development in semicrystalline materials. The power of 2D
cor-relation analysis is its ability to expose and quantify the cor-relationship between changes in
distinct observables characterizing a system as it evolves in response to a perturbation.
Most frequently, the observables are spectroscopic (intensity I(νi) at distinct values of the
spectral variable, νi), so the method is often called “2D correlation spectroscopy.” Diverse
perturbations, such as mechanical stress, change in thermodynamic conditions (e.g.,
tem-perature or pressure), and extent of reaction, have been applied to reveal desired
informa-tion that is obscured in the absence of the perturbainforma-tion. Even small, subtle changes in
re-sponse to the perturbation become readily resolved with 2D correlation analysis, which
ef-fectively excludes static observables and greatly enhances correlated changes relative to
random variations.
Improvised explosive devices (IEDs) are currently the number one killer of both
troops and civilians in Iraq and Afghanistan. Effective detection of explosives at standoff
distances is important to ensure human safety. Implementation of 2D correlation
spectros-copy can increase detection success due to the following advantages of the analysis: (1)
simplification of complex spectra by separation of overlapped peaks, (2) enhancement of
spectral resolution and enhancement of signal to noise ratio (SNR) through the spreading of
peaks over a second dimension, (3) probing specific sequential order of spectral intensity
unsta-viii ble explosives. By taking advantage of the unstable nature of explosive compounds through
the imposition of thermal degradation, it is possible to further separate spectral features
cor-responding to explosives both from a noisy background and any contaminants based on
their rate of response to heating.
A temperature ramp is used to probe Raman features of explosives and their
mix-tures with choice contaminants. Implementation of 2D correlation analysis results in
sig-nificant enhancement of explosive signal relative to background. Effective separation of
explosive features is demonstrated for two biogenic contaminants: saliva, which represents
proteins, lipids and saccharides, and diesel soot, which contains heteroaromatic species. We
discovered that correlation analysis can further provide information on the physical state of
the unstable compounds, distinguishing crystalline from amorphous states. The
well-established spectral shifts of organic crystals with increasing temperature provide strong
2D spectral features, which could be utilized for further sample identification. Several
as-pects of the 2D correlation analysis are examined to optimize effectiveness of detection.
Use of the time-averaged spectrum as the reference for calculating dynamic spectra yields
the best performance. Normalization schemes are found to be of limited utility: some of
them enhance specific features, but their application also can result in false positives. The
only data pretreatment recommended for the application of long standoff detection in
arbi-trary environments is the removal of data offset by the subtraction of the minimum value
from each spectrum.
The ultimate physical properties of semicrystalline materials, such as strength,
molecu-ix lar characteristics and processing conditions. Morphology is examined using small-angle
and wide-angle x-ray scattering (SAXS and WAXS, respectively), for which 2D
correla-tion analysis is well suited due to its simplificacorrela-tion of complex scattering curves through
the de-convolution of overlapping features, the determination of sequential order of
inten-sity changes, and the enhancement of spectral resolution by spreading data over a second
dimension. The effects of different molecular characteristics on crystallization of
semi-crystalline polymers are examined by conventional techniques and 2D correlation analysis
of x-ray scattering data.
Model short-chain branched (SCB) polyethylenes are found to crystallize in three
regimes during quiescent temperature ramps. “Primary-irreversible” crystallization occurs
at the highest temperatures and is marked by large changes in the morphological
parame-ters (crystallinity, long period, and overall scattering power) as primary lamellae propagate
relatively rapidly through unconstrained melt. Once the majority of unconstrained melt is
consumed, secondary lamellar growth occurs in the largest non-crystalline regions between
primary lamellae marks slower “secondary-irreversible” crystallization that occurs at
in-termediate temperatures. At low temperatures, the values of the morphological parameters
are equal during cooling and subsequent heating marking the slow formation of fringed
mi-celles that occurs in the “reversible” crystallization regime. While irreversible and
reversi-ble crystallization have been observed previously in SCB materials, this is the first time
that a physical justification is presented for the separation of the irreversible crystallization
x Each regime is identified by unique features in the 2D correlation plots.
Specifi-cally, 2D heterospectral analysis of SAXS/WAXS data reveals identical qualitative
behav-ior between a series of branched hydrogenated polybutadienes in each regime: the
primary-irreversible regime is characterized by the intensity redistribution (sign change) only in
SAXS, the secondary-irreversible regime is characterized by the intensity redistribution
only in WAXS, while the reversible regime is characterized by the intensity redistribution
in both SAXS and WAXS. Additionally, two-dimensional correlation analysis provides a
unique approach to gain insight into subtle changes during morphology development, such
as the development of density heterogeneities in the non-crystalline regions.
The presence of short-chain branches is found to have a profound, diminishing
ef-fect on the formation of oriented structures in response to flow-induced crystallization.
Crystallization of SCB materials is examined in the presence of high density polyethylene
(HDPE) in order to expose the effectiveness of the branched materials to propagate
ori-ented morphology. HDPE is found to serve as an effective clarifying and nucleating agent
for a metallocene copolymer with complex concentration dependence. The SCB material is
found to be incapable of propagating oriented growth on large length scales. Evidence
pre-sented suggests that this behavior is the result of a buildup of chain defects at the growth
front which results in a transition from oriented to isotropic crystallization. Hence, it is
pro-posed that size of crystal structures can be controlled by dictating the amount of copolymer
incorporated during oriented structure formation via the crystallization temperature,
allow-ing for the fine-tunallow-ing of ultimate material properties. Ultimately, it is found that both
xi Two-dimensional correlation analysis in conjunction with thermal decomposition is
demonstrated as an effective means to increase the success of detection of energetic
com-pounds using Raman spectroscopy. This combination of analysis and a perturbation that
elicits a unique response in the compound can be applied to variety of other detection
sys-tems. Additionally, 2D correlation analysis is demonstrated to provide unique insight into
the morphology evolution during crystallization of semicrystalline materials, which can be
used to control their material properties. The ideas presented here can be easily applied to
xii
TABLE OF CONTENTS
Acknowledgements... iii
Abstract... vii
Table of Contents... xii
List of Figure and Tables ... xviii
Nomenclature... xxii
1. Introduction ...I-1
1.1 TWO-DIMENSIONAL CORRELATION SPECTROSCOPY ...I-2 1.2 EXPLOSIVES DETECTION...I-10 1.3 SEMICRYSTALLINE MATERIALS...I-12 1.4 REFERENCES ...I-15
2. Two-Dimensional Correlation Analysis for Explosive Detection... II-1
2.1 INTRODUCTION ...II-2 2.2 EXPERIMENTAL METHODS ...II-6 2.2.1 Materials ...II-6
2.2.2 Raman Microspectroscopy ...II-8 2.2.2.1 Contamination Studies...II-8 2.2.3 Long Standoff Raman Spectroscopy ...II-9 2.2.4 Computation ...II-10 2.3 RESULTS ...II-14
xiii 2.3.2.2 Multi-Point: RDX, Soot, Sand, Polybutadiene...II-27 2.3.2.3 Multi-Sample: PETN, Soot, Polybutadiene...II-29 2.3.3 Long Standoff Detection...II-32 2.4 DISCUSSION ...II-34 2.4.1 Application of 2D Correlation Analysis...II-34 2.4.1.1 Synchronous Spectra ...II-36 2.4.1.2 Asynchronous Spectra ...II-37 2.4.1.3 Data Pretreatments...II-39 2.4.2 Fluorescence ...II-40
2.4.3 Raman Signal Enhancement ...II-41 2.5 CONCLUSION...II-42 2.6 ACKNOWLEDGEMENTS...II-44 2.7 REFERENCES ...II-43
3. Interplay between Short-Chain and Long-Chain Branches...III-1
3.1 INTRODUCTION ... III-2 3.2EXPERIMENTAL METHODS ... III-6 3.2.1 Materials ... III-6
3.2.2 Differential Scanning Calorimetry ... III-8 3.2.3 X-ray Scattering... III-9 3.3 RESULTS... III-11
3.3.1 Differential Scanning Calorimetry ... III-11 3.3.1.1 Temperature Ramps... III-11 3.3.1.2 Isothermal Crystallization ... III-12 3.3.2 X-ray Scattering... III-16
xiv 3.4.1.1 Primary-Irreversible Crystallization... III-27 3.4.1.2 Secondary-Irreversible Crystallization... III-29 3.4.1.3 Reversible Crystallization at Low Temperatures ... III-31 3.4.1.4 Transition Temperatures... III-33 3.4.2 DSC Double Melting ... III-34 3.4.3 Effects of Molecular Characteristics ... III-36 3.4.3.1 Crystallinity ... III-37
3.4.3.2 Long Period ... III-38 3.4.3.3 DSC Crystallization Kinetics ... III-39 3.4.4 Implications for Flow-Induced Crystallization... III-40 3.5CONCLUSION ... III-41 3.6APPENDIX—Crystalline and Amorphous Layer Thickness... III-44 3.7ACKNOWLEDGEMENTS... III-45 3.8REFERENCES ... III-47
4. Morphology Development in Model Polyethylenes via Two-Dimensional
Correlation Analysis...IV-1
4.1 INTRODUCTION ... IV-2 4.2 EXPERIMENTAL METHODS ... IV-6 4.2.1 Materials ... IV-6 4.2.2 X-ray Scattering... IV-6 4.2.3 Computation ... IV-7
4.2.3.1 Conventional 2D Correlation Analysis... IV-7 4.2.3.2 Two-Dimensional Moving Window Analysis... IV-8 4.2.3.3 Hetero-Spectral Correlation Analysis... IV-9 4.3 RESULTS AND DISCUSSION... IV-11 4.3.1 WAXS ... IV-12
xv 4.3.1.4 Searching for a Semi-Ordered Phase... IV-28 4.3.2 SAXS ... IV-30
4.3.2.1 Crystallization of Random Copolymers ... IV-30 4.3.3 SAXS/WAXS Hetero-Spectral Correlation Analysis... IV-38 4.3.3.1 Crystallization of Random Copolymers ... IV-38 4.3.3.2 Scattering at the Onset of Crystallization... IV-43 4.3.4 Material Comparisons... IV-45 4.4 CONCLUSION ... IV-45 4.5 ACKNOWLEDGEMENTS... IV-49 4.6 REFERENCES ... IV-50
5. Morphology Development in HDPE/Copolymer Blends: Quiescent and
Flow-Induced Crystallization ... V-1
5.1 INTRODUCTION ... V-2 5.2 EXPERIMENTAL METHODS ... V-4 5.2.1 Materials ... V-4
5.2.2 Differential Scanning Calorimetry ... V-5 5.2.3 Flow-Induced Crystallization ... V-6 5.2.4 Optical Characterization ... V-8 5.2.5 X-ray Scattering... V-9
xvi 5.4 DISCUSSION... V-26
5.4.1 Quiescent Crystallization... V-26 5.4.1.1 Nucleation Effects ... V-26 5.4.1.2 Morphology Evolution ... V-28 5.4.2 Flow-Induced Crystallization ... V-32 5.5 CONCLUSION... V-38 5.6 ACKNOWLEDGEMENTS... V-40 5.7 REFERENCES ... V-41
APPENDIX A—MATLAB Code for X-ray Data and 2D Correlation
Analysis ... A-1
A.1 Save Experimental Parameters... A-2 A.2 Open Image Files... A-2 A.3 Extract I(q) vs. q ... A-4 A.4 Lorentz Correction... A-5 A.5 Long Period ... A-6 A.6 SAXS Integrated Intensity... A-7 A.7 Conventional 2D Correlation Analysis... A-8 A.8 Hilbert-Noda Matrix ... A-12 A.9 2D Hetero-Spectral Analysis ... A-12 A.10 2D Moving Window Analysis ... A-14 A.11 ACKNOWLEDGEMENTS ... A-15 A.8 REFERENCES ... A-16
APPENDIX B—Flow-Induced Crystallization of Model Systems ...B-1
B.1 INTRODUCTION ...B-2 B.2 EXPERIMENTAL METHODS ...B-4 B.2.1 Materials...B-4
xviii
LIST OF FIGURES AND TABLES
Chapter 1
Figure 1.1 Simulated dataset for 2D correlation analysis...I-6 Figure 1.2 Example of 2D correlation analysis ...I-7 Figure 1.2 Schematic representation of branched polymer ...I-13
Table 1.1 Noda’s rules for sequential order ...I-8
Chapter 2
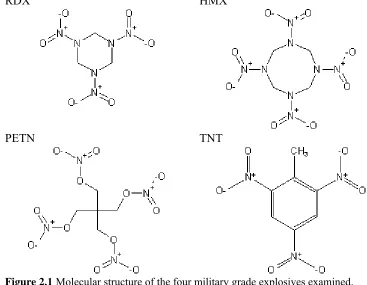
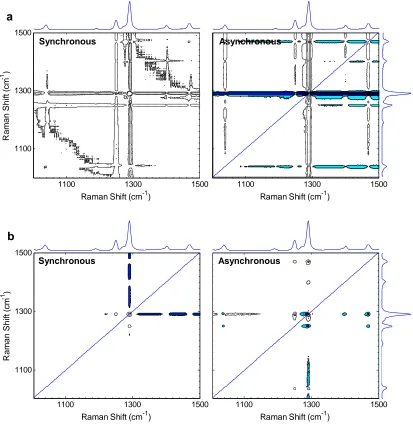
Figure 2.1 Molecular structure of military grade explosives...II-7 Figure 2.2 Raman spectra of explosive residues...II-15 Figure 2.3 2D correlation spectra during heating ramps for RDX and HMX ...II-17 Figure 2.4 Histogram plots of intensity values for 1D and
2D synchronous spectra. ...II-18
Figure 2.5 Raman spectra of PETN collected at select temperatures ...II-19 Figure 2.6 2D correlation spectra during heating ramps of PETN: normalization
comparison ...II-20
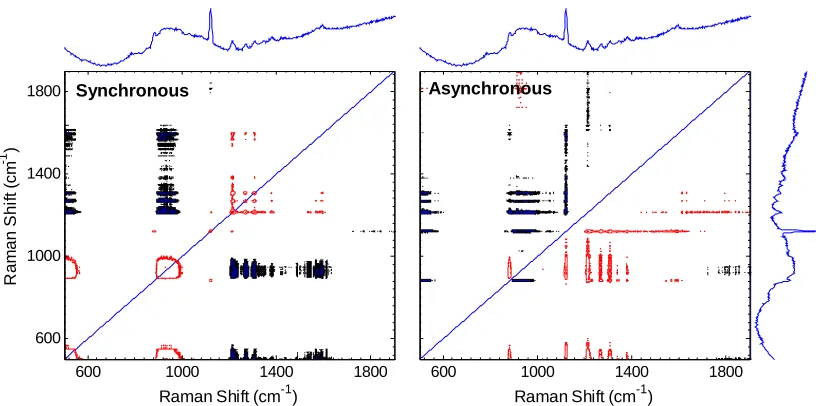
Figure 2.7 2D correlation spectra obtained from floored spectra of RDX, saliva and sand ...II-26
Figure 2.8 Comparison between 1D averaged and autocorrelation spectra following different data pre-treatment...II-27
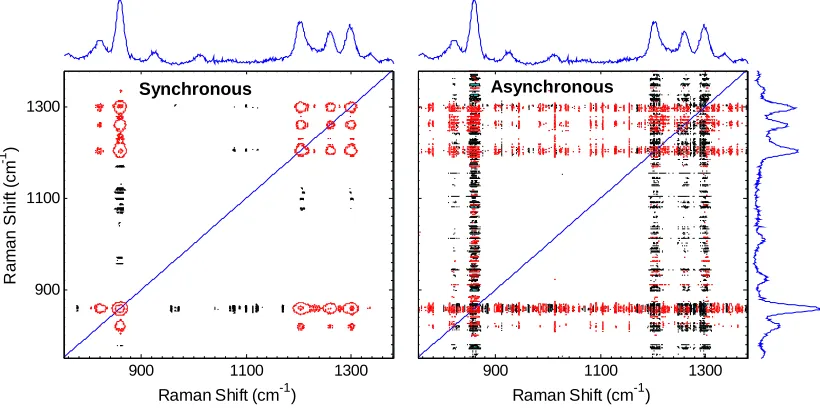
Figure 2.9 2D correlation spectra of multi-point experiment of RDX, diesel soot and PB on sand...II-29
Figure 2.10 Individual spectra at room temperature of PETN, soot, and bulk PB used for multi-sample experiment...II-30
Figure 2.11 2D correlation spectra multi-sample experiment ...II-31 Figure 2.12 Comparison between averaged 1D and autocorrelation spectra of
multi-point experiment...II-32
xix
Table 2.1 Pre-treatments and normalizations...II-11 Table 2.2 Perfomance parameter...II-18 Table 2.3 Comparison of performance parameter based on different
normalizations...II-22
Chapter 3
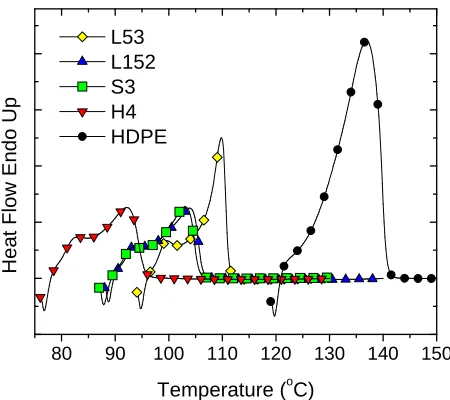
Figure 3.1 Synthesis of hydrogenated polybutadiene via anionic polymerization ... III-3 Figure 3.2 Schematic representation of model polyethylenes... III-7 Figure 3.3 DSC during temperature ramps ... III-12 Figure 3.4 DSC crystallization kinetics... III-13 Figure 3.5 DSC melting traces following isothermal crystallization ... III-14 Figure 3.6 Peak melting temperature following isothermal crystallization ... III-15 Figure 3.7 WAXS crystallinity during cooling and heating... III-17 Figure 3.8 WAXS parameters for HPBDs examined... III-18
Figure 3.9 Evolution of SAXS intensity during cooling ... III-19 Figure 3.10 Long period during cooling and heating ... III-20 Figure 3.11 SAXS parameters for HPBDs examined... III-21 Figure 3.12 SAXS integrated intensity during cooling and heating... III-22 Figure 3.13 Long period during ‘ramp-iso’ protocol... III-23 Figure 3.14 Long period during isothermal crystallization ... III-24 Figure 3.15 Evolution of SAXS intensity during isothermal crystallization ... III-25 Figure 3.16 Schematic representation of three crystallization regimes of HPBDs III-28 Figure 3.17 Schematic representation of fringed micelle versus lamellae... III-32 Figure 3.18 Lamellar layer thickness during cooling and heating ... III-45
xx Chapter 4
Figure 4.1 Schematic representation of 2D correlation moving window analysis ... IV-9 Figure 4.2 WAXS intensity of homopolymer and copolymer ...IV-12 Figure 4.3 2D correlation analysis of WAXS for homopolymer ...IV-16 Figure 4.4 2D correlation analysis of WAXS for copolymer...IV-21 Figure 4.5 Select WAXS intensity curves for copolymer ...IV-26 Figure 4.6 Schematic representation of crystallization...IV-30 Figure 4.7 Evolution of Lorentz-corrected SAXS for homopolymer ...IV-31 Figure 4.8 2D correlation analysis of SAXS for copolymer ...IV-33 Figure 4.9 2D correlation analysis of normalized SAXS for copolymer...IV-37 Figure 4.10 2D hetero-spectral analysis of SAXS/WAXS for copolymer ...IV-39 Figure 4.11 2D hetero-spectral in conjunction of moving window analysis for onset
of crystallization of copolymer ...IV-43
Table 4.1 Molecular characteristics of model polyethylenes ... IV-6 Table 4.2 Summary of crystallization behavior of HPBD materials... IV-46
Chapter 5
Figure 5.1 Schematic representation of orientation of chains by flow... V-3 Figure 5.2 Experimental short-term shear protocol ...V-7 Figure 5.3 Coordinate axes of experimental setup...V-9
Figure 5.4 Results from DSC nucleation studies... V-13 Figure 5.5 Transmittance of blends during quiescent crystallization... V-14 Figure 5.6 Example Hv SALS patterns of blends during quiescent crystallization . V-15
Figure 5.7 Transmittance of 0.5 wt % HDPE blend during quiescent
crystallization ... V-16
Figure 5.8 Hv SALS patterns as a function of time during quiescent crystallization
of the 0.5 wt % HDPE blend... V-17
Figure 5.9 Azimuthal dependence of Hv SALS patterns during quiescent
xxi Figure 5.10 Polarized light optical images for HDPE/EH50 blends... V-18 Figure 5.11 Hv SALS pattern of 1 wt % HDPE at the onset of crystallization... V-19
Figure 5.12 WAXS intensity of 1 wt % HDPE blend at 98 °C... V-19 Figure 5.13 Evolution of SAXS during quiescent crystallization of blends... V-21 Figure 5.14 STEM images of blends following quiescent crystallization ... V-22 Figure 5.15 Transmittance and apparent birefringence during flow-induced
crystal-lization ... V-23
Figure 5.16 Hv SALS patterns subsequent to flow of two blends... V-25
Figure 5.17 Crystallinity and degree of orientation subsequent to flow ... V-25 Figure 5.18 Schematic representation of quiescent crystallization of blends with
two HDPE concentrations... V-30
Figure 5.19 Schematic representation of orientation of lamellar discs by flow ... V-34 Figure 5.20 Schematic representation of varying extent of oriented growth... V-36 Figure 5.21 Shish-kebab structure observed in a previous study ... V-36 Figure 5.22 Evolution of degree of orientation following flow at different
temperatures ... V-37
Table 5.1 Molecular characteristics of materials used in flow studies...V-4 Table 5.2 Autocorrelation intensities of (110) reflection during crystallization... V-20
Appendix B
Figure B.1 Schematic representation of overlap concentration...B-3 Figure B.2 Molecular structure of bimodal blend components...B-4 Figure B.3 Rheo-optical results of sheared PE blends ...B-7 Figure B.4 Rheo-optical results of sheared iPP blends...B-8
xxii
NOMENCLATURE
a unit cell parameter
A(q) autocorrelation intensity
Aˆ amplitude of response to perturbation b unit cell parameter
c* overlap concentration
d sample thickness
DSC Differential Scanning Calorimetry
FIC Flow-Induced Crystallization
G relaxation modulus
GN0 plateau modulus
HDPE high density polyethylene
HPBD hydrogenated polybutadiene
I(q) scattering intensity
Iperp, Ipara light intensity transmitted through crossed and parallel polarizers,
respec-tively
Im imaginary part of complex number J(q) Lorentz-corrected scattering intensity
Lp long period
LCB long chain branch
m total number of discrete spectra Me molecular weight of entanglements
Mn number-average molecular weight
Mw, Mw,tot total weight-average molecular weight
Mw,a weight-average molecular weight of long chain branch (‘arm’)
Mw,b weight-average molecular weight of chain backbone
Na Avogadro’s number
Δn birefringence
xxiii PDI polydispersity
PE polyethylene q scattering wavevector Q total SAXS scattering power Rg radius of gyration
Re{} real part of complex number SALS Small Angle Light Scattering SAXS Small Angle X-ray Scattering
SCB short chain branch
t perturbation variable
tc isothermal crystallization time
Tc experimental isothermal crystallization temperature
thold hold-time at elevated temperatures
Thold elevated temperature used in nucleation studies
Tm peak melting temperature as determined by DSC
tmax peak crystallization time
Tmin, Tmax limits of perturbation variable
ts shearing time
Tx peak crystallization temperature as determined by DSC
ΔT apparent subcooling
v velocity vector
WAXS Wide Angle X-ray Scattering
Wi Wiessenberg number
Xc WAXS crystallinity index
yi discrete Raman spectrum
y
~ dynamic spectrum
z
~ orthogonal spectrum
xxiv
θ azimuthal angle
ϑ time
λ wavelength
μ viscosity
ν spectral variable
ρ density
σw wall shear stress
τr terminal relaxation time
φ cospectrum
Φ 2D synchronous spectrum
ψ quad-spectrum
Ψ 2D asynchronous spectrum
Chapter 1
Introduction
1.1 TWO-DIMENSIONAL CORRELATION SPECTROSCOPY...I-2 1.2 EXPLOSIVES DETECTION ...I-10
1.3 SEMI-CRYSTALLINE MATERIALS...I-12
The present thesis explores two applications of two-dimensional correlation
analysis: 1) detection of explosive compounds in the presence of dynamic background
signals, and 2) categorizing and understanding transient structure development in
semi-crystalline materials. Two-dimensional (2D) correlation analysis is a powerful technique
that can be used to both visualize the relationship between intensity changes at different
spectral points as a result of a perturbation and also elucidate the underlying physical
phenomena causing the spectral response. It is applied to a set of one-dimensional (1D)
data representing the response of a sample to a specific perturbation. Many scientific
ex-periments result in these types of datasets, yet application of 2D correlation analysis is
still mostly limited to the fields of optical and NMR spectroscopy, and furthermore
ap-plied predominately in a laboratory setting.
1.1
TWO-DIMENSIONAL CORRELATION SPECTROSCOPY
With roots in the field of nuclear magnetic resonance (NMR), two-dimensional
(2D) correlation analysis (usually termed 2D correlation spectroscopy because of its
fre-quent use in vibrational spectroscopy) allows one to examine the relationship between
changes in spectral intensity at two different spectral variables in response to an external
perturbation. Its application to vibrational spectroscopy was introduced by Isao Noda
through the study of infrared (IR) spectral response to a sinusoidal perturbation,1-3 and
subsequently generalized to allow the use of a perturbation with arbitrary fluctuations.4
Furthermore, in 2000, Noda introduced mathematical formulations based on the
Hilbert-Noda transformation matrix that greatly simplified the analysis, allowing rapid
process-ing of discrete datasets. These developments resulted in a significant increase in the
Generalized two-dimensional correlation spectroscopy is based on the
quantita-tive examination of spectral intensity changes as a function of the external perturbation, t,
observed at two different spectral variables, ν1and ν2 (for example, Raman shift as
exam-ined in Chapter 2 and scattering vector as examexam-ined in Chapter 4). Most commonly,
analysis is conducted on a dynamic spectrum, which is defined for each value of the
per-turbation variable on its interval between Tmin and Tmax with respect to some reference
spectrum, yref:
⎩ ⎨ ⎧ − ≤ ≤ = otherwise 0 for ) ( ) , ( ) , (
~ y t y Tmin t Tmax
t
yν ν ref ν . (1.1)
A diversity of perturbation variables have been examined in literature, including strain,
temperature, applied electric/magnetic field, irradiation, and time (see review by Noda6).
The intensity at distinct spectral variables ν1 and ν2 tend to vary synchronously when they
originate from the same molecular species or underlying physical process. Therefore,
analysis of the synchronous two-dimensional correlation is a useful tool for identifying
spectral changes that are intimately related. The intensity changes at distinct spectral
variables tend to lag (lead) one another when, for example, formation of a given species
is a prerequisite for a subsequent reaction to occur. Therefore, it is useful to characterize
asynchronous two-dimensional correlations to identify spectral changes that occur
se-quentially.
The analysis may be readily understood for the simple case of a sinusoidal
per-turbation in the regime of linear response. A perper-turbation of the form t=Re
{
T'eiωϑ}
hav-ing amplitude T’would elicit a response at each νi that would oscillate at the same
{
ν ωϑ βν}
{
ν ωϑ}
ν i
i i
i
i t A e A e
y( , ) Re ( ) i Re ˆ( )
~ = ( + ( ) = , (1.2)
with amplitude A(νi) and phase β(νi). For distinct values of the spectral variable ν1 and ν2,
the extent to which variation of intensity occurs simultaneously is captured by the
“co-spectrum,”
{
ˆ( ) ˆ ( )}
Re ) ,
( * 2
1 2
1 ν ν ν
ν
φω ≡ A ⋅A , (1.3)
and the extent which their variations lag (lead) one another is captured by the
“quad-spectrum,”
{
ˆ( ) ˆ ( )}
Im ) ,
( * 2
1 2
1ν ν ν
ν
ψω ≡ A ⋅A , (1.4)
where ˆ*( ) is the complex conjugate of . i
A ν Aˆ(νi)
For a more complicated perturbation and spectral response composed of multiple
sinusoids, the synchronous 2D correlation spectrum, Φ(ν1,ν2), is defined in terms of the
cospectra as
∫
∞ = Φ 0 2 1 21 ( , )
1 ) , ( φ ν ν ω π ν
ν ω d , (1.5)
and the asynchronous 2D correlation spectrum, Ψ(ν1,ν2), is defined in terms of the
quad-spectra as
∫
∞ = Ψ 0 2 1 21 ( , )
1 ) , ( ψ ν ν ω π ν
ν ω d . (1.6)
Noda further generalized this analysis to arbitrary functional forms of the perturbation, t,
and spectral response, ~y(ν1,t)≡~y1(t), by first decomposing the signal into sinusoids and
representing it in the frequency domain with the application of the Fourier transform with
∫
∞
∞ −
−
= y t e dt
Y~(ν ,ω) ~(ν , ) iωt
1
1 . (1.7)
In this case of an arbitrary perturbation defined on the interval between Tmin and Tmax,
the 2D correlation spectrum is given by
∫
∞ ⋅ − = Ψ + Φ 0 * 2 1 min max 2 1 21 ( )
~ ) ( ~ ) ( 1 ) , ( ) , ( ω ω ω π ν ν ν
ν Y Y d
T T
i . (1.8)
To circumvent the complexity and required computing power for the Fourier
transform calculations, Noda used the well-known Wiener-Khintchine theorem to derive
the 2D synchronous spectrum from the cross-correlation function4, 7 such that
∫
⋅ − = Φ max min ) , ( ~ ) , ( ~ 1 ) ,( 1 2
min max 2 1 T T dt t y t y T
T ν ν
ν
ν . (1.9)
For a rigorous mathematical development, see Appendix 2.1 of reference 5.
The asynchronous spectrum can be computed from the cross-correlation of the
dynamic spectrum, ~y(ν,t), and its orthogonal spectrum, ~z(ν,t):
∫
⋅ − = Ψ max min ) , ( ~ ) , ( ~ 1 ) ,( 1 2
min max 2 1 T T dt t z t y T
T ν ν
ν
ν . (1.10)
To calculate the orthogonal spectrum, Noda utilized the Hilbert transform, which has the
effect of applying a phase shift of π/2 to each Fourier component of the dynamic
spec-trum, such that
∫
∞ ∞ − − ≡ ' ' ) , ( ~ 1 ) , ( ~ dt t t t y t z Pv ν πν , (1.11)
where represents the implementation of the Cauchy principal value such that the
and )~z(ν,t , are orthogonal. Hence, through the application of a phase shift in Fourier
space, the asynchronous spectrum allows for the examination of temporal separation
be-tween intensity changes in real space.
To examine some of the advantages of 2D correlation analysis, let us consider a
simulated dataset, I(ν,t) for Tmin≤t ≤Tmax, containing three peaks (Figure 1.1a). The first
peak increases quadratically in response to the perturbation, the second peak remains
un-changed, and the third peak decreases linearly in the perturbation variable (Figure 1.1b).
spectral variable, ν
Intensit
y (a.u
.)
a
1
2
3
Peak Int
ensit
y (
a.u.)
perturbation variable, t Peak 1
Peak 2
Peak 3
b
Figure 1.1a) Simulated dataset. b) Evolution of peak intensities with perturbation of peaks in a.
The synchronous spectrum, Φ(ν1, ν2), is symmetric with respect to the diagonal
(ν1 = ν2) and reveals simultaneous or coincident changes at two different spectral
vari-ables as the result of the perturbation. Consequently, in Figure 1.2, one observes two
autopeaks along the diagonal corresponding to the intensity changes of peaks 1 and 3.
The autocorrelation intensity along the diagonal is always positive and represents the
In the off-diagonal position corresponding to peaks 1 and 3, one observes cross
peaks indicating that the change in these two peaks occurs simultaneously. The negative
sign of these features is consistent with the increase of peak 1 and a simultaneous
de-crease in peak 3 in response to the perturbation. The cross peaks are positive when
inten-sity changes occur in the same direction.
The synchronous plot contains no features corresponding to peak 2 since there is
no change in its intensity in response to the perturbation. This aspect of the 2D
correla-tion analysis allows one to filter out static features, making it suitable for selective
detec-tion of compounds, as is discussed in Chapter 2.
synchronous asynchronous
ν1
ν2
ν1
Figure 1.2Synchronous (left) and asynchronous (right) spectra corresponding to simulated
dataset in Figure 1.1. Shaded-in contours are negative, while non-shaded contours are positive. The average 1D spectra are plotted on the sides.
The 2D asynchronous spectrum, Ψ(ν1, ν2), reveals the extent to which intensity
changes at two spectral variables lead or lag one another during a perturbation. By its
na-ture, it is antisymmetric and contains no autopeaks. In Figure 1.2, one observes features
corresponding to peaks 1 and 3, indicating that there is temporal separation between these
The sign of the cross peaks reveals the sequential order of peak variations based
on Noda’s rules.3, 5 Since the 2D asynchronous spectrum is anti-symmetric, it suffices to
consider the region where ν1 > ν2 (below the diagonal). Interpretation of the sign of a
cross peak at (ν1,ν2) when ν1 > ν2 in the asynchronous spectrum, Ψ(ν1, ν2), depends on the
sign of the intensity of the synchronous spectrum at (ν1, ν2): if Φ(ν1,ν2) is positive, then a
positive asynchronous cross peak below the diagonal indicates that the response at ν1
pre-cedes that at ν2; if Φ(ν1,ν2) is negative, then that positive cross peak indicates that the
re-sponse at ν1 lags that at ν2 (Table 1.1). In the present case, negative features
correspond-ing to peaks 1 and 3 are observed both in the synchronous and asynchronous plots.
There-fore, the change in peak 3 precedes that in peak 1. This temporal separation can be
inter-preted in a more practical manner as a difference in half intensity and half time of peak
evolution.8 From Figure 1.1b, it is apparent that peak 3 has greater intensity half-way
through the perturbation (half intensity) and achieves half of the total intensity change
earlier along the perturbation (half time) than peak 1, resulting in changes in peak 3
pre-ceding those in peak 1.
Table 1.1Noda’s Rules for sequential order when ν1 > ν2. Φ(ν1,ν2) Ψ(ν1,ν2) Interpretation
+ + ν1 precedes ν2
+ – ν1 lags ν2
– + ν1 lags ν2
– – ν1 precedes ν2
In reality, the analysis of 2D spectra can be quite complex, especially in the case
of the asynchronous spectrum. The introduction of noise can often lead to artificial peaks
in the asynchronous spectrum.9, 10 Additionally, variations in the peaks themselves (i.e.,
These peak effects have been studied through simulated spectra revealing patterns in both
the synchronous and asynchronous spectra that correspond to some commonly observed
behaviors.5, 11, 12 For example, a “four-leaf clover” pattern in the synchronous spectrum
can indicate either two overlapping peaks whose intensities vary in opposite directions or
a peak that steadily shifts in position. The explanation for the pattern can be discerned by
evaluating the asynchronous spectrum. A four-leaf clover can be assigned to overlapping
peaks exhibiting opposite changes in intensity if the asynchronous pattern contains either
no peaks (if changes are simultaneous) or one pair of complimentary peaks (above and
below the diagonal if the intensity changes are temporally separated). On the other hand,
a four-leaf clover in the synchronous spectrum can be assigned to a peak shifting in
posi-tion if the asynchronous spectrum contains a distinct “butterfly” pattern. The importance
of such patterns is apparent in Chapter 4.
Two-dimensional correlation analysis has gathered momentum due to the
numer-ous advantages it provides. It allows for the simplification of complex spectra containing
overlapped peaks. Additionally, one obtains enhancement in spectral resolution due to the
spreading of data over a second dimension. It is possible to establish unambiguous
as-signments through correlation of bands, as well as determine specific sequential order of
intensity changes. Furthermore, Noda’s efforts have resulted in nearly universal
applica-bility of the technique, which is now regularly applied across different disciplines to
ex-amine ‘spectral’ responses to a variety of perturbation types. While the application of 2D
correlation spectroscopy is still predominantly to optical spectra, approximately 1 in 6
published experiments have used other analytical probes,6 including x-rays, as is the case
perturba-tion, is used in the following chapters, composiperturba-tion, chemical reactions, and physical
processes can also be employed.6
Furthermore, the abundant application of 2D correlation spectroscopy has
al-lowed for its further evolution. A summary of this was formulated by Noda in 2008;6
de-velopments of note are moving window and hetero-correlation analyses. Moving window
2D correlation analysis (MW2D) is designed to probe complicated spectral responses by
analyzing smaller subsets of data that are shifted incrementally along the perturbation
axis to cover the full set. This analysis allows one to gauge the spectral response at
spe-cific points along the perturbation variable rather than the overall response to the full
range. Further detail and an example of this technique are presented in Chapter 4.
Hetero-correlation analysis is applied to two independent measurements of perturbation-induced
dynamic spectra. Most frequently, hetero-spectral correlation is applied to a sample’s
re-sponse to a perturbation probed by two different spectral probes. An example of
SAXS-WAXS hetero-spectral correlation analysis is presented in Chapter 4.
1.2
EXPLOSIVES DETECTION
Improvised Explosive Devices (IEDs) continue to be the most effective weapon
employed against coalition forces in Iraq and Afghanistan. The Joint Improvised
Explo-sive Device Defeat Organization (JIEDDO) is currently implementing over 300
initia-tives to tackle this problem.14 In this era of persistent conflict and global terrorism, the
ability to detect explosives in both war zones and high-security installations can save
human lives.
The vast challenge in the detection of explosives is in part due to their nature (e.g.,
interference from contaminants. Common explosives are known to have very low vapor
pressures,15, 16 making vapor-based detection, such as infrared spectroscopy, particularly
challenging. Furthermore, military grade explosives are often found in solid solutions,
such as RDX in plastic composition C4 (C4) explosive, which further limits their vapor
pressures.17 Detection of solid-state explosives is usually based on identifying trace
amounts which requires extreme sensitivity. To compound these intrinsic challenges,
ex-plosives are often found concealed in a large variety of dynamic environments.
In a laboratory, when they have been separated from any contaminants,
explo-sives can be detected by many reliable techniques, such as mass spectrometry, ion
mobil-ity spectrometry, and fluorescence quenching of polymers.15, 16 However, few of these
techniques can be applied at an airport to screen passengers and even fewer still can be
implemented in the desert environments of Iraq to detect hidden IEDs.
Furthermore, in the case of IEDs, it is desirable to accomplish detection at a
dis-tance, in order to ensure human safety. Standoff detection systems are being developed
based on photodissociation laser-induced fluorescence,18-20 laser-induced breakdown
spectroscopy,21 terahertz time domain spectroscopy,22 and Raman spectroscopy.23-29 In
most of these cases, the focus is on improvement of hardware. While this approach has
resulted in good progress toward effective long standoff detection, further advancement
can be achieved through data analysis algorithms, such as spectral pattern recognition and
chemometric-based techniques.15, 30
Two-dimensional correlation analysis is well suited for detection applications
be-cause of its simplification of complex spectra and enhancement of spectral resolution.
to a thermal perturbation, especially when compared to contaminants, such as humic
sub-stances. The possibility of using 2D correlation analysis in conjunction with a thermal
modulation is examined in Chapter 2.
1.3
SEMI-CRYSTALLINE MATERIALS
More than two-thirds of the annual commercial production of synthetic polymers
is comprised of semi-crystalline materials. The many advantages of these materials, such
as light weight, flexibility, chemical resistance and toughness, are the reason they are so
abundant in today’s society, finding applications in the medical market, electronics,
con-struction, textiles and packaging.31 Specifically, polyethylene (PE) and polypropylene
(PP) dominate the semi-crystalline polymer market with demand for PE and PP in North
America just below 40 billion pounds and 21 billion pounds, respectively, in 2006.32
De-mand is expected to grow because low cost and expanding versatility make these
poly-mers prime candidates to substitute for less desirable materials. For example, PE can be
used to replace steel in automotive fuel tanks and PP can be used to replace aluminum
honeycombs as an impact energy absorber.33
PP and PE, like other semi-crystalline materials, spontaneously form a
nanocom-posite structure that confers strength from its crystalline domains and toughness from the
non-crystalline material in between. As such, ultimate physical properties of these
mate-rials are directly related to their morphology (the distribution of crystalline and
non-crystalline regions). The morphology is primarily a function of molecular characteristics
(molecular weight, molecular architecture, etc.) and processing conditions (thermal and
Fabrication processes with PP and PE include injection molding, film blowing,
and fiber spinning, and involve non-isothermal conditions, as well as very strong and
complex flow fields (shear, elongational, or mixed). Different processing conditions can
alter the spatial organization and alignment of the crystallites, affecting properties such as
strength, hardness, and surface texture. For example, the elastic modulus of
highly-oriented PE fibers is 100 times that of quiescently crystallized PE.34
a b
a b
Figure 1.3Schematic diagram of a polymer containing both long-chain branches evident in a and
short-chain branches evident in b.
In addition, a polymer’s molecular characteristics can affect its response to
proc-essing conditions. Long-chain branches (LCB) alter melt dynamics affecting the melt’s
response to a flow field and hence its subsequent morphology. Short-chain branches
(SCB) can act as crystal defects decreasing melting temperature and crystallinity.35
Polymers containing SCB and LCB (Figure 1.3) are of particular interest because of their
rich material properties and are examined in Chapter 3. With advances in synthesis, it is
now possible to create varying branched polymers on the commercial scale. Low Density
PE (LDPE), an LCB and SCB material, and Linear Low Density PE (LLPDE), an SCB
material, comprise over half of the current PE market and are used to make films.36
process of such linear and branched semi-crystalline materials in order to control their
physical properties. Crystallization of SCB materials under flow is examined in Chapter 5.
By understanding the behavior of these materials, we can greatly expand the property
en-velope of semi-crystalline materials, particularly polyolefins.
Polymer crystallization studies employ many probes in order to gain insight into
the hierarchy of structures that are formed by semi-crystalline materials. Wide angle
x-ray scattering (WAXS) provides insight into the crystal unit cell (i.e., type, dimensions,
coherence) that is on the order of angstroms. Small angle x-ray scattering (SAXS)
pro-vides insight on the organization of these unit cells into nanoscopic (~10 – 100 nm)
struc-tures and distribution of these nanoscopic strucstruc-tures in the non-crystalline regions (e.g.,
chain-folded lamellar stacks which are on the order of nanometers). Small angle light
scattering provides information on the microscopic structure organization, such as
spher-ulites that are on the order of microns. SAXS and WAXS, which are utilized in Chapters
3 through 5, rely heavily upon the analysis of a series of one-dimensional (1D) scattering
curves (intensity versus scattering vector). Scattering curves are usually collected as a
function of temperature during ramp cooling/heating (crystallization/melting) or time in
the case of isothermal crystallization. These experiments result in large datasets with
transient behaviors that are well suited for 2D correlation analysis. Its sensitivity to
changes in spectral features makes 2D correlation analysis a powerful tool in evaluating
morphology development in semi-crystalline systems, as illustrated in Chapter 4 for
1.4
REFERENCES
1. Noda, I., Two-Dimensional Infrared (2D IR) Spectroscopy. Bulletin of the American
Physical Society 1986, 31, 520.
2. Noda, I., Two-Dimensional Infrared-Spectroscopy. Journal of the American
Chemi-cal Society 1989, 111, (21), 8116-8118.
3. Noda, I., 2-Dimensional Infrared (2d Ir) Spectroscopy - Theory and Applications.
Applied Spectroscopy 1990, 44, (4), 550-561.
4. Noda, I., Generalized Two-Dimensional Correlation Method Applicable to Infrared,
Raman, and Other Types of Spectroscopy. Applied Spectroscopy 1993, 47, (9),
1329-1336.
5. Noda, I.; Ozaki, Y., Two-Dimensional Correlation Spectroscopy. John Wiley & Sons
Ltd.: West Sussex 2004.
6. Noda, I. In Recent advancement in the field of two-dimensional correlation
spectros-copy, 2008; Elsevier Science Bv: 2008; pp 2-26.
7. Noda, I., Determination of Two-Dimensional Correlation Spectra Using the Hilbert
Transform. Applied Spectroscopy 2000, 54, (7), 994-999.
8. Jia, Q.; Wang, N. N.; Yu, Z. W., An Insight into Sequential Order in
Two-Dimensional Correlation Spectroscopy. Applied Spectroscopy 2009, 63, (3), 344-353.
9. Czarnecki, M. A., Interpretation of two-dimensional correlation spectra: Science or
art? Applied Spectroscopy 1998, 52, (12), 1583-1590.
10. Hu, Y.; Li, B. Y.; Sato, H.; Noda, I.; Ozaki, Y., Noise perturbation in functional
theory and application to infrared spectra of a poly(3-hydroxybutyrate) thin film.
Journal of Physical Chemistry A 2006, 110, (39), 11279-11290.
11. McNavage, W.; Dai, H. L., Two-dimensional cross-spectral correlation analysis and
its application to time-resolved Fourier transform emission spectra of transient
radi-cals. Journal of Chemical Physics 2005, 123, (18), 12.
12. Gericke, A.; Gadaleta, S. J.; Brauner, J. W.; Mendelsohn, R., Characterization of
bio-logical samples by two-dimensional infrared spectroscopy: Simulation of frequency,
bandwidth, and intensity changes. Biospectroscopy 1996, 2, (6), 341-351.
13. Morita, S.; Miura, Y. F.; Sugi, M.; Ozaki, Y., New correlation indices invariant to
band shifts in generalized two-dimensional correlation infrared spectroscopy.
Chemi-cal Physics Letters 2005, 402, (1-3), 251-257.
14. Joint Improvised Explosive Device Defeat Organization. www.jieddo.dod.mil
15. Steinfeld, J. I.; Wormhoudt, J., Explosives detection: A challenge for physical
chem-istry. Annual Review of Physical Chemistry 1998, 49, 203-232.
16. Moore, D. S., Instrumentation for trace detection of high explosives. Review of
Scien-tific Instruments 2004, 75, (8), 2499-2512.
17. Proceedings of the First International Symposium on Explosive Detection
Technol-ogy U.S. Department of Transportation: Atlantic City, NJ, May 1992, p 988.
18. Arusi-Parpar, T.; Heflinger, D.; Lavi, R., Photodissociation followed by laser-induced
fluorescence at atmospheric pressure and 24 degrees C: a unique scheme for remote
19. Wynn, C. M.; Palmacci, S.; Kunz, R. R.; Clow, K.; Rothschild, M. In Detection of
condensed-phase explosives via laser-induced vaporization, photodissociation, and
resonant excitation, 2008; Optical Soc Amer: 2008; pp 5767-5776.
20. Wynn, C. M.; Palmacci, S.; Kunz, R. R.; Rothschild, M., A Novel Method for
Re-motely Detecting Trace Explosives. Lincoln Laboratory Journal 2008, 17, (2), 27-39.
21. Czarnecki, M. A., Two-dimensional correlation spectroscopy: Effect of normalization
of the dynamic spectra. Applied Spectroscopy 1999, 53, (11), 1392-1397.
22. Hua, Z.; Redo, A.; Yunqing, C.; Xi-Cheng, Z., THz wave standoff detection of
explo-sive materials. Proceedings of the SPIE - The International Society for Optical
Engi-neering 2006, 6212, 62120L-1-62120L-62120L-8.
23. Carter, J. C.; Angel, S. M.; Lawrence-Snyder, M.; Scaffidi, J.; Whipple, R. E.;
Rey-nolds, J. G., Standoff Detection of High Explosive Materials at 50 Meters in Ambient
Light Conditions Using a Small Raman Instrument. Applied Spectroscopy 2005, 59,
(6), 769-775.
24. Carter, J. C.; Scaffidi, J.; Burnett, S.; Vasser, B.; Sharma, S. K.; Angel, S. M.,
Stand-off Raman detection using dispersive and tunable filter based systems.
Spectro-chimica Acta Part A 2005, 61, 2288-2298.
25. Comanescu, G.; Manka, C. K.; Grun, J.; Nikitin, S.; Zabetakis, D., Identification of
explosives with two-dimensional ultraviolet resonance Raman spectroscopy. Applied
Spectroscopy 2008, 62, (8), 833-839.
26. Eckenrode, B. A.; Bartick, E. G.; Harvey, S. D.; Vucelick, M. E.; Wright, B. W.;
Huff, R. A., Portable Raman Spectroscopy Systems for Field Analysis. Forensic
27. Grasso, R. J.; Russo, L. P.; Barrett, J. L.; Odhner, J. E.; Egbert, P. I., An accurate
modeling, simulation, and analysis tool for predicting and estimating Raman LIDAR
system performance. Proceedings of the SPIE - The International Society for Optical
Engineering 2007, 6681, (1), 66810D-1-66810D-66810D-18.
28. Hayward, I. P.; Kirkbride, T. E.; Batchelder, D. N.; Lacey, R. J., Use of a Fiber Optic
Probe for the Detection and Identification of Explosive Materials by
Raman-Spectroscopy. Journal of Forensic Sciences 1995, 40, (5), 883-884.
29. Sharma, S. P.; Lahiri, S. C., Absorption spectroscopic and FTIR studies on EDA
complexes between TNT (2,4,6-trinitrotoluene) with amines in DMSO and
determi-nation of the vertical electron affinity of TNT. Spectrochimica Acta Part a-Molecular
and Biomolecular Spectroscopy 2008, 70, (1), 144-153.
30. Brown, S. D.; Barker, T. Q.; Larivee, R. J.; Monfre, S. L.; Wilk, H. R., Chemometrics.
Analytical Chemistry 1988, 60, (12), R252-R273.
31. Modern Plastics World Encyclopedia. The McGraw-Hill Companies, Inc.: New York,
NY, 2000.
32. Plastics News. www.plasticsnews.com
33. Modern Plastics Encyclopedia. The McGraw-Hill Companies, Inc: New York, NY,
1999.
34. Ehrenstein, G. W., Polymeric Materials: Structure, Properties, Applications.
Han-swer Gardner Publications, Inc.: Cincinnati, Ohio, 2001.
35. Bustos, F.; Cassagnau, P.; Fulchiron, R., Effect of molecular architecture on
quies-cent and shear-induced crystallization of polyethylene. Journal of Polymer Science
36. Lal, S.; Grady, N. K.; Kundu, J.; Levin, C. S.; Lassiter, J. B.; Halas, N. J., Tailoring
plasmonic substrates for surface enhanced spectroscopies. Chemical Society Reviews
Chapter 2
Two-Dimensional Correlation Analysis for Explosive Detection
2.1 INTRODUCTION... II-2
2.2 EXPERIMENTAL METHODS ... II-6
2.2.1 Materials ... II-6
2.2.2 Raman Microspectroscopy... II-8 2.2.2.1 Contamination Studies ...II-8
2.2.3 Long Standoff Raman Spectroscopy... II-9
2.2.4 Computation... II-10
2.3 RESULTS ... II-14
2.3.1 Raman Microspectroscopy of Pure Compounds ... II-14 2.3.1.1 One-Dimensional Raman Spectra...II-14 2.3.1.2 Clean Two-Dimensional Correlation Spectra...II-15 2.3.1.3 Effect of Background in Two-Dimensional Correlation Spectra...II-19 2.3.1.4 Data Pretreatment...II-22 2.3.1.5 Reference Spectrum ...II-23
2.3.2 Raman Microspectroscopy: Contamination Studies ... II-24 2.3.2.1 Traditional: RDX and Saliva on Sand ...II-25 2.3.2.2 Multi-Point: RDX, Soot, Sand, Polybutadiene ...II-27 2.3.2.3 Multi-Sample: PETN, Soot, Polybutadiene ...II-29
2.3.3 Long Standoff Detection... II-32
2.4 DISCUSSION ... II-34
2.4.1 Application of 2D Correlation Analysis... II-34 2.4.1.1 Synchronous Spectra...II-36 2.4.1.2 Asynchronous Spectra...II-37 2.4.1.3 Data Pretreatments ...II-39
2.4.2 Fluorescence ... II-40
2.4.3 Raman Signal Enhancement... II-41
2.5 CONCLUSION ... II-42
2.6 ACKNOWLEDGEMENTS ... II-43
2.1
INTRODUCTION
Improvised Explosive Devices (IEDs) are currently the number one killer of both
troops and civilians in Iraq and Afghanistan.1 Furthermore, world-wide IED events
out-side Iraq and Afghanistan number over 300 per month.1 The ability to detect explosives
prior to detonation would save lives; hence many laboratory techniques have been
ex-plored for explosive detection and classification (see reviews by Moore, 20042 or
Stein-feld and Wormhoudt, 19983). With the exception of the human eye and canine units, the
most successful detection schemes are based on ion-mobility spectrometry,
gas-chromatography/mass spectrometry, and fluorescence quenching of polymers. These all
share the serious drawback of proximal sampling, which is extremely hazardous. An ideal
system should quickly and accurately identify the presence of a variety of explosive
traces in different environments with dynamic backgrounds at a safe standoff distance.
A possible solution to this complex problem is an optical-based scheme.2, 3
At-tempts have been made to utilize infrared (IR) spectroscopy,4 photodissociation
laser-induced fluorescence (PD-LIF),5-7 laser-induced breakdown spectroscopy (LIBS),8 and
terahertz time domain spectroscopy (THz-TDS).9 While well-suited for standoff detection,
not all of these techniques meet the additional challenges of low vapor pressure of
explo-sives and small sample size, as well as both optical and chemical interference – while
re-quiring no sample preparation. However, even those techniques that are able to meet the
challenges presented above suffer other serious drawbacks (for example, safety of
im-plementation).2-4, 10-12 This study focuses on a detection scheme based on long standoff
Raman spectra provide direct information about molecular structure that can
be used for identification. It is a non-invasive technique capable of analyzing both
or-ganic and inoror-ganic compounds in any state (solid, liquid, gas), in most environments and
without specific sample preparation requirements. The Raman Effect is the result of
ine-lastic scattering of light from molecules that is shifted in frequency due to specific
mo-lecular vibrations. When an incident photon induces a dipole moment within a molecule,
the result is a transfer of energy. If the molecule absorbs energy, the result is a photon
scattered with less energy than the incident photon, or Stokes scattering. If, on the other
hand, the molecule loses energy, the scattered photon will have greater energy and will be
part of Anti-Stokes scattering. Stokes lines have greater intensity than Anti-Stokes lines
at room temperature and are the focus of the current work.
The unique Raman signatures of many explosive materials are well known.15, 20-29
The challenge is in obtaining these spectra from a distance of a few to hundreds of meters.
Standoff systems often utilize a powerful, pulsed laser as the excitation source and a large
optic to collect scattered photons that are sent to a dispersive spectrograph. Recent
ad-vances in optical-based standoff detection schemes have stemmed primarily from
devel-opments in the instrumentation of the detection system.7, 11, 13, 14, 17-19, 30 However, long
standoff detection of trace explosives presents a number of difficult challenges associated
with rapid detection of a weak signal in a noisy and dynamic environment. Additional
at-tempts have been made to enhance detection of explosives by exploiting their unique
predisposition to decompose during heating.21, 31-36 Another possible approach to increase
the success of long standoff detection (based on any scheme) is through the analysis of
The system envisioned by Dr. Ravi Verma and Dr. Andrew Pipino at Tanner
Research Inc. (Monrovia, CA) combines these three factors (hardware, material
charac-teristics, and data analysis) to meet the challenges of long standoff Raman detection.
In-strument design and assembly have been conducted by Dr. Andrew Pipino and includes a
gated mechanism to minimize the amount of ambient light and luminescence that reaches
the detector.13, 30, 39 Once complete, the system would exploit the instability of explosives
during incremental heating, which can be induced from a long standoff distance using a
carbon dioxide (CO2) laser. The enhancement in detection achieved by employing
two-dimensional correlation spectroscopy is examined as part of this thesis. It was
hypothe-sized that peaks characteristic of specific explosives would decrease as the explosive
un-derwent thermal degradation while peaks corresponding to the decomposition products
would increase. Furthermore, many of the potential interfering compounds in the
operat-ing environment have sufficient thermal stability that they would not be affected by the
degree of heating used to induce thermal decomposition of energetic materials. The
com-pounds that change due to heating would be selectively retained in the two-dimensional
correlation spectra and the unchanged background would not contribute.
Two-dimensional (2D) correlation spectroscopy is a robust and versatile
tech-nique used to study molecular behavior as a function of a perturbation variable (e.g.,
temperature). Since its generalization by Noda,40 the analysis has been applied to a
vari-ety of measurements across different fields.41-49 Specifically, this analysis allows for
separation of spectral features corresponding to explosives both from a noisy background
and from any contaminants based on their rate of response to heating. Advantages of 2D
spectra by separation of overlapped peaks, (2) enhancement of spectral resolution
and enhancement of signal to noise ratio (SNR) through the spreading of peaks over a
second dimension, and (3) probing specific sequential order of spectral intensity
changes.50 In the current application, 2D correlation analysis should allow for rapid
dis-crimination between unstable explosive traces and more stable contaminants, as the
na-ture of the 2D approach is to eliminate static spectral feana-tures.
In this work, the concept of thermal decomposition in conjunction with 2D
corre-lation spectroscopy for the detection of trace explosives was initially examined using a
Raman microscope and a heating stage. Further investigations evaluated the two aspects
of the analysis that can be used to further enhance detection: data pre-treatment and
selec-tion of the reference spectrum.
Data-pretreatments, such as smoothing, averaging, or normalization, can greatly
enhance spectral features. In long standoff detection, a noisy background poses a
signifi-cant challenge. This background can negatively affect SNR of synchronous spectra and
sometimes produce artificial peaks in the asynchronous spectra.51 Proper background
subtraction is unrealistic due to the time-sensitive nature of the desired detection scheme,
so alternatives must be considered. The effect of background scattering can be minimized
through the use of first52 and second51 derivatives of the spectra. Alternatively, spectral
normalization can also be utilized to enhance spectral features. In many cases,
normaliza-tion schemes have little effect on qualitative results of 2D correlanormaliza-tion analysis.53, 54
How-ever, in some studies, implementation of a normalization scheme has resulted in artificial
peaks, especially in the asynchronous spectrum.55-57 Given that the pre-treatment is
correlation analysis may result in a significantly different SNR of the 2D spectra.
Since the ultimate goal is to identify explosives while minimizing the probably of false
negatives and false alarms, both derivates and a variety of normalization techniques were
examined for greatest enhancement of explosive features in the 2D synchronous plot
while minimizing the appearance of artificial peaks.
An additional variable in the 2D analysis that can be adjusted for better results is
the reference spectrum selected for calculating the dynamic spectra. The selection of this
reference spectrum is rather arbitrary;50, 58 a simple option is to use an individual
spec-trum from the dataset.47, 50, 58 Most commonly, the time-averaged (i.e.,
perturbation-averaged) spectrum is used, resulting in mean-centered dynamic spectra being analyzed.40,
44, 59, 60 Each of these options was tested for the current application to determine which
provided the best enhancement of explosive spectral features in the 2D synchronous plot,
similar to the normalization schemes.
While noise is considered the greatest challenge of standoff detection, the ability
t