Numerical simulation of rock fracture using three-dimensional extended
discrete element method
Yuya Matsuda1and Yasuyuki Iwase2
1Department of Earth and Planetary Systems Science, Graduate School of Science, Hiroshima University,
1-3-1 Kagamiyama, Higashi-Hiroshima 739-8526, Japan
2Department of Earth and Ocean Sciences, School of Applied Sciences, National Defense Academy,
1-10-20 Hashirimizu, Yokosuka 239-8686, Japan
(Received May 7, 2001; Revised February 4, 2002; Accepted February 4, 2002)
We perform three-dimensional numerical simulation of rock fracturing under uniaxial compression by extending the discrete element method (DEM). Rock sample is modeled as an assemblage of about four thousand spheres having the same radius. Each element satisfies equations of motion for both translation and rotation. In extension of the DEM, we assume cohesion between elements and constrained rotation of the elements; these assumptions are required to treat the continuum by the DEM. We study two cases of uniaxial compression tests: A homogeneous sample having an equal cohesion force between elements and heterogeneous sample having weak parts of cohesion in one percent of the total number of the bonds of elements. We present the detail of fracturing process of model rock samples and obtain stress-strain curve for each case. The homogeneous sample shows a cone-shaped fault system, whereas the heterogeneous sample shows complex fault system consisting of major and sub faults. We find that the inner stress and rotation of elements show the negative correlation during fracturing process. The results are in good agreement with both experimental and theoretical results.
1.
Introduction
Earth and the other terrestrial planets mainly consist of rocks. Physical properties, elastic-plastic deformations and fracturing, of rocks provide a clue to understand the forma-tion and evoluforma-tion of the planets. Fracturing of rock is con-sidered to be one of the most important processes for plane-tary dynamics and related to earthquake, orogeny, plate mo-tion, and so forth. Numerous theoretical studies in the view of dislocation, linear-elastic fracture mechanics (e.g., Knott, 1973; Weertman, 1996) and laboratory experiments (e.g.,
Vutukuriet al., 1974; Paterson, 1978) have been reported
fracturing behavior of rocks under stress. To the contrary, fracturing mechanisms of the rocks have not yet been well clarified by either experimental or theoretical studies for the following characteristics of the fracturing process: (1) ir-reversible, nonlinear, and nonequilibrium; (2) various spa-tial scales; (3) complex effect of inhomogeneity within the medium (e.g., Scholz, 1990).
Recent remarkable development in computer technology provides methods for studying rock fracturing by numeri-cal simulation, which can inherently control the entire me-chanical properties. Numerical simulations for continuum medium theory enable to predict locations of fracture (i.e., macroscopic approach). However, their demerit is the diffi-culty in solving the discontinuities such as faults requiring the utilization of complex functions (e.g., Bird and Kong,
1994; Wuet al., 1998). At a microscopic level, for example,
Copy right c The Society of Geomagnetism and Earth, Planetary and Space Sciences
(SGEPSS); The Seismological Society of Japan; The Volcanological Society of Japan; The Geodetic Society of Japan; The Japanese Society for Planetary Sciences.
by molecular dynamics (MD), such problem may be com-pletely solved in principle (e.g., Holland and Marder, 1998), though a huge amount of computer resources is needed for this approach.
As one of the mesoscopic approaches, the discrete (dis-tinct) element method (DEM) was developed by Cundall and Strack (1979). The fundamental concept of this method is simple: An object is considered to consist of elements, a discrete unit of material, and the equation of motion for each element is solved. The DEM has been employed in the analyses of geological structures, the movement of soil, and
others (Donz´e et al., 1994; Iwashita and Oda, 1998; Mora
and Place, 1998; Place and Mora, 1999) to show good agree-ments with observations and experimental results. Most of those simulations are, however, required to introduce com-plex mathematics due to the nature of elements or mecha-nisms of phenomena (Iwashita and Oda, 1998; Mora and Place, 1998; Place and Mora, 1999), furthermore are done under two-dimensional condition.
In this study, we extend the DEM under three-dimen-sional condition in order to model the fracturing processes of rock sample under uniaxial stress. The main advantage of numerical simulation is to observe the details of fracturing zone during rock deformation, which cannot be realized in laboratory experiments. On the basis of numerical simula-tion, we investigate the effect of weak part inside the rock on fracturing. Evolution of cracks and stress-strain relationship are also studied.
368 Y. MATSUDA AND Y. IWASE: NUMERICAL SIMULATION OF ROCK FRACTURE
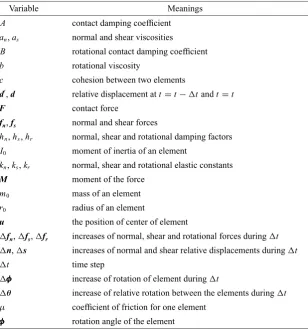
Table 1. List of symbols.
Variable Meanings
A contact damping coefficient
an,as normal and shear viscosities
B rotational contact damping coefficient
b rotational viscosity
c cohesion between two elements
d,d relative displacement att=t−tandt=t
F contact force
fn,fs normal and shear forces
hn,hs,hr normal, shear and rotational damping factors
I0 moment of inertia of an element
kn,ks,kr normal, shear and rotational elastic constants
M moment of the force
m0 mass of an element
r0 radius of an element
u the position of center of element
fn,fs,fr increases of normal, shear and rotational forces duringt
n,s increases of normal and shear relative displacements duringt
t time step
φφφ increase of rotation of element duringt
θ increase of relative rotation between the elements duringt
μ coefficient of friction for one element
φφφ rotation angle of the element
2.
Numerical Method
The DEM has been in fact used for studies of discon-tinuum media, such as granular soils (Cundall and Strack, 1979), i.e., a sand corresponds to an element. In order to consider the deformation and fracturing of rock, however, the DEM must be modified to be applicable for both con-tinuum and disconcon-tinuum media. We assume presence and absence of cohesion force between neighboring elements re-spectively for continuum and discontinuum. The evolutions of cracks and faults are interpreted as the movement of a number of elements, if the rock is modeled as an assem-blage of many elements. The outline of the DEM and our modification are described below.
Visco-elastic spherical elements with a radius,r0, mass,
m0, and moment of inertia,I0 (r0,m0 andI0are constants)
under consideration are assumed to be Voigt-Kelvin mate-rial. Thus, each element satisfies the following equations of motion;
m0u¨i+Aiu˙i+Fi =0, I0φφφ¨i+Biφφφ˙i+Mi=0,
(1)
where the subscripti refers to thei-th element; the number
of dots stands for the order of differentiation with respect
to time; Fi and Mi are, respectively, sum of the contact
forces and the moment of the force acting on thei-th element
from the neighboring elements; Ai and Bi are the contact
damping coefficients;uiis the position, andφφφiis the rotation
angle of the element i. Symbols used in this paper are
summarized in Table 1. The second and third terms in
Eq. (1) represent the viscous and the elastic or frictional forces, respectively. The solution given by numerical time integration provides the position and rotation angle of the element.
When elements i and j are connected or contacted, the
increase in the interaction forces between the elementsiand
jduring timet−t andt is calculated by the relative
dis-placements between each other (Fig. 1). The normal (n(i j))
and shear (s(i j)) components of the relative displacements
may be given by
The relative rotation between the elementsi and j during
t,θ(i j), is written by
θ(i j)=φφφj−φφφi. (6)
Using the equations above, the increases of the elastic force
on the elementifrom the element jis expressed by
r
0Fig. 1. A schematic concerning displacements of elements. Dashed and solid circles indicate the elements att=t−tandt=t, respectively.
where the subscriptsn,sandr refer to normal, tangential
and rotational directions, respectively,kn,ks andkr are the
elastic constants. In this study, we assume kn = ks and
kr =2r0ks(constant). Provided that elements are connected
to each other, no rotation occurs (θ(i j)=0).
Thus, the normal and tangential forces attare given by
fn(i j)(t)=fn(i j)(t−t)+fn(i j), (10) fs(i j)(t)=fs(i j)(t−t)+fs(i j)+fr(i j)/r0. (11) The failure of each connection is assumed to be deter-mined by the Coulomb-Mohr’s criterion given by
fs(i j) ≥c+μfn(i j), (12)
where fs(i j) and fn(i j) is the absolute values offs(i j) andfn(i j)
(compression; positive and extension; negative),
respec-tively;cis the cohesion, andμis the coefficient of friction.
Once Eq. (12) is satisfied, the connection between the
ele-mentsi andj is lost and will never be recovered.
When detached elements come into contact, a frictional force is also taken into account. The frictional force appears only when the predicted contact forces, without friction, cal-culated by Eqs. (10) and (11) satisfy the following inequal-ity,
fs(i j) ≥μfn(i j). (13)
Then, the elements are slipped and the virtual tangential force is restricted to
In our work, the linear viscous terms are present, only if there is any interaction among the elements. The viscous terms represent the resistance force against displacement,
making the simulation less microscopic and closer to
quasi-static process, which is appropriate for tectonic modeling.
The dynamic viscosities are assumed as
an=2hn m0kn, (15)
as=2hs m0ks, (16)
b=2hr m0r0kr/2, (17)
wherehx(x =n,s,r) is the damping factor (0≤ hx ≤1).
Whenhxis unity, critical damping takes place.
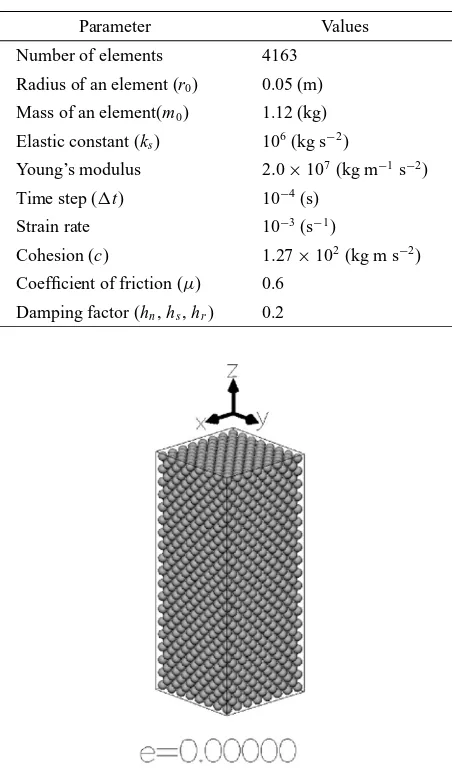
Table 2. Parameters used in the simulation.
Parameter Values
Coefficient of friction (μ) 0.6
Damping factor (hn,hs,hr) 0.2
370 Y. MATSUDA AND Y. IWASE: NUMERICAL SIMULATION OF ROCK FRACTURE
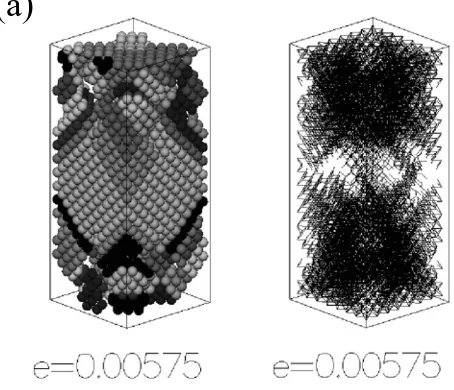
(a)
Fig. 3(a). Configuration of elements (left) and cracks (right) for case A after the fracturing (e=0.00575). In the left figure, the dislocated units consisting of more than four connected elements are shown by different color tones. In the right figure, the disconnection lines are drawn by lines connected the center of elements when elements are disconnected. Frame boxes indicate the initial shape of model rock.
(b)
Fig. 3(b). Configuration of elements (left) and cracks (right) for case B after the fracturing (e=0.00500).
The total elastic or frictional force and the total moment
acting oni-th element are respectively
Fi =
j,j=i
(fn(i j)+fs(i j)), (18)
Mi =
j,j=i r0 d
i j
|di j| ×fs(i j),
(19)
and the viscous terms are given by
Aiu˙i=
j,j=i
(ann(i j)+ass(i j)+bθ(i j))/t, (20)
Biφφφ˙i=
j,j=i
br0θ(i j)/t. (21)
Above calculations are performed for each element in
turn. The Verlet algorithm (Tuckermanet al., 1992) is used
for time integration in Eq. (1). The time step,t, is set to
be less than 2√m0/ks, to prevent generation of shock wave.
3.
Model
Before applying our code to complex geological structure, uniaxial compression of rock is simulated in this study. The uniaxial compression experiment is one of the basic tests of rock deformation and fracture (Paterson, 1978) and the numerical simulation should be compared with the experi-mental results. Parameters and physical properties used in this study are listed in Table 2.
Two cases (cases A and B) are studied. In both cases the model rock consists of about four thousands spherical ele-ments (Fig. 2). The shape of model rock sample is a rectan-gular parallelepiped with an aspect ratio of 1:1:2.5, in which
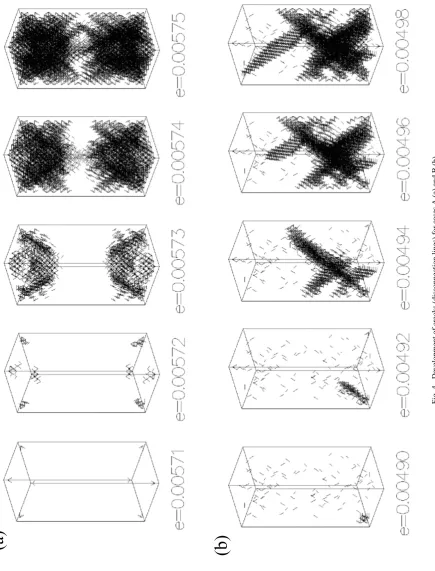
(a)
(b)
Fig.
4.
De
v
elopment
of
cracks
(disconnection
lines)
for
cases
A
(a)
and
B
372 Y. MATSUDA AND Y. IWASE: NUMERICAL SIMULATION OF ROCK FRACTURE
(a)
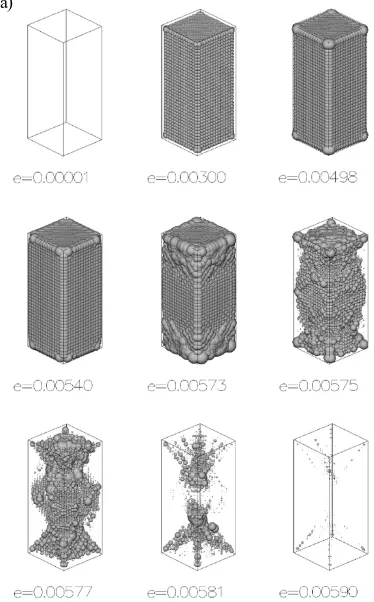
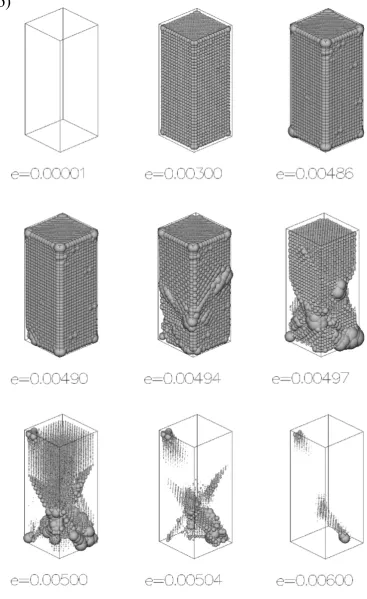
Fig. 5. Development of stress sphere for case A (a) and B (b). The radii of sphere indicate the size of normal force (fn) for each element in contact or
connection.
For the convenience of description, we set thex-,y-, andz
-axes parallel to edges of the sample, as shown in Fig. 2. We assume that the neighboring elements are initially connected
and all the elements have zero rotational angle (φφφi = 0).
(b)
Fig. 5. (continued).
the fracture due to the symmetry of thefccconfiguration of elements, the cohesion,c, of random selected connections of elements (one percent of the total connections) are re-duced by a factor of 0–1, whereas homogeneous cohesion is used for case A. The model rocks are pressed with a
374 Y. MATSUDA AND Y. IWASE: NUMERICAL SIMULATION OF ROCK FRACTURE
(a)
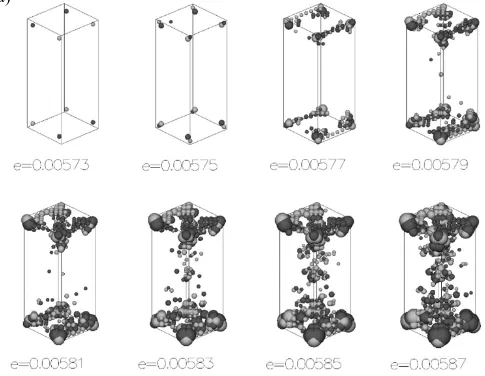
Fig. 6. Development of rotation sphere of case A (a) and B (b). The radii of sphere indicate the angle of rotation (φ) for each element onx-axis. Light gray denotes clockwise rotation and dark gray denotes counterclockwise rotation.
4.
Results and Discussion
4.1 Fracturing processFigures 3(a) and (b) show the configuration of elements
after fracture for case A (e=0.00575;t =5.75 s) and for
case B (e =0.00500;t =5.00 s), respectively. The
dislo-cated units consisting of more than four connected elements are shown by different color tones (left) and the disconnec-tion lines (right); the disconnecdisconnec-tion lines tie between the centers of the two elements in disconnection. The discon-nection line may be interpreted as cracking or microfailure. The fracture zone, that is, the zone where the distribution of the disconnection lines is dense, appears cone-shaped for the case A and oblique for the case B. Note that downward dropping of fragments is not observed because of zero grav-ity assumed.
Evolution of disconnection lines is shown as a function of time in Figs. 4(a) and (b) for cases A and B, respectively. For case A, cracking begins at the edges of both the upper and lower corners and propagates toward the center of the rock
sample. This process occurs within a short time (<0.05 s)
and the corresponding strain, e, is 0.00571–0.00575. For
case B, although the failure first occurs at the connections
where the cohesion is reduced, the major fracturing initi-ates at a corner, propaginiti-ates toward the central part, and re-sults in the coalescences of cracks. As shown in Figs. 3(a) and 4(a), in the homogeneous sample (case A), the fracture zone becomes cone-shaped which is consistent with the the-oretically predicted weak zone of rocks (Bordia, 1971). In contrast to the case A, a complex system of fracturing sur-face consisting of major faults and sub faults appears in the heterogeneous sample (case B; Figs. 3(b) and 4(b)). Both patterns of fracturing surfaces are observed in laboratory ex-periments (Lama, 1966; Paterson, 1978), suggesting that the fracture pattern is controlled by the distribution of strength inside the rock.
4.2 Stress distribution
The pattern of fracturing surfaces has been considered to be determined by the distribution of microfailure and lo-calization of stress concentration around cracks (Paterson,
1978). Stress distribution inside the rock are shown in
Figs. 5(a) and (b). The size of spheres shown in Figs. 5(a) and (b) is proportional to the magnitude of normal stress,
or normal force acting among the elements in contact, fn.
(b)
Fig. 6. (continued).
in proportion to the strain (e < 0.00300), indicating
elas-tic deformation. However, the stress concentrates gradually on the edges of model rock sample, especially the corners
(e ∼ 0.00498). As we assume the friction on the top and
bottom surfaces, radial compression stresses develop from near surfaces of both sides in a similar way to deformation
experiments (Vutukuriet al., 1974). When the cracking
oc-curs, the spheres first disappear, i.e., lose the connection, at the corners, and then, the release of normal stress
propa-gates to inside of the rock (e∼0.00540–0.00581), with
si-multaneous propagation of cracking, that is, fracturing. Ar-eas of stress accumulation are almost coincident with the areas of stress concentration predicted by the Griffith the-ory (Hawkes and Mellor, 1970). After the instantaneous crack propagation, the stress is almost completely mitigated
(e∼0.00590). For case B, the inner stress increases inside
the rock similar to that in case A untile ∼0.00300. After
e ∼ 0.00490, the stress concentrates in some parts of the
rock sample. However, fracturing occurs from the surface and propagates into the inner part of the sample. The stress accumulation is found near the fracturing surface after
frac-ture, at least tille∼0.00600.
Figures 6(a) and (b) illustrate the increment of the
rota-tion angle of elements. The size of spheres is proporrota-tional to
the rotation angle around thex-axis and the colors indicate
the direction (clockwise; light gray and counterclockwise; dark gray). Elements rotate largely near the corner and ad-joining elements rotate in the opposite direction each other. The rotation of elements tends to be larger on the fracturing surfaces, especially for case B (Fig. 6(b)). The largest rota-tion angle becomes 20–30 degrees during stress drop. Af-ter breaking connections, the elements are allowed to rotate freely and a part of elastic energy may be transferred into rotation energy of elements. These free rotatable elements may correspond to the gouge and their rotation results in movement of the rock units, i.e., faulting, accompanying the fracture, smoother (Scott, 1996).
Figures 7(a) and (b) show the relationship between
nor-mal (fn) and tangential (fs) forces (proportional to stresses)
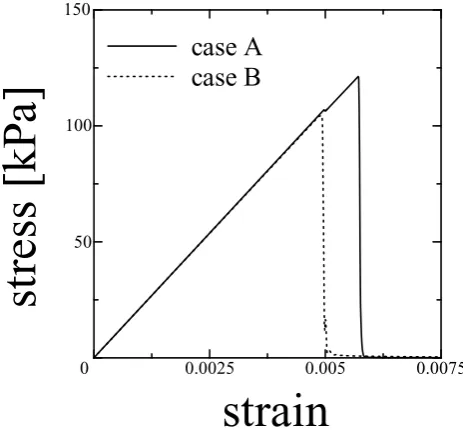
strain
Fig. 8. Stress-strain curves for cases A (solid line) and B (broken line). The vertical stress on the top surface (vertical axis) and the strain along axis (horizontal axis) are shown.
ear relationship between fn and fs can be seen. This trend
is weak for case A compared with case B. This can be ex-plained by the fact that the flat fracturing surface in case B is smoother than the cone-shaped fracturing surface in case A in this condition (see, Fig. 4(b)). The result of case A suggests that the roughness of fracturing surface may act as fault asperity (Scholz, 1990) and may cause concentration of normal stress after fracturing (see, also Fig. 5(a)). 4.3 Stress-strain relationship
Figure 8 shows the relationship between axial strain and stress for cases A and B. All compression axes are in the vertical direction at the ends of model rock sample. The ax-ial stress is calculated from dividing the summation of the force of each element by the upper surface area. A stress
drop occurs ate ∼ 0.00572 for case A ande ∼ 0.00492
for case B. The stress-strain curves show abrupt transitions from the elastic regime to the brittle regime during the frac-turing process, which is generally observed in the short term uniaxial compression tests in the laboratory (e.g., Wawersik and Brace, 1971). The peak stresses, which indicate the strength of whole rock, are an order of 100 kPa for both cases. Young’s moduli of rocks forming the crust and
up-per mantle (∼109 ∼1010kg m−1s−2) are 100–1000 times
larger than that used in this study (∼107kg m−1s−2). Thus,
the peak stresses in our results (∼105 Pa) would be about
1/1000 of those for natural rocks (∼108Pa) (Wawersik and
Brace, 1971). The strength in case B is about ten percents smaller than that in case A, although the averaged cohe-sion force per connection in case B is 0.5 percent smaller than that in case A. This result implies that the macroscopic fractures are determined by the interference and linkage of cracks generated at the weak part.
5.
Concluding Remarks
In this study, rock fracturing is modeled on basis of the
discrete element method, in which rock is assumed as an assemblage of spherical discrete elements obeying New-ton’s equations of motion of both translation and rotation. Cohesion force is newly considered between connected el-ements for treatment of continuum-discontinuum media. This method is useful to describe the fracturing due to the inherent discretization of model and can also treat the elas-tic bodies.
Numerical experiments of uniaxial compression of rocks using our model to study the brittle behavior show some in-teresting features. The cracking initiates at the edge(s) of rock sample and propagates inside. The surfaces of the frac-ture are cone-shaped for the rock with initially symmetric
fcc configuration (case A), and oblique if connections
be-tween the elements are randomly reduced (case B). The latter case, especially, shows the remarkable localization of deformation along the shear zone. The stress distribution inside the rock and the rotation of elements are also demon-strated. The existence of defective connections yields the lo-calization of the stress. Negative correlation between the in-ner stress and rotation of elements is found. The stress-strain curves also show a good agreement with those observed in experimental uniaxial compression tests (e.g., Wawersik and Brace, 1971). After the instantaneous crack propagation, the stress inside the rock is almost completely mitigated by the fracturing. The results in our model is also consistent with theoretical works of the rock fracture (e.g., Hawkes and Mellor, 1970; Bordia, 1971). The patterns of the sur-face of the fracture show an agreement with those observed
in the laboratory experiments (e.g., Lama, 1966; Vutukuriet
al., 1974; Paterson, 1978), though their feature changes by
introducing only one percent weak connections inside the rock. This results suggest that the fracture pattern is con-trolled by the heterogeneity of strength within rock.
In the present model, number of elements is at least
∼4×10³and the Young’s modulus is smaller than those of
the natural rocks by the limitation of computer facilities. As the movements of elements given by uniaxial compression
(∼10−3m s−1) are much smaller compared to the
propaga-tion velocity of cracks, the qualitative results including frac-ture pattern would be valid to the natural rocks. However, the use of the parameters comparable to the natural rocks and increase in the number of elements will be necessary for further quantitative investigation. Besides, we may need to adopt the variation of the radii of elements for smoothing the surface of fracture. Thermal effects should be also incor-porated, if the scheme is applied to larger scale simulations such as the tectonic models.
Acknowledgments. We are grateful to Prof. S. Honda and two anonymous reviewers for insightful comments and a better per-spective of our work. The comments of Drs. N. Suda and T. Nakakuki are most helpful. We also thank Ms. R. Yokochi and an anonymous reviewer for correcting the English which improved the manuscript. Runs of this research were mainly made on comput-ers of Institute for Nonlinear Sciences and Applied Mathematics (INSAM) in Hiroshima University.
References
378 Y. MATSUDA AND Y. IWASE: NUMERICAL SIMULATION OF ROCK FRACTURE
1994.
Bordia, S. K., The effects of size and stress concentration on the dilatancy and fracture of rock,Int. J. Rock Mech. Min. Sci.,8, 629–640, 1971. Cundall, P. A. and O. D. L. Strack, A discrete numerical model for granular
assemblies,G´eotechnique,29, 47–65, 1979.
Donz´e, F., P. Mora, and S. A. Magnier, Numerical simulation of faults and shear zones,Geophys. J. Int.,116, 46–52, 1994.
Hawkes, I. and M. Mellor, Uniaxial testing in rock mechanics laboratories,
Eng. Geol.,4, 177–285, 1970.
Holland, D. and M. Marder, Ideal brittle fracture of silicon studied with molecular dynamics,Phys. Rev. Lett.,80, 746–749, 1998.
Iwashita, K. and M. Oda, Rolling resistance at contacts in simulation of shear band development by DEM,J. Engrg. Mech., ASCE124(3), 285– 292, 1998.
Knott, J. F.,Fundamentals of Fracture Mechanics, 273 pp., Butterworth, London, 1973.
Lama, R. D., Elasticity and strength of coal seams in situ and an attempt to determine the energy in pressure bursting of roadsides, D. Sc. Tech. Thesis, Faculty of Mining, Academy of Min. & Metall., Cracow, Poland, 1966.
Mora, P. and D. Place, Numerical simulation of earthquake faults with gouge: toward a comprehensive explanation for the heat flow paradox,
J. Geophys. Res.,103(B9), 21067–21089, 1998.
Paterson, M. S., Experimental Rock Deformation—the Brittle Field,
254 pp., Springer-Verlag, Berlin, 1978.
Place, D. and P. Mora, The lattice solid model to simulate the physics of rocks and earthquakes: Incorporation of friction,J. Comp. Phys.,150, 373–393, 1999.
Scholz, C. H.,The Mechanics of Earthquakes and Faulting, 439 pp., Cam-bridge Univ. Press, New York, 1990.
Scott, D. R., Seismicity and stress rotation in a granular model of the brittle crust,Nature,381, 592–595, 1996.
Tuckerman, M., B. J. Berne, and G. J. Martya, Reversible multiple time scale molecular dynamics,J. Chem. Phys.,97, 1990–2001, 1992. Vutukuri, V. S., R. D. Lama, and S. S. Saluja,Handbook on Mechanical
Properties of Rocks: Testing Techniques and Results, 300 pp., Trans Tech Publications, Clausthal, 1974.
Wawersik, W. R. and W. F. Brace, Post-failure behavior of a granite and a diabase,Rock Mech.,3, 61–85, 1971.
Weertman, J.,Dislocation Based Fracture Mechanics, 524 pp., World Sci-entific, Singapore, 1996.
Wu, Z., A. Machida, and D. Gao, Development of mixed finite element method for composite discontinuous analysis,J. Geotech. Engrg.,598 (I-44), 149–159, 1998.