Haijiang Wang
1,2, Jingpu Wang
3*, Hai Jin
2, Lihong Li
1, Dongli Jia
1, Yongqiang Ma
1, Yongmei Liu
4, Fuqi Yao
5and Qinke Yang
4Abstract
This article proposes high-order balanced multi-band multiwavelet packet transforms for denoising remote sensing images. First, properties of several wavelet transforms and their relationships are analyzed. The article then presents theoretical principles and a fast algorithm for constructing high-order balanced multi-band multiwavelet packet transforms. The remote sensing image denoising method based on this transform scheme is then described, and its utility is demonstrated by illustrative results of its application to denoise remote sensing images. The method provides clear improvements in denoising quality, due to the balanced order or band number, consistently outperforming traditional wavelet transform-based methods in terms of both visual quality and evaluation indicators. The method also incurs reasonable computational costs compared with the traditional methods.
Keywords:Remote sensing image, Denoising, Multiwavelet packet transform, Multi-band, Balanced
1 Introduction
Remote sensing imaging has become a powerful technique for exploring and obtaining knowledge of numerous phe-nomena. However, during acquisition and transmission processes, the images are often contaminated by noise, which impairs their visual quality and limits the precision of subsequent processing steps, such as classification, tar-get detection, and environmental monitoring. Thus, re-mote sensing image denoising applications have attracted growing interest. Transform domain denoising methods have shown remarkable success in the last decade. An as-sumption typically underlying these methods is that signal can be sparsely represented in the transform domain. Hence, by preserving the few high-magnitude transform coefficients that convey most of the true signal energy and discarding the rest, which are mainly due to noise, the true signal can be effectively estimated. The sparsity of the representation depends on both the transform used and the true signal’s properties [1, 2].
The wavelet transform (i.e., 2-band scalar wavelet transform) can provide good sparsity for spatially lo-calized details, and a number of advanced denoising methods based on them have been developed [2–4]. For example, the wavelet thresholding approach popularized by Donoho is now widely used in scientific and engineering applications [2]. The best image denoising systems include filters with symmetric and compact-support properties, which can effectively extract features and eliminate arti-facts. Unfortunately, however, no nontrivial, symmetric, compact-support, orthogonal scalar wavelet transforms are available [1, 5].
Multiwavelet transforms (i.e., 2-band multiwavelet transforms or 2-band MWTs) have several advantages over scalar wavelet transforms, because they can simultan-eously possess all the above properties [5, 6]. Since these properties are highly significant in image processing, mul-tiwavelets have attracted considerable research interest and shown superior denoising performance over scalar wavelets in various studies [6–10] (see the diagram about the development of wavelet transforms in Fig. 1). Sveinsson et al. [11] and Wang et al. [12] applied 2-band MWT in remote sensing image denoising and found that they generally outperform 2-band scalar wavelet transforms
* Correspondence:[email protected]
3School of Resources and Environmental Engineering, Ludong University,
Yantai 264025, People’s Republic of China
Full list of author information is available at the end of the article
in both visual quality and objective evaluation. Further im-provements of 2-band MWT could potentially be obtained by taking into account the properties of the signal to be an-alyzed, but all the cited transforms use the unchangeable transform pattern for diverse images. That is, as illustrated in Fig. 2a, the decomposition at each decomposition level is only applied to the low-frequency component of signals and does nothing to the other, relatively high-frequency components, although this partitioning is not suitable for all signals with different behaviors across the frequency domain [1, 13].
Multiwavelet packet transforms (i.e., 2-band multiwave-let packet transforms or 2-band MWPT), as one extension of 2-band MWT, provide an effective mean to select a suitable decomposition pattern corresponding to an analyzed signal. As shown in Fig. 2b, a 2-band MWPT offers a finer frequency domain partition than a 2-band MWT, especially in the high-frequency domain. Hence, numerous subsets corresponding to different multiwavelet bases (or packets) can be found in its partition point set, one of which will match the properties of the analyzed signals better than all the others. The 2-band MWPT based on this subset (the best packet) can provide a better sparse representation of the signal than those based on other subsets (including the 2-band MWT, as the sub-set it uses is just one of these subsub-sets) [1, 13]. Martin et al. [14] and Wang [15] introduced 2-band MWPTs to
image compression and texture segmentation, respect-ively, and showed that they exhibit performance generally superior to 2-band MWT. Liu et al. proposed a choice al-gorithm of the best multiwavelet packet and found that the 2-MWPT based on the algorithm can generally obtain better denoising result than 2-band MWT at the same condition [16]. Developing a 2-band MWT scheme into its “packet” version is an effective way to improve per-formance (as shown in Fig. 1), however, the problem of balanced or high-order balanced must be addressed when using them in practical applications.
The balanced order ρ of a multiwavelet system corre-sponds to its ability to represent images sparsely [17, 18]. Recent studies show that the 2-band MWTs based on bal-anced (ρ= 1) multiwavelets (i.e., balanced 2-band MWT, as shown in Fig. 1) consistently outperform those based on unbalanced (ρ= 0) counterparts (i.e., 2-band MWT) in image denoising [19–22]. Also, balanced 2-band MWPT schemes derived by developing the balanced 2-band MWT into“packet”versions also consistently outperform (unbal-anced) 2-band MWPT in seismic data compression and denoising [23]. However, there have been no published in-depth studies on the relationship between the balanced orderρand sparse representation ability of balanced (ρ= 1) or high-order balanced (ρ> 1) 2-band MWPT (or even MWT). More importantly, although the 2-band MWPTs overcome many shortcomings of wavelet transforms, they
Fig. 1Development of wavelet transforms and relationships among different kinds of wavelet transform schemes. The transform schemes marked withlight green colorare compared with our proposed scheme (withlight blue color) in our evaluation experiment of denoising performance
Fig. 2The ideal frequency domain portioning patterns offered by different multiwavelet transforms with normalized highest frequency, taking M = 3 andk= 3 (krefers to a decomposition level) as an example.aFor a 2-band multiwavelet transform, the ideal partition points are only in the set {1/2, 1/22,⋯, 1/2k}.bFor a 2-band multiwavelet packet transform, they are in the set {1/2k, 2/2k,⋯, 2k−1/2k}.cFor an M-band multiwavelet transform,
they are in the set∪k
i¼1 1=Mi;2=Mi;⋯;M−1=Mi
.dFor an M-band multiwavelet packet transform, they are extended to the set {1/Mk, 2/Mk,⋯,
retain the “2-band” weakness of the latter, especially in spatial-frequency tiling, which has triggered great interest in their extension [1].
As another extension of 2-band MWT, M-band (M∈ ℤ and M > 2) MWTs provide greater flexibility in spatial-frequency tiling and more robust sparse representation [1, 24] (see Fig. 1). As shown in Fig. 2c, the ideal partition point set of an M-band MWT is denser than that of a 2-band counterpart (see Fig. 2a). M-band MWT has been shown to outperform 2-band MWT in terms of both visual quality and objective indicators in image fusion [25]. Similarly, high-order balanced M-band MWTs reportedly outperform (un-balanced) M-band MWT in image compression [26]. Poten-tially, a high-order balanced M-band MWT may also be further improved (like a 2-band counterpart) by using a “packet”version (i.e., an M-band MWPT, as shown in Fig. 1). As shown by the theoretical partition pattern of an M-band MWPT in Fig. 2d, it may provide a finer partitioning pattern and better matching subset (or more effective representa-tion) for an analyzed signal, relative to a 2-band counterpart. M-band MWPTs may offer great potential for image pro-cessing, but substantial extension of both their fundamental theory and convenient methodology are required. Thus, here we present basic principles of, and fast algorithms for, order balanced M-band MWPT by developing the high-order balanced M-band MWT presented in [26], according to key theory of developing balanced 2-band MWT into “packet” versions presented in [23]. We also evaluate their performance in remote sensing image denoising in comparison with the 2-band MWPT presented in [14–16], the balanced 2-band MWPT in [23], the
M-band MWT in [25], and the high-order balanced M-M-band MWT in [26] (see Fig. 1). Moreover, we systematically analyze the impact of the balanced orderρand band num-berMon the sparse representation ability of MWPT.
The rest of the paper is organized as follows. In Section 2, we analyze the basic principles and fast algorithm of high-order balanced M-band MWPT based on the relative the-ory of M-band MWT. In Section 3, we present the denois-ing method based on the proposed transform, and evaluate the denoising performance of the method by using both synthetic and real noisy remote sensing images in compari-son with the method based on the transforms recently pro-posed. We also analyze the impacts of the balanced order ρand band number M on their denoising performance. We summarize and discuss the work in Section 4.
2 High-order balanced M-band multiwavelet packet transforms
Classical wavelet transforms cannot provide many key properties simultaneously, as they establish a multi-resolution analysis frame using a single scale function [1, 5, 6]. In contrast, multiwavelet transforms user(r∈ℤ and r> 1) scale functions (r-multiplicity) for this work, thus reducing the number of constraint conditions and increasing the freedom in design. Therscale func-tions are denoted in vector form, i.e.,Φ0(t) = [ϕ0,0,ϕ1,0,⋯,
ϕr−1,0]. An M-band r-multiplicity multiwavelet system
has M-1 wavelet function vectors denoted as Φi(t) = [ϕ0,i,
ϕ1,i,⋯,ϕr−1,i] (1≤i< M). If (and only if) such a system is
orthogonal, theΦi(t) meets the following condition [24, 26],
Fig. 3Library of M-band multiwavelet packet basis functions, in 3-level decomposition
ΦiðxÞ ¼ ffiffiffiffiffiM
p X
n∈ZPiðnÞΦ0ðMx−nÞ: ð1Þ
Here,Pi(n) is a vector filter bank ofr×randn∈ℤ(the same as below). We can get the following M-band multi-wavelet transform algorithm after developing the corre-sponding algorithm of the classical wavelet transform (i.e., Mallat algorithm) [24, 26],
Cðkþ1Þ is anr-dimensional vector (the same as below).
A multiwavelet system is said to be balanced of order ρ if its lowpass and highpass filters preserve and cancel, respectively, all the monomial polynomial signals of order less than ρ. The order of a multiwavelet system corresponds to its ability to effectively represent the in-formation of the macroscale change trend and local tex-tures of a signal [17, 18]. If Pi(n) meets the constraint condition corresponding to each property above (e.g., ρ-order balanced, orthogonality), the balanced or high-order balanced M-band MWPT could be constructed by developing the above M-band multiwavelet transform algorithm. Their basic principles and fast algorithms are present as follows.
M-fold rescaling and translation of these functions yield a function library χ¼ fΨðlkÞ¼M−k=2ΨlðM−kx−nÞg (0≤l<
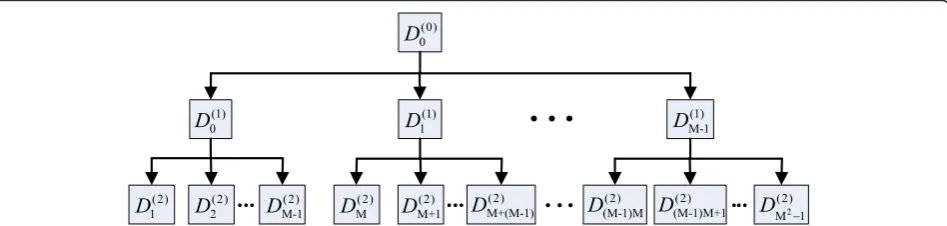
Mk). As shown in Fig. 3, the library can be viewed in terms of an M-fold complete tree, and thelth function at thekth decomposition level Ψð Þlk yields M functions at thek+ 1 level, i.e.,ΨðMkþlþ1iÞ(0≤i< M).
The library is overcomplete, and many complete orthog-onal basis sets can be found by properly selecting different subsets in the library with an appropriate parameter set {k,
l}.. A complete orthogonal basis set corresponds to a kind of multiwavelet packet transform scheme, a subset of the li-brary and a parameter set {k,l}.. Each subset can be viewed in terms of an M-fold tree structure. Examples of possible basis sets are shown in the trees in Fig. 4. The tree in Fig. 4a selects the subset of the library with the parameter set {1≤l< M, 0≤k< 3}∪{0≤l< M,k= 3} and corresponds to the standard M-band multiwavelet decomposition scheme [5, 6, 24]. The tree in Fig. 4d selects the subset with the parameter set {0≤l< Mk−1,k= 3} and corresponds to a kind of multiwavelet decomposition scheme that presents the finest frequency domain partition.
Fig. 5The decomposition and reconstruction of the M-band multiwavelet packet transform
For any analyzed dataset, there is a basis set (the best basis set) that can best represent the spatial and frequency domain information in the dataset, and the corresponding “best”multiwavelet packet transform provides the most ef-fective representation of the dataset (denoted as MWPT at below). The best basis set is found by using a cost function searching algorithm that seeks the best subset for some ap-plication in a set with tree structure [1, 13]. For example, a searching algorithm that uses information entropy as a cost function can find the most informative basis subset and consistently perform effectively in image denoising [1, 13]. Since the overcomplete library of the basis sets generated by the high-order balanced M-band multiwavelet packet transform can also be viewed in terms of a tree structure, we used entropic cost function searching algorithms to find both the best basis set corresponding to test datasets and for establishing the searching algorithm.
2.2 Fast algorithm
Defining Dði0Þ¼Cið0Þð0≤i<MÞ; a fast algorithm for de-composition of the M-band multiwavelet packet trans-form is shown in Eq. (5). Reconstructions are the inverse process of decompositions, and its fast algorithm is shown in Eq. (6). Based on the expression, its clear pro-cedures in Z transform domain are illustrated in Fig. 5, wherePi(z) is the Z transformation ofPi(n).
Dðkþ1Þ
Mlþið Þ ¼n
ffiffiffiffiffi
M
p X
m∈ℤPið ÞDm
k
ð Þ
l ðMnþmÞ ð5Þ
Dð Þlkð Þ ¼m pffiffiffiffiffiMXMi¼‐01Xn∈ℤPið ÞDn ðMlkþþ1iÞðMnþmÞ
ð6Þ
Using the decomposition algorithm above, one can ob-tain a complete M-fold tree including information on all
Fig. 7Illustrative results of (1-level) decomposition by the M-band multiwavelet packet transform of a remote sensing image, with M = 2 (a), 3 (b), and 4 (c)
its nodes DðlkÞð1≤l<MkÞ; as shown in Fig. 6. Dð Þlk are multiwavelet domain coefficients containing spatial infor-mation of the included frequency bands (see Fig. 2d). After decompositions, we can use the cost function-searching
algorithm to find the best basis set Dð Þlk
n o
among all the possible basis sets, which can represent the spatial and fre-quency domain information of the analyzed dataset more effectively than all other basis sets. Use of this best basis set-based multiwavelet packet transform in image process-ing applications should provide optimal quality results.
Information on the root nodeDð Þ00 in the tree illustrated in Fig. 6 can be obtained byr-dimensional vectorization of the analyzed datasets. Using the balanced or high-order balanced M-band multiwavelet system, this vectorization procedure can be simplified as an r-fold downsampling process, demonstrated as follows. Defining the analyzed signal as S= [s1,s2,…sN−1]T,S should be periodically
extended until N=⌈N/r⌉×r if N mod r≠0. Then, the extendedS should be vectorized as anr× (N/r) matrix,
i.e., Dð Þ00 ¼ Dð Þ00ð Þ0 ;D0ð Þ0ð Þ1 ;…;Dð Þ00ðr−1Þ
h iT
; where Dð Þ00
j
ð Þ ¼s0rþj;s1rþj;…;sðN=r−1Þrþj and 0≤j<r. After
establishing Dð Þ00 with the vectorization process, Dð Þlk at each level can be calculated by repeatedly performing the decomposition process in Eq. (5). Figure 7 shows illustrative results of decomposition by the M-band multiwavelet packet transform of a remote sensing image. As can be seen, numbers of transform domain coefficients in different cases of M are the same as all the transforms are orthogonal.
As shown in Fig. 5, the fast algorithm of the proposed high-order balanced M-band MWPT mainly consists of convolutions and subsampling processes and is very similar to the Mallat algorithm generally used in classical wavelet transforms.
denoising performance of our transform and other traditional wavelet transforms. First, we applied the proposed MWPT for multiscale decomposition of noisy images then used soft thresholding to shrink the transform domain coefficients [2]. The threshold (uni-versally) used was T ¼σpffiffiffiffiffiffiffiffiffiffiffiffiffiffiffiffiffiffiffiffiffi2 lnð ÞN , where N is the number of pixels in the original image, and σ is the variance of an additive noise, which may be un-known. If so, we used a robust median estimator σ^ of σ, computed from the multiwavelet coefficients of high-pass subband at scale k= 1 as shown in Eq. (7).
the performance of the proposed high-order balanced MWPT-based denoising method. The high-order balanced M-band multiwavelet systems constructed in [26] were used here to construct our transform (i.e., MWPT with M > 2 and ρ> 0). We compared the denoising perform-ance of our transform with those of the MWPT schemes proposed in recently relevant works, including the 2-band MWPT proposed by Liu et al. [16] (MWPT with M = 2 and ρ= 0), the balanced 2-band MWPT proposed by He et al. [23] (MWPT with M = 2 andρ> 0), and the M-band MWT proposed by Ren et al. [25]. Using the algorithms in
Section 2, the M-band MWT was developed into M-band MWPT (MWPT with M > 2 and ρ= 0) here for a fair comparison. The denoising strategies applied in these ap-proaches are the same as those described in Section 3.1, apart from minor differences in the transforms per se.
3.2.1 Synthetic noisy data-based analysis
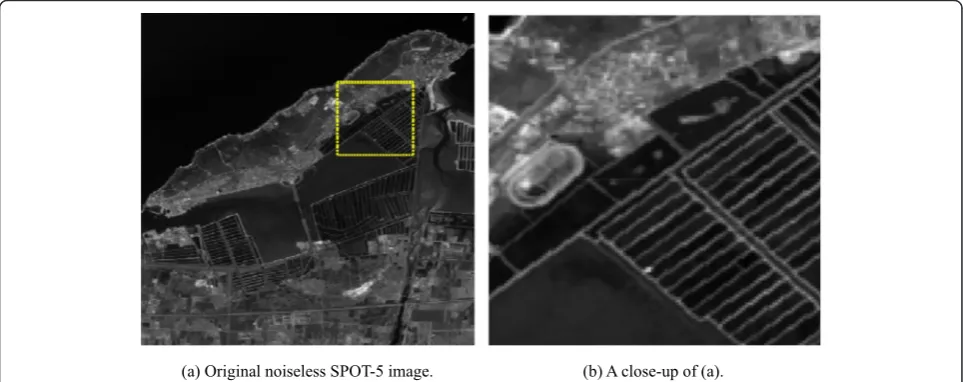
Various remote sensing images were used as original noiseless images for generating the synthetic noisy im-ages. One of the test images is shown in Fig. 8a. This image, collected from the panchromatic band of the SPOT-5 satellite, covers an area in Yantai, China. As seen, it includes rich textures and edges. Figure 8b displays a close-up of the image and shows the details of its textures.
To test the denoising performance to different pat-terns of noise attack, four kinds of noise are mixed with the original images as follows.
Pattern A:multiplicative noise. Multiplicative noise is
added to the original noiseless imageIwith the
equationJ=I+V×I, whereVis uniformly distributed random noise with zero mean and variance 0.1.
Pattern B:salt and pepper noise. Salt and pepper noise
is added to the original noiseless imageIwith the noise density equals to 0.2.
Pattern C:Gaussian white noise. Gaussian white noise
is added to the original noiseless imageIwith zero mean and variance 5.
Pattern D:Poisson noise. Poisson noise is generated
from the image itself instead of adding artificial noise to the original noiseless imageI.
Results obtained with all the test images are similar. Thus, results obtained using the image in Fig. 8a are presented here to illustrate the denoising performance of the test methods. In the following figures, we display the denoising results of MWPT-based methods with typical cases of (M,ρ), including those with (M,ρ) equal to (2,0), (4,0), (2,3), and (4,2) (as proposed in [16, 23, 25] and this work).
A. Visual quality analysis
As it is difficult to distinguish differences among the denoising images obtained using the tested methods at entire-image scale, we will consider the enlarged parts of the images obtained for the four noise patterns shown in
Figs. 9, 10, 11, and 12. In each case, the part covered is that shown in Fig. 8.
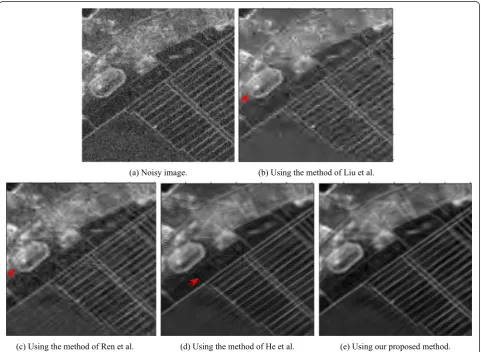
Figure 9 shows comparative close-ups when the ori-ginal image is subjected to pattern A noise. As displayed in Fig. 9a, the image to be denoised is seriously contami-nated by the multiplicative noise, compared with the
Fig. 12Close-ups of the same part of the noisy image (a) and relevant denoising results (b–e), when mixing the original image in Fig. 8a with pattern D noise
Table 1Denoising indicator results obtained by applying all the test methods to denoise the above used image corrupted by different noise patterns
Noise patterns Indicators Noisy image Method of Liu et al. Method of Ren et al. Method of He et al. Method of our proposed method
Pattern A PSNR 22.877 23.086 23.512 23.872 24.489
SSIM 0.609 0.682 0.694 0.708 0.711
Pattern B PSNR 15.651 18.466 19.043 19.630 21.632
SSIM 0.427 0.523 0.552 0.547 0.602
Pattern C PSNR 34.203 35.094 35.581 35.922 36.580
SSIM 0.892 0.926 0.949 0.938 0.972
Pattern D PSNR 28.476 29.754 30.741 30.293 31.602
noiseless counterpart in Fig. 8b. Figure 9b, c shows that although the methods of Liu et al. and Ren et al. reduce the noise, both blur some of the edges in Fig. 9a (e.g., those in the area arrowed). The method of He et al. pre-serves edges relatively well but at the same time intro-duces“artifacts”(especially where arrowed), as shown in Fig. 9d. By contrast, the proposed method with high M and ρ (i.e., (4,2)) desirably suppresses the noise, while well preserving the edges and textures in the noisy image, as shown in Fig. 9e.
Figure 10 shows the results for images contaminated by pattern B noise. It can be seen that all of the methods effectively suppress the salt and pepper noise shown in Fig. 10a. However, our proposed method more desirably retains some fine structures in the noisy image, in com-parison with the other test methods.
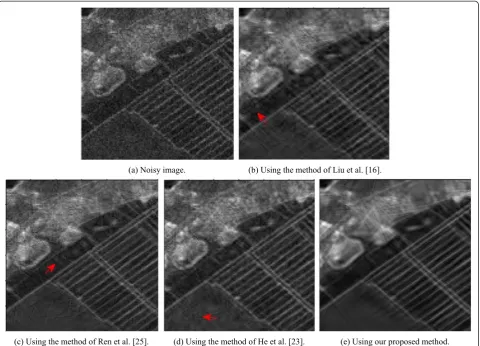
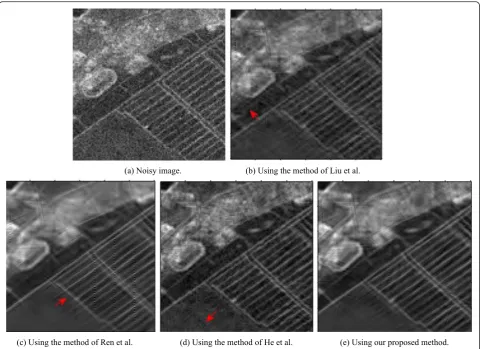
The results for images contaminated by pattern C noise are shown in Fig. 11. The method of Liu et al. sup-presses the Gaussian white noise in the smooth area well, but some edges and textures are somewhat oversmoothed (e.g., where arrowed). The method of Ren et al. also
undesirably preserves some edges, as shown in Fig. 11c. Figure 11d shows that the method of He et al. retains edge information well but adds some “artifacts” (e.g., in the arrowed area). In contrast, our method both re-duces the noise and preserves the edges in the noisy image well (see Fig. 11e).
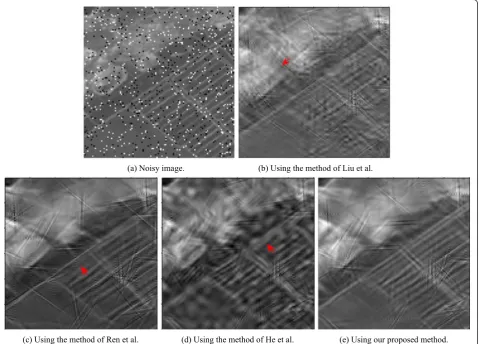
The proposed method also shows desirable perform-ance in suppressing Poisson noise. As shown in Fig. 12, there are clear differences in results provided by the tested methods, although they all improve the quality of the noisy image displayed in Fig. 12a well. Fig-ure 12b shows that the method of Liu et al. blurs some edges in Fig. 12a. The method of Ren et al. desirably reduces the noise but somewhat oversmooths some edges and textures (e.g., those arrowed). The method of He et al. retains the fine structures well but intro-duces some“artifacts,” while as shown in Fig. 12e, our method with high M and ρ provides slightly better results.
B. Quantitative analysis
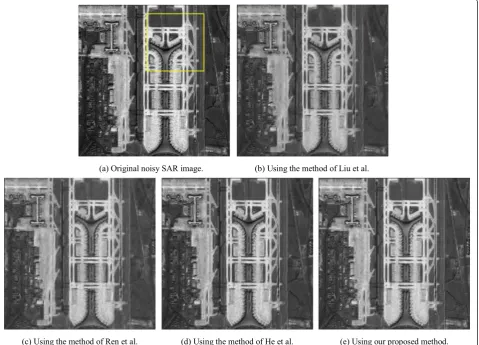
Fig. 13Original test noisy image (a) and the denoising images obtained by using all the test methods (b–e). The part surrounded by the
In order to analyze the tested methods’ denoising ef-fects quantitatively, we calculated peak signal-to-noise ratio (PSNR) and structural similarity (SSIM) values to assess from pixel- and structulevel fidelity aspects, re-spectively. SSIM is an image quality assessment index based on the human vision system and indicates degrees to which structural information in noisy image has been retained [27]. It is given by:
SSIMðx;yÞ ¼
2μxμyþC1
2σxyþC2
μ2
xþμ2y þC1
σ2
xþσ2yþC2
ð8Þ
whereμxandμyrepresent the average gray values of the noiseless reference image x and the denoising image y, respectively,σxandσyrepresent the variances ofxandy, respectively, andσxyrepresents the covariance betweenx
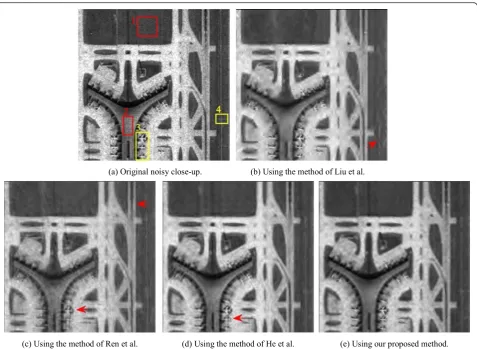
Fig. 14Close-ups of the same part of the noisy image (a) and relevant denoising results (b–e). The area covered is that shown in Fig. 13a. The districts surrounded byred(regions 1 and 2) andyellow(regions 3 and 4)rectanglesare selected as homogeneous and heterogeneous regions for ENL calculation, respectively
Table 2ENL values obtained by all the test methods, using the data in Fig. 14
Region patterns Regions Size ENL of original image and denoising results
Original image Method of He et al.
Method of He et al.
Method of He et al.
Method of our proposed method
Homogeneous region Region 1 (lawn) 48 × 48 5.656 11.218 15.581 16.495 18.436
Region 2 (roadbed) 24 × 48 4.941 9.481 8.490 10.572 12.683
Heterogeneous region Region 3 (plane) 32 × 36 9.077 14.540 18.572 16.054 15.328
and y. The symbolsC1and C2are two constants which are used to prevent unstable results when eitherμ2
xþμ2y
orσ2xþσ2y very close to zero.
Table 1 presents PSNR and SSIM values obtained by applying all the test methods to denoise the above used image corrupted by different noise patterns. For every pattern, our proposed method consistently provides better results (higher PSNR and SSIM values) than the other test methods.
3.2.2 Real noisy data-based analysis
Synthetic aperture radar (SAR) images are inherently af-fected by multiplicative speckle noise, which generally affects the basic textures of SAR imagery [28]. Hence, we also chose real noisy SAR images without adding artificial noise to evaluate the performance of the pro-posed method. One of the test images was shown in Fig. 13a, covering an area of Beijing Airport, China, collected by airborne radars and provided by Chinese Academy of Science. As shown, it covers many ground objects and rich textures.
Figure 13b–e displays the denoising results obtained by applying all the test methods to the image shown in Fig. 13a. As can be seen, all the methods effectively re-duce the speckle noise in the original image, especially in the smooth area (e.g., the surface of the runway). Figure 14 shows close-ups of the same part of the image obtained using each method for clear comparison. All of the MWPT-based methods clearly suppress speckle well, but those with low M orρ oversmooth images and thus blur many features (e.g., in the arrowed area). By contrast, the proposed 2-order balanced 4-band MWPT-based method preserves more structural details in the original image.
Since noise-free reference images were not available, equivalent number of looks (ENL) values of homogeneous regions were calculated. ENL is often applied to characterize the smoothing effect of denoising methods, given by:
ENLð Þ ¼x μ2x=σx ð9Þ
where the average μx and variance σx are carried out over a target regionx[3,4,28]. For a homogeneous region in a denoising image, the ENL value will simply reflect the degree to which the denoising method suppressed the noise in the region. However, for a heterogeneous region, the ENL value should not be too high, otherwise the method may oversmooth structural information regarding the region.
ENL values were calculated for two homogeneous regions (1 and 2 in Fig. 14a) and two heterogeneous regions (3 and 4) shown in Fig. 14b–e. The results, listed in Table 2, clearly show that the proposed method provides the highest ENL value for each homogeneous region and modest values for each heterogeneous region, demonstrating its superiority for both noise suppression and texture preservation. The results of the quantitative evaluation are also consistent with the visual assessment presented above.
3.3 Influence of the M,ρ, andk
The impacts of the band number M, the balanced order ρ, and the decomposition level k on denoising per-formance when using the MWPT-based method can be summarized in more detail as follows.
Table 3PSNR and SSIM values obtained by MWPT-based methods with different M andρparameters, when using the test image in Fig. 8a and mixing Gaussian white noise withσ= 10
Methods PSNR SSIM
ρ= 0 ρ= 1 ρ= 2 ρ= 3 ρ= 0 ρ= 1 ρ= 2 ρ= 3
MWPT with M = 2 31.308 32.342 33.051 33.074 0.815 0.828 0.850 0.856
MWPT with M = 3 32.159 33.065 33.552 33.537 0.820 0.846 0.871 0.860
MWPT with M = 4 32.638 33.365 33.682 33.640 0.824 0.862 0.889 0.862
Table 4PSNR and SSIM values obtained by MWPT-based methods with different M,ρ, andkparameters, when using the test image in Fig. 8a and mixing Gaussian white noise withσ= 10
Methods PSNR SSIM
k= 1 k= 2 k= 3 k= 4 k= 5 k= 1 k= 2 k= 3 k= 4 k= 5
MWPT with (M,ρ) = (2,3) 29.862 31.658 32.981 33.072 32.685 0.751 0.795 0.830 0.856 0.848
MWPT with (M,ρ) = (3,2) 31.954 33.273 33.545 33.433 32.076 0.786 0.849 0.871 0.862 0.824
increase, as illustrated in Table3for the dataset considered above. These results clearly confirm the superiority of the high-order balanced M-band MWPT for preserving image features.
(2)As M rises from 2 to 4, the results of the MWPT-based method improve at each balanced orderρ. Table3shows the improvement when applied to the dataset in Fig.8a. This further corroborates the advantages of M-band over 2-band multiwavelet systems.
(3)The MWPT-based method provides optimal results (at a givenρand M) when the decomposition levelk is appropriate (3 or 4 in 3-band cases, and 2 or 3 in 4-band cases). This is illustrated by the PSNR and SSIM values in Table4for the images in Fig.8a, showing that for several typical M andρcases, 3-band and 4-band MWPTs provide optimal indicator values whenk= 3.
3.4 Computational complexity analysis
As the proposed transform is orthogonal, it adds little complexity and the computational costs of the proposed method are similar to those of methods based on trad-itional multiwavelets (e.g., GHM multiwavelet). Moreover, the appropriate decomposition levels for M > 2 cases are al-ways less than that for the M = 2 case reported in Section 3.2, which further reduces the computational complexity of the proposed M-band MWPT-based method. These asser-tions were verified by the average computational times—in a MATLAB environment using a workstation with an Intel(R) CoreTMi5 CPU (3.2 GHz) and 4 Gb RAM—for the denoising cases reported in Section 3.2. Computation times of the denoising methods based on high-order balanced M-band MWPT are slightly longer than those of other MWPT-based methods but still reasonable (Table 5).
4 Conclusions
This work shows that using an appropriate higher bal-anced order or band number improves the denoising performance of multiwavelet packet transform-based methods at little additional computational cost. The high-order balanced M-band multiwavelet packet trans-form is also an effective scheme for other image process-ing tasks, such as texture analysis and edge extraction. This is because with an appropriate higher balanced order,
suitable basis set for an analyzed signal can be selected for the multiwavelet packet transform scheme. We used a simple denoising strategy to evaluate the performance of the proposed transform scheme. To further improve its performance, other approaches that are more suitable for an M-band multiwavelet system should also be applied (e.g., taking into account the different frequency behaviors of the wavelets in a multiwavelet system in fusion rule selection).
Competing interests
The authors declare that they have no competing interests.
Acknowledgements
This work was supported by the Natural Science Foundation of Hebei Province, China (Grant No. D2015402159) and the National Natural Science Foundation of China (Grant Nos. 41330746 and 41171225), and also supported by the Natural Science Foundation of Hebei Province, China (Grant No. F2015402150), the Hebei Education Department, China (Grant Nos. ZD2014081 and ZD2015087), the Ministry of Agriculture’s Special Funds for Scientific Study on Public Causes, China (Grant No. 201203062) and the National Natural Science Foundation of China (Grant Nos. 41371274 and 51309016). The author would like to thank I. W. Selesnick of Polytechnic Institute of New York University for many useful questions and comments.
Author details
1School of Information and Electrical Engineering, Hebei University of
Engineering, Handan 056038, People’s Republic of China.2School of Electronic and Information Engineering, Bayin Guoleng Vocational and Technical College, Economic Development Zone, Korla 841000Xinjiang Uygur autonomous region, People’s Republic of China.3School of Resources and Environmental Engineering, Ludong University, Yantai 264025, People’s Republic of China.4College of Urban and Environmental Science, Northwest University, Xi’an 710127, People’s Republic of China.5Institute of Agricultural Water Conservancy, Changjiang River Scientific Research Institute, Wuhan 430012, People’s Republic of China.
Received: 27 March 2015 Accepted: 17 December 2015
References
1. I Daubechies,Ten lectures on wavelets(SIAM, Philadelphia, 1992), pp. 313–319 2. DL Donoho, De-noising by soft-thresholding. IEEE T. Inform. Theory
41(3), 613–627 (1995)
3. H Xie, LE Pierce, FT Ulaby, SAR speckle reduction using wavelet denoising and Markov random field modeling. IEEE T. Geosci. Remote
40(10), 2196–2212 (2002)
4. A Achim, P Tsakalides, A Bezerianos, SAR image denoising via Bayesian wavelet shrinkage based on heavy-tailed modeling. IEEE T. Geosci. Remote41(8), 1773–1784 (2003)
5. J Geronimo, D Hardin, PR Massopust, Fractal functions and wavelet expansions based on several scaling functions. J. Approx. Theory78(3), 373–401 (1994) 6. V Strela, PN Heller, G Strang, P Topiwala, C Heil, The application of multiwavelet
filterbanks to image processing. IEEE Trans. Image Process.8(4), 548–563 (1999) 7. GY Chen, TD Bui, Multiwavelets denoising using neighboring coefficients.
8. TC Hsung, DP Lun, KC Ho, Optimizing the multiwavelet shrinkage denoising. IEEE T. Signal Process.53(1), 240–251 (2005)
9. E Bala, A Ertuzun, A multivariate thresholding technique for image denoising using multiwavelets. EURASIP J. Applied Signal Process.
2005(1), 1205–1211 (2005)
10. AA Jumah, MG Ahamad, SA Ali, Denoising of medical images using multiwavelet transforms and various thresholding techniques. J. Signal Inf. Process.4(1), 24–32 (2013)
11. JR Sveinsson, JA Benediktsson, Speckle reduction and enhancement of SAR images using multiwavelets and adaptive thresholding, inProceedings of SPIE, Image and Signal Processing for Remote Sensing V(SPIE, Florence, 1999), p. 239
12. HH Wang, J Wang, J Zhang, Remote sensing image denoising by using discrete multiwavelet transform techniques, inProceedings of SPIE, Remote Sensing and Infrared Devices and Systems(SPIE, Changchun, 2005), p. 60310S 13. RR Coifman, MV Wickerhauser, Entropy-based algorithms for best basis
selection. IEEE Trans. Inform. Theory38(2), 713–718 (1992)
14. MB Martin, AE Bell, New image compression techniques using multiwavelets and multiwavelet packets. Image Process. IEEE T.10(4), 500–510 (2001) 15. JW Wang, Multiwavelet packet transforms with application to texture
segmentation. Electron. Lett.38(18), 1021–1023 (2002)
16. ZG Liu, DB Zhang, DD Ma, De-noising and compression of power fault signals based on best multiwavelet packet, inTransmission and Distribution Conference and Exhibition: Asia and Pacific(IEEE/PES, Dalian, 2005), pp. 1–5 17. IW Selesnick, Balanced multiwavelets bases based on symmetric FIR filters.
IEEE Trans. Signal Process.48(1), 184–191 (2000)
18. J Lebrun, M Vetterli, High-order balanced multiwavelets: theory, factorization, and design. IEEE Trans. Signal Process.49(9), 1918–1930 (2001)
19. WZ He, AD Wu, GX Song, Improvement of the resolution ratio of the seismic record by balanced biorthogonal multi-wavelet transform. Comput. Inf. Sci.2005(3314), 379–384 (2005)
20. L Ghouti, A Bouridane, Image denoising using balanced multiwavelets and scale mixtures of Gaussians, inInternational Conference on Visual Information Engineering(IEE, Glasgow, 2005), pp. 101–105
21. LY Li, ZQ Wang, LX Song, Image denoising study based on balanced multiwavelet, inProceeding of SPIE, Multispectral Image Acquisition and Processing(SPIE, Yichang, 2009), p. 749424
22. ZH Zeng, Construction of high performance balanced symmetric multifilter banks and application in image processing. J. Comput.5(7), 1038–1045 (2010) 23. WZ He, AD Wu, Seismic data compression and denoising by balanced
orthogonal multiwavelet packet, inProceedings of the International Computer Congress on Wavelet Analysis and Its Applications, and Active Media Technology, vol. 1 (World Scientific, Chongqing, China, 2004), pp. 196–201 24. A Bhatti, H Ozkaramanli, M-band multiwavelets from spline super functions
with approximation order, inInternational Conference on Acoustical Speech and Signal Processing, vol. 4(IEEE, Orlando, 2002), pp. IV–4172
25. HZ Ren, YH Lan, Y Zhang, Research of multi-focus image fusion based on M-band multi-wavelet transform, inFourth International Workshop on Advanced Computational Intelligence(IEEE, Wuhan, 2011), pp. 395–398 26. HJ Wang, QK Yang, R Li, High-order balanced M-band orthogonal
multiwavelet: construction and application. Int. J. Phys. Sci.7(12), 1884–1902 (2012)
27. Z Wang, AC Bovik, HR Sheikh, EP Simoncelli, Image quality assessment: from error visibility to structural similarity. IEEE Trans. Image Process.
13(4), 600–612 (2004)
28. C Oliver, S Quegan,Understanding synthetic aperture radar images(Artech House, Boston, 1998), pp. 95–97
Submit your manuscript to a
journal and benefi t from:
7 Convenient online submission
7Rigorous peer review
7 Immediate publication on acceptance
7Open access: articles freely available online
7 High visibility within the fi eld
7Retaining the copyright to your article