R E S E A R C H A R T I C L E
Open Access
Maternal cortisol and stress are associated
with birth outcomes, but are not affected
by lipid-based nutrient supplements during
pregnancy: an analysis of data from a
randomized controlled trial in rural Malawi
Christine P. Stewart
1*, Brietta M. Oaks
1, Kevin D. Laugero
2, Ulla Ashorn
3, Ulla Harjunmaa
3, Chiza Kumwenda
4,
David Chaima
4, Kenneth Maleta
4, Per Ashorn
3,5and Kathryn G. Dewey
1Abstract
Background:Prenatal micronutrient supplements have been found to increase birth weight, but mechanisms for
increased growth are poorly understood. Our hypotheses were that 1) women who receive lipid-based nutrient supplements (LNS) during pregnancy would have lower mean salivary cortisol concentration at 28 wk and 36 wk gestation compared to the multiple micronutrient (MMN) and iron-folic acid (IFA) supplement groups and 2) both salivary cortisol and perceived stress during pregnancy would be associated with shorter duration of gestation and smaller size at birth.
Methods:Women were enrolled in the trial in early pregnancy and randomized to receive LNS, MMN, or iron-folic acid (IFA) supplements daily throughout pregnancy. At enrollment, 28 wk and 36 wk gestation, saliva samples were collected and their cortisol concentration was measured. Self-report of perceived stress was measured using questionnaires. Gestation duration was indicated by ultrasound dating and newborn anthropometric measurements (weight, length, head circumference) provided indicators of intrauterine growth.
Results:Of the 1391 women enrolled in the trial, 1372, 906 and 1049 saliva samples were collected from women at baseline, 28 wk and 36 wk, respectively. There were no significant differences in mean cortisol concentrations by intervention group at 28 wk or 36 wk gestation. Cortisol concentrations were negatively associated with duration of gestation (Baseline:β=−0.05,p= 0.039; 36 wk:β=−0.04,p= 0.037) and birth weight (28 wk:β=−0.08,p= 0.035; 36 wk:β=−0.11,p= 0.003) but not associated with length-for-age or head circumference-for-age z-scores. Perceived stress at 36 wk was significantly associated with shorter newborn LAZ (p= 0.001). There were no significant associations with the risk of small for gestational age, preterm birth, or low birth weight.
Conclusions:Maternal salivary cortisol concentration was strongly associated with birth weight and duration
of gestation in rural Malawi, but these data do not support the hypothesis that LNS provision to pregnant women would influence their salivary cortisol concentrations.
Trial registration: Clinicaltrials.gov identifier NCT01239693
Keywords: Cortisol, Stress, Preterm birth, Birth weight, Lipid-based nutrient supplements, Multiple micronutrient supplements, Malawi, Pregnancy
* Correspondence:[email protected]
1Program in International and Community Nutrition, Department of
Nutrition, University of California, Davis, CA, USA
Full list of author information is available at the end of the article
Background
Intrauterine growth restriction and shortened duration of gestation are risk factors for neonatal morbidity and mortality [1] and are associated with child growth falter-ing in many low and middle income country (LMIC) set-tings [2]. An estimated 15 % of children are born low birth weight and 11 % are born preterm globally [3]. Complications from preterm birth are estimated to be responsible for 35 % of the world’s 3.1 million neonatal deaths [4] and a leading cause of under-5 mortality worldwide [5]. Risk factors for smaller size at birth or shortened duration of gestation include poor nutrition during pregnancy, infections, and maternal stress [6–8].
Interventions to improve birth outcomes in LMIC have had limited success at increasing size at birth or duration of gestation. Maternal multiple micronutrient (MMN) supplements have been found to result in a small increase in birth weight of 22 g and an increase in the duration of gestation [9, 10]. Other nutritional inter-ventions, such as provision of calcium or zinc, have been found to result in a reduced risk of preeclampsia [11] and a modest increase in the duration of gestation [12]. Lipid-based nutrient supplements (LNS) provided during pregnancy have been evaluated for their effects on birth outcomes and early childhood growth in three studies to date, in Burkina Faso [13], Ghana [14], Malawi [15].
In impoverished communities, malnutrition is com-pounded by a variety of physical and psychosocial stressors that may further compromise pregnancy. Acute or chronic psychosocial experiences [16] and the biologic measure of serum or salivary cortisol concentrations [17] have been associated with shortened duration of gestation and intra-uterine growth restriction. Cortisol is a regulatory hormone involved in the hypothalamic-pituitary-adrenal axis (HPA) response to stress as well as in the fetal-placental-maternal neuroendocrine system regulating the maintenance of preg-nancy and the timing of parturition [18]. Cortisol and corticotropin-releasing hormone (CRH) concentrations rise exponentially over the course of pregnancy due to a posi-tive feedback mechanism via the placenta [19]. They peak at the time of delivery and have been hypothesized to serve in regulating the‘placental clock’, determining the timing of parturition [20]. CRH promotes fetal prostaglandin and estrogen synthesis, which lead to myometrial activa-tion and contractility [19]. Cortisol also is involved in fetal growth and maturation. The late gestation rise in cortisol concentration is related to a shift from rapid fetal growth towards tissue maturation [21]. Ele-vated cortisol concentration is negatively associated with IGF-1 activity [22] and, importantly, is involved in fetal lung maturation through the production of surfactant to prepare the fetus for postnatal life [23].
Despite the physiologic explanations for a normal rise in cortisol during pregnancy, higher than expected
increases in cortisol and CRH concentrations have important short- and long-term negative functional consequences on the health of the pregnancy and the offspring in later life [24, 25]. In the short term, ele-vated CRH is associated with placental dysfunction, including shallow trophoblast invasion and poor pla-cental vascularization which can lead to intrauterine growth restriction and preeclampsia [26]. Elevations in perceived stress and cortisol concentrations have been related to higher concentrations of proinflammatory cytokines and lower concentrations of anti-inflammatory cytokines [27, 28]. In the longer-term, excess glucocortic-oid exposure has been associated with the life-long func-tion of the HPA axis in the offspring, and has been hypothesized to increase susceptibility to a variety of con-ditions including depression, hypertension, type 2 diabetes mellitus, and cognitive impairments [25, 29]. The fetus is somewhat buffered from the effects of high maternal cortisol concentrations through the activity of the 11-β -hydroxysteroid dehydrogenase (HSD)-2 enzyme in the placenta, which converts maternal cortisol to an inactive cortisone [30]. Yet this is not a perfect barrier and fetal and maternal cortisol concentrations are highly correlated suggesting that abnormally high maternal cortisol concen-trations could affect the developing fetus [31]. The activity of the 11-β-HSD2 enzyme appears to be sensitive to ma-ternal malnutrition [24, 32, 33], which would result in greater fetal exposure to active cortisol, particularly during late gestation. There is some evidence that cortisol con-centrations may be elevated among undernourished indi-viduals, including short term studies suggesting that cortisol concentration increases during energy restriction [34, 35] and that stunted children have elevated cortisol concentrations and a blunted cortisol response to stressors [36–38]. One trial among Nepali pregnant women re-ported that late gestation cortisol concentrations were lower among women who received multiple micronutrient supplements compared to a control [39], so it is plausible that improvements in nutrition may alter cortisol concen-trations. Thus, the effects of malnutrition and elevated cortisol concentrations during pregnancy may interact deleteriously on the developing fetus, with both immedi-ate and long-term results.
salivary cortisol concentration at 28 wk and 36 wk gesta-tion compared to the MMN and IFA groups and 2) both salivary cortisol and perceived stress during pregnancy would be associated with shorter duration of gestation and smaller size at birth.
Methods
To evaluate these questions, we nested a substudy within the iLiNS trial in Malawi. Details of the overall study design methods and primary outcome results have been published previously [15]. In brief, the target popu-lation included pregnant women attending antenatal care through one of four hospitals or health facilities in Mangochi District in southern Malawi. Inclusion criteria were as follows: ≤20 wk gestation confirmed by ultra-sound, residence in the defined catchment area, availability during the period of the study, and signed or thumb-printed informed consent. Exclusion criteria were: age <15 years old, need for medical attention due to a chronic or severe illness, diagnosed and medically treated asthma, history of peanut allergy, history of anaphylaxis or serious allergic reaction to any substance, pregnancy complications evident at enrolment visit (moderate to severe edema, blood Hb concentration < 50 g/l, systolic blood pressure (BP) > 160 mmHg or diastolic BP > 100 mmHg), earlier participation in the trial during to a previous pregnancy or concurrent participation in any other clinical trial.
A statistician independent of the research group gen-erated randomization codes by creating four unique lists (one for each enrollment site) in blocks of nine (3 codes for each of the 3 interventions). The codes were inserted into individual opaque envelopes and eligible partici-pants selected one from a shuffled stack of 6 envelopes. This code determined both the participant’s group allo-cation as well as her identifiallo-cation number.
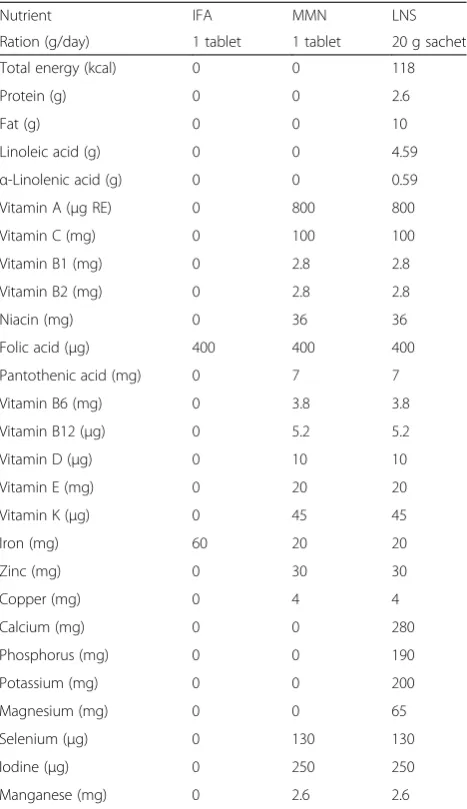
Based on their randomization code, women received one of three supplements to be consumed daily through-out pregnancy: 1) small quantity LNS; 2) MMN; or 3) IFA. The nutrient content for each of the supplements can be found in Table 1. Data collectors delivered sup-plements every two weeks to participants and they advised women to consume the supplements daily either after a meal (IFA or MMN groups) or mixed with a meal (LNS). Data collectors monitored adherence at each dis-tribution visit by counting any unused supplements from participants.
At enrollment, trained nurses confirmed pregnancies and gestational age estimates using ultrasound imagers (EDAN DUS 3 Digital Ultrasonic Diagnostic Imaging Sys-tem, EDAN Instruments, Inc., Shekou, Nanshan Shenzhen, China). Study nurses were trained in ultrasound assess-ment by two study physicians and they conducted all mea-surements in duplicate. Anthropometrists measured in triplicate maternal height using a stadiometer (Harpenden
stadiometer, Holtain Limited, Crosswell, Crymych, UK), weight using a flat scale (SECA 874 flat scale, Seca GmbH & Co., Hamburg, Germany), and mid-upper arm circum-ference (MUAC) using a non-stretchable tape (Weigh and Measure, LLC, Maryland, USA). Research nurses tested for malaria using rapid diagnostic tests (Clearview Malaria Combo, British Biocell International Ltd., Dundee, UK), haemoglobin concentration (HemoCue AB, Angelholm, Sweden), and HIV (Alere Determine HIV-1/2, Alere Med-ical Co., Ltd., Chiba, Japan). Positive HIV tests were re-peated using another whole blood antibody test (Uni-Gold HIV, Trinity Biotech plc, Bray, Ireland).
During a follow-up home visit, trained interviewers asked mothers about demographic and socioeconomic characteristics, including questions on household food insecurity. Mothers were asked to return to the clinic for repeat visits at 32 and 36 wk gestation. A follow-up home visit was also conducted at 28 wk gestation. At
Table 1Nutrient content of the supplements
Nutrient IFA MMN LNS Ration (g/day) 1 tablet 1 tablet 20 g sachet Total energy (kcal) 0 0 118 Protein (g) 0 0 2.6 Fat (g) 0 0 10 Linoleic acid (g) 0 0 4.59
enrolment, 28 wk, and 36 wk gestation, interviewers asked women about stress during the previous month using the 10-item Perceived Stress Scale [40], a tool that has been used in other low-income settings [41, 42].
The research nurses collected saliva samples during the clinic visits at baseline and 36 wk gestation and during the 28 wk home visit between 8 am and 4 pm after a 30 mi-nute fast. Time of collection, time of waking, and time of last food or drink were recorded by the nurse. Saliva col-lection occurred before any other measurements or sam-ple collection. Nurses asked each woman to place an inert polymer cylindrical swab (Salimetrics Oral Swab) under her tongue for approximately two minutes, while moving her tongue and jaw as if she were chewing to stimulate saliva. The woman removed the swab and placed it in a capped tube and then it was refrigerated or placed on ice packs. Swabs were brought to room temperature, then centrifuged for 15 min at 3,000 RPM (1500 x g) to extract saliva, which then was frozen at−20 °C. After a maximum of 2 days, samples were transferred to a−80 °C freezer for longer term storage. Samples were shipped to Davis, CA for analysis. Lab technicians measured cortisol concentra-tions in duplicate using an ELISA method (expanded range high sensitivity salivary cortisol kit, Salimetrics, State College, PA), which can detect cortisol concen-trations ranging from 0.193 to 82.77 nmol/L (0.007-3.0 μg/dL). The intra- and inter-assay coefficient of variability is 3.5 % and 5.1 %. The mean of each duplicate measure was used for analysis.
Research nurses collected venous blood samples at baseline and 36 wk gestation using 7.5 mL trace mineral-free syringe (Sarstedt Monovette, Nh4-heparin, Sarstedt Inc., Newton, NC). Lab technicians measured zinc protoporphyrin in washed red blood cells within 30 hr of collection using a hematofluorometer (Aviv Bio-medical, Lakewood, NJ). They also measured soluble transferrin receptor, c-reactive protein (CRP), and alpha-1-acid glycoprotein (AGP) by immunoturbidimetry on the Cobas Integra 400 system (F. Hoffmann-La Roche Ltd, Basel, Switzerland).
Research assistants measured infants’ weight as soon as possible after birth either at home or in the health center. Of the recorded birth weights, 89 % were mea-sured within 48 h of delivery while the remainder were back-translated from a measurement within 14 days. They also collected early neonatal measurements, includ-ing length to the nearest 1 mm usinclud-ing an infantometer (Harpenden Infantometer, Holtain Limited, Crosswell, Crymych, UK), weight to the nearest 10 g using an infant scale (SECA 381 baby scale, Seca GmbH & Co., Hamburg, Germany), head circumference and arm circumference using non-stretchable tape.
Women provided written informed consent or indi-cated their consent to participate in the study with a
thumbprint. In Malawi, individuals ≥15 y are able to provide consent themselves and so parental consent was not obtained. The institutional review boards at the College of Medicine Research and Ethics Committee (COMREC), University of Malawi and the Ethics Com-mittee of Pirkanmaa Hospital District, Finland reviewed and approved the trial protocols at all of the hospitals and health facilities.
Statistical analysis
Sample size estimates for the main trial were calculated to be 370 per group, based on an effect size (difference between groups divided by the pooled SD) of 0.23, as-suming a two-sidedα= 0.05 andβ= 0.2. That would cor-respond to a detectable difference of 0.83 nmol/L in cortisol and a 1.2 point difference in the perceived stress score (PSS). We used standard scoring methods to cal-culate the PSS [40]. We checked the salivary cortisol and PSS for normality using the Shapiro-Wilk test and corti-sol was log transformed. We calculated Pearson’s correl-ation coefficients to compare log cortisol and the PSS at each time point. We also analyzed PSS and cortisol cat-egorically. PSS was dichotomized into high or low values using a median cut-point and cortisol concentrations were grouped into quartiles based on the distributions at each measurement point (enrolment, 28 wk, 36 wk).
We used the Household Food Insecurity Access Scale [43] to estimate food insecurity and created the scores using standard criteria. An asset index was created using principal components analysis [44] based on household ownership of a set of assets (radio, television, cell phone, bed, mattress, bednet, and bicycle), lighting source, drinking water supply, sanitation facilities, and flooring materials.
For all analyses, participants were included if they had non-missing data on either cortisol or the perceived stress score at any time-point. We compared character-istics for those with complete data vs. those who were missing data on cortisol at 28 wk gestation. We also compared baseline characteristics between women in each of the three intervention groups.
meal in all models, regardless of their association with the outcome variables. Interaction terms were created by the cross product of the intervention group and maternal age, parity, baseline BMI, and infant gender and these were evaluated in linear regression models. Interaction term p -values <0.1 were considered to be statistically significant.
To examine the associations between cortisol or PSS and birth outcomes (duration of gestation, weight-for-age z-score [WAZ], length-for-age z-z-score [LAZ], head circum-ference z-score [HCZ]), we used linear regression models and present standardized regression coefficients. We used Poisson regression models with robust estimation of the standard errors to estimate relative risk for dichotomous birth outcomes, including preterm birth (<37 wk gestation), low birth weight (<2.5 kg, LBW), stunting (LAZ <−2), small head circumference (HCZ <−2), and small for gestational age [45]. We considered covariates for inclusion into the models based on previous literature and tested as described above. Because cortisol and the inflammatory markers are likely related to each other, but the causal pathways are unclear, we have analyzed models both with and without adjustment for the two inflammation variables.
Missing data were considered in two ways. We first compared baseline characteristics between those with complete data and those with missing data. Secondly, we imputed missing values [46] for 28 wk and 36 wk cortisol concentrations and re-analyzed the data as a sensitivity test on the primary models. Model assump-tions were also checked using standard regression diagnostics for linearity, normality, leverage, and in-fluence. All analyses were performed using SAS 9.3 (SAS Institute, Cary, NC).
Results
Of the total of 1391 women enrolled in the trial, 1372 women had baseline data on cortisol concentration and
PSS. Baseline characteristics of women in the three intervention groups are shown in Table 2. Women’s ages ranged from 15 to 49 years and there were no differ-ences in terms of mean age, education, or other sociode-mographic factors between groups.
There was some loss to follow-up or missing data on cortisol or PSS at baseline, 28, and 36 wk gestation (Fig. 1), but missing data were balanced across the LNS, MMN, and IFA groups. We compared those with complete data (n= 883) vs. those with missing data at 28 wk (n= 477 women), the time point with the highest rate of missing data. We found that women with complete data were less likely to be anemic (Hb < 110 g/l; 17.0 % vs. 27.1 %; p< 0.001). Other characteristics, such as age, baseline cortisol, education, BMI, HIV status, preva-lence of primiparity, and malaria at enrollment were generally similar between those in the analytical sam-ple compared to those with missing data. We re-peated this comparison for those with missing 36 wk data (n= 342) and found no significant differences compared to those with complete data.
Differences by intervention group
Saliva samples were collected at a mean of 12:20 pm, 11:15 am, and 10:30 am at baseline, 28 wk and 36 wk, respectively. Mean cortisol concentrations at baseline differed between groups (p= 0.032) with the highest concentration in the IFA group (6.1 ± 4.7 nmol/L) com-pared to 5.4 ± 3.0 and 5.5 ± 3.3 nmol/L in the MMN and LNS groups, respectively (Table 2). Mean PSS at baseline was 14.4 (±SD: 5.6) and this did not differ by group.
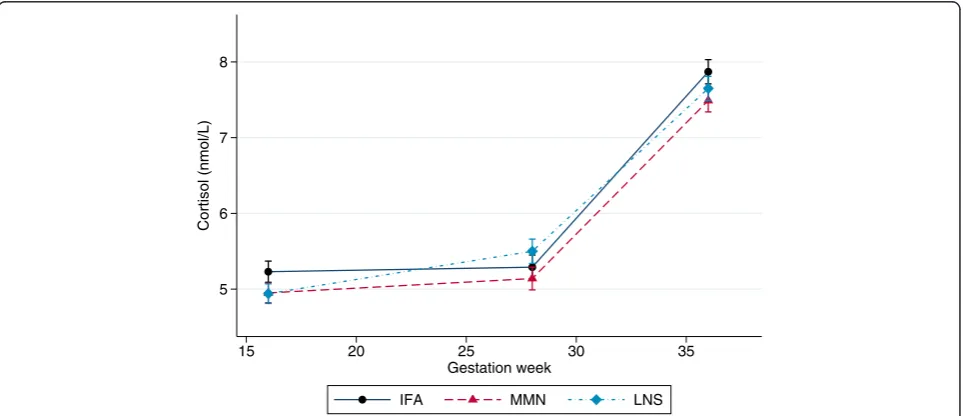
Maternal cortisol values increased during pregnancy, from 5.7 ± 3.6 nmol/L at baseline to 5.9 ± 3.3 nmol/L at 28 wk and 8.1 ± 3.2 nmol/L at 36 wk gestation (Fig. 2). PSS did not change substantially during pregnancy and there was no correlation between maternal perceived
Table 2Characteristicsaof pregnant women in the ILiNS-DYAD trial in rural Malawi who were included in this analysis
Characteristic IFA MMN LNS p-valueb
Number of participants 413 415 418 n/a Age, years 25 (6) 25 (6) 25 (6) 0.957 Education, completed years 3.9 (3.4) 4.0 (3.4) 4.1 (3.6) 0.647 Proportion of primiparous women 18.9 % 19.6 % 20.5 % 0.863 Gestational age at enrolment, wk 16.8 (2.1) 16.7 (2.1) 16.9 (2.2) 0.765 Weight, kg 53.8 (7.4) 54.0 (8.2) 54.0 (8.0) 0.962 Body-mass index, BMI (kg/m2) 22.1 (2.6) 22.2 (2.9) 22.1 (2.9) 0.908
Proportion of women with a low BMI (<18.5 kg/m2) 5.3 % 4.4 % 6.3 % 0.530 Proportion of anemic women (Hb < 110 g/l) 17.1 % 18.7 % 19.1 % 0.775 Proportion of women with a positive HIV test 14.8 % 9.9 % 13.1 % 0.145 Proportion with a positive malaria test (RDT) 21.2 % 22.7 % 23.7 % 0.739
a
Mean (SD) except where noted
b
stress and salivary cortisol at any point during pregnancy (details not shown). We found no significant group-wise differences in cortisol in either crude models or those adjusted for maternal age, education, household asset index, study site, season, baseline hemoglobin, ZPP, sTfR, time between waking and saliva collection, and time be-tween last food or drink and saliva collection (Table 3). There were also no differences in PSS between groups in either unadjusted analyses or models adjusted for
maternal age, education (completed years), site of enrol-ment, season, and household asset index. Interactions were tested and none was found to be significant.
Associations with birth outcomes
In this sample, the mean birth weight was 2971 (SD 445) g, birth length was 49.7 (SD 2.2) cm and duration of gestation was 39.4 (SD 2.1) wk. Salivary cortisol concentra-tion was associated with a number of birth outcomes in
Fig. 1Description of sample sizes and missing data at each measurement point among pregnant women in the iLiNS-DYAD trial in Malawi.IFA, iron-folic acid supplement group;MMN,multiple micronutrient supplement group;LNS, lipid based nutrient supplement group
5 6 7 8
Cortisol (nmol/L)
15 20 25 30 35
Gestation week
IFA MMN LNS
this study population. Higher cortisol concentration at en-rolment and 36 wk gestation, but not at 28 wk gestation, was associated with a shorter duration of gestation in crude and adjusted models (Table 4). For each SD increase in baseline log cortisol concentration, there was a reduction of 0.04 to 0.05 SD in duration of gestation, which translates to roughly 1 day reduced duration of gestation per SD in-crease in cortisol. Higher cortisol concentration at 28 wk and 36 wk gestation was significantly associated with lower mean birth weight: approximately 40 and 49 g lower per SD increase in cortisol at those respective time points. At baseline, cortisol was associated with a lower standardized birth weight in the multivariate adjusted model (p= 0.013), but when the model was further adjusted for CRP and AGP, the point estimate was attenuated and the difference was no longer statistically significant (p= 0.066). Cortisol concentration was not found to be associated with new-born WAZ, LAZ, or HCZ at any time point, however. There was less of a consistent relationship between PSS and birth outcomes. Perceived stress at 28 wk and 36 wk was not associated with duration of gestation but the 36
Table 4Associations between cortisol at each time point during pregnancy with duration of pregnancy and newborn anthropometric indicators
Crudea Model 1a,b Model 2a,c
β(95 % CI) p-value β(95 % CI) p-value β(95 % CI) p-value Duration of pregnancy, wk
Baseline −0.05 (−0.10, 0.01) 0.086 −0.05 (−0.10,−0.01) 0.015 −0.05 (−0.09,−0.002) 0.039 28 wk −0.02 (−0.06, 0.03) 0.528 −0.02 (−0.07, 0.02) 0.305 −0.02 (−0.07, 0.02) 0.343 36 wk −0.05 (−0.08,−0.02) 0.002 −0.04 (−0.07,−0.002) 0.032 −0.04 (−0.07,−0.002) 0.037 Birth weight, g
Baseline −0.08 (−0.14,−0.02) 0.007 −0.08 (−0.14,−0.02) 0.013 −0.06 (−0.12, 0.01) 0.066 28 wk −0.05 (−0.12, 0.02) 0.189 −0.09 (−0.17,−0.02) 0.013 −0.08 (−0.16,−0.01) 0.035 36 wk −0.10 (−0.16,−0.04) 0.0005 −0.11 (−0.18,−0.04) 0.002 −0.11 (−0.18,−0.04) 0.003 Newborn WAZ
Baseline −0.04 (−0.10, 0.02) 0.143 −0.04 (−0.10, 0.03) 0.265 −0.01 (−0.07, 0.05) 0.412 28 wk −0.03 (−0.10, 0.03) 0.328 −0.06 (−0.13, 0.02) 0.129 −0.04 (−0.11, 0.03) 0.319 36 wk −0.05 (−0.11, 0.01) 0.097 −0.05 (−0.12, 0.02) 0.174 −0.04 (−0.11, 0.03) 0.284 Newborn LAZ
Baseline −0.04 (−0.10, 0.02) 0.163 −0.06 (−0.12, 0.01) 0.088 −0.04 (−010, 0.03) 0.255 28 wk −0.04 (−0.11, 0.02) 0.204 −0.06 (−0.13, 0.01) 0.111 −0.04 (−0.12, 0.03) 0.580 36 wk −0.05 (−0.11, 0.01) 0.100 −0.02 (−0.10, 0.05) 0.545 −0.01 (−0.08, 0.06) 0.746 Newborn HCZ
Baseline −0.05 (−0.11, 0.01) 0.095 −0.06 (−0.12, 0.01) 0.089 −0.04 (−0.10, 0.03) 0.273 28 wk −0.05 (−0.12, 0.02) 0.130 −0.07 (−0.14, 0.01) 0.072 −0.06 (−0.13, 0.02) 0.136 36 wk −0.07 (−0.13,−0.01) 0.017 −0.07 (−0.14, 0.01) 0.074 −0.06 (−0.14, 0.01) 0.089
a
Standardized regression coefficients, standard errors, andp-values obtained using linear regression models. Data were available forn= 1372, 906, and 1049 women at baseline, 28 wk, and 36 wk, respectively
b
Adjusted for parity (primiparous or multiparous), maternal age, sex of fetus, maternal BMI, education, socio-economic score, study site, season at enrolment, gestational age at enrolment, time between waking and saliva collection, and time between last food or drink (except or water) and saliva collection
c
Adjusted for everything in Model 1, plus AGP and CRP
WAZ, weight-for-age z-score;HCZ, head circumference-for-age z-score
Table 3Mean (SD) cortisol and perceived stress during pregnancy and birth outcomes by intervention group
Characteristic IFA MMN LNS p-valuea
Cortisol, nmol/L
Baseline 6.0 (4.5) 5.4 (3.2) 5.6 (3.4) 0.032 28 wk 5.7 (2.7) 5.7 (2.8) 6.2 (4.2) 0.280 36 wk 8.4 (3.5) 7.8 (2.7) 8.1 (3.3) 0.080 Perceived stress score
Baseline 14.7 (5.6) 14.2 (5.4) 14.3 (5.4) 0.504 28 wk 14.9 (5.6) 15.2 (6.0) 14.2 (5.8) 0.079 36 wk 13.7 (5.1) 14.0 (5.4) 13.7 (4.9) 0.730
a.
wk measure was significantly associated with shorter newborn LAZ (p= 0.001). No other associations were significant.
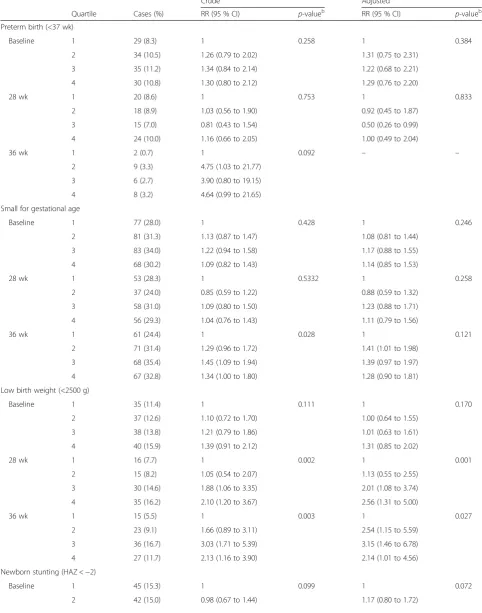
We also examined the association between cortisol categorized into quartiles and dichotomous birth out-comes (Table 5). Here we found that those with cortisol in the uppermost quartile experienced a 56 % higher risk of newborn stunting compared to those in the lowest quartile (RR: 1.56; 95 % CI 1.08 to 2.25) in a multivariate adjusted model. However, when further adjusted for CRP and AGP, the effect size was attenuated (RR: 1.42; 95 % CI 0.96 to 2.09) and the difference was no longer statistically significant (p= 0.076). There was a relatively consistent association between higher cortisol at 28 wk or 36 wk gestation and an increased risk of LBW. Those with a cortisol concentration in Q3 or Q4 had a roughly 2-fold increased risk of LBW compared to those in the lowest quartile. Cortisol concentration was not signifi-cantly associated with SGA in adjusted models. Finally, we also examined the association between PSS dichoto-mized into high vs. low using a median value cutoff. High PSS at 36 wk gestation was associated with a 71 % higher risk of newborn stunting (RR: 1.71; 1.22 to 2.41;
p= 0.002), but was not significantly associated with the other birth outcomes (data not shown).
Interactions were tested and found to be statistically significant for parity (p= 0.034). Among multiparous women, there was no difference in birth weight with in-creasing cortisol concentration; however, among prim-iparous women, cortisol concentrations in the 3rdor 4th quartile were associated with lower mean WAZ at birth (Fig. 3). No other tested interactions were found to be statistically significant.
Evaluation of missing data and sensitivity analyses
Using multiple imputation to estimate missing cortisol data at 28 wk and 36 wk, we re-analyzed the data and found, consistent with the primary analyses, there were no signifi-cant differences in cortisol concentration by intervention group. All coefficients in the imputed models were within 10 % of the values in the limited models (data not shown).
Discussion
The present study tested the hypothesis that the provision of LNS would alter maternal salivary cortisol concentrations during gestation, and evaluated the asso-ciations between biologic markers of stress response or perceived stress during pregnancy and birth outcomes. Our results did not support the primary study hypoth-esis; we observed no association between LNS exposure and cortisol concentrations during mid- to late gestation and so we conclude that there was no effect of the inter-vention. In this study population, cortisol concentration at varying points during gestation was associated with
duration of gestation, birth weight, and risk of LBW, but not risk of SGA. We also found that a woman’s report of perceived stress in the past month was associated with a modest increase in the risk of newborn stunting.
Our intervention effect results are similar to recent re-sults from a trial in Ghana and two trials in Burkina Faso [47, 48], but differ from those of a study in Nepal [49]. In the Ghana study, in which women had a mean BMI of ~27 kg/m2and 45 % were between 18–25 y, salivary cortisol concentrations did not differ between intervention groups overall. However, there was evidence of an interaction with maternal age whereby maternal cor-tisol concentrations were 1.06 nmol/L lower among youn-ger women (<25 y) in the LNS group compared to similarly aged women in the IFA control group [50]. This difference was not observed among older women, nor was there evidence of a difference between the MMN and the IFA groups in either of the age categories. In Burkina Faso, cord blood cortisol concentrations did not differ between groups in either a trial of MMN [48] or a trial of LNS [47] during pregnancy. However, there was a significant inter-action between parity and MMN supplementation, such that cord blood cortisol concentrations were higher among primiparous women in the MMN group compared to the controls (IFA), a finding not apparent among mul-tiparous women. In the Nepal study, in which women had a mean BMI of ~19 kg/m2and approximately 30 % were <19 y, maternal serum cortisol concentrations were mar-ginally lower by 1.32μg/dL (p= 0.062) in the MMN group relative to the vitamin A control group [39]. In the present study, women were similar in age (mean of 25 y) to those in the Ghana and Burkina Faso studies, but had lower mean BMI (22 kg/m2).
Table 5Risk of adverse birth outcomes in participants by quartile of cortisol concentrations during pregnancy
Crude Adjusteda
Quartile Cases (%) RR (95 % CI) p-valueb RR (95 % CI) p-valueb Preterm birth (<37 wk)
Baseline 1 29 (8.3) 1 0.258 1 0.384 2 34 (10.5) 1.26 (0.79 to 2.02) 1.31 (0.75 to 2.31)
3 35 (11.2) 1.34 (0.84 to 2.14) 1.22 (0.68 to 2.21) 4 30 (10.8) 1.30 (0.80 to 2.12) 1.29 (0.76 to 2.20)
28 wk 1 20 (8.6) 1 0.753 1 0.833 2 18 (8.9) 1.03 (0.56 to 1.90) 0.92 (0.45 to 1.87)
3 15 (7.0) 0.81 (0.43 to 1.54) 0.50 (0.26 to 0.99) 4 24 (10.0) 1.16 (0.66 to 2.05) 1.00 (0.49 to 2.04)
36 wk 1 2 (0.7) 1 0.092 – –
2 9 (3.3) 4.75 (1.03 to 21.77) 3 6 (2.7) 3.90 (0.80 to 19.15) 4 8 (3.2) 4.64 (0.99 to 21.65) Small for gestational age
Baseline 1 77 (28.0) 1 0.428 1 0.246 2 81 (31.3) 1.13 (0.87 to 1.47) 1.08 (0.81 to 1.44)
3 83 (34.0) 1.22 (0.94 to 1.58) 1.17 (0.88 to 1.55) 4 68 (30.2) 1.09 (0.82 to 1.43) 1.14 (0.85 to 1.53)
28 wk 1 53 (28.3) 1 0.5332 1 0.258 2 37 (24.0) 0.85 (0.59 to 1.22) 0.88 (0.59 to 1.32)
3 58 (31.0) 1.09 (0.80 to 1.50) 1.23 (0.88 to 1.71) 4 56 (29.3) 1.04 (0.76 to 1.43) 1.11 (0.79 to 1.56)
36 wk 1 61 (24.4) 1 0.028 1 0.121 2 71 (31.4) 1.29 (0.96 to 1.72) 1.41 (1.01 to 1.98)
3 68 (35.4) 1.45 (1.09 to 1.94) 1.39 (0.97 to 1.97) 4 67 (32.8) 1.34 (1.00 to 1.80) 1.28 (0.90 to 1.81) Low birth weight (<2500 g)
Baseline 1 35 (11.4) 1 0.111 1 0.170 2 37 (12.6) 1.10 (0.72 to 1.70) 1.00 (0.64 to 1.55)
3 38 (13.8) 1.21 (0.79 to 1.86) 1.01 (0.63 to 1.61) 4 40 (15.9) 1.39 (0.91 to 2.12) 1.31 (0.85 to 2.02)
28 wk 1 16 (7.7) 1 0.002 1 0.001 2 15 (8.2) 1.05 (0.54 to 2.07) 1.13 (0.55 to 2.55)
3 30 (14.6) 1.88 (1.06 to 3.35) 2.01 (1.08 to 3.74) 4 35 (16.2) 2.10 (1.20 to 3.67) 2.56 (1.31 to 5.00)
36 wk 1 15 (5.5) 1 0.003 1 0.027 2 23 (9.1) 1.66 (0.89 to 3.11) 2.54 (1.15 to 5.59)
3 36 (16.7) 3.03 (1.71 to 5.39) 3.15 (1.46 to 6.78) 4 27 (11.7) 2.13 (1.16 to 3.90) 2.14 (1.01 to 4.56) Newborn stunting (HAZ <−2)
explanation is that elevations in maternal cortisol concen-tration in this context were due to other non-nutritional physical or psychosocial stressors. The HPA axis is activated during infection and cortisol has important im-munomodulatory effects [51], so elevated cortisol concen-tration may have been more strongly associated with an infectious disease burden rather than malnutrition. Corti-sol response to stressors is generally blunted during preg-nancy [52], which is in line with our finding of no correlation between the PSS and cortisol in this cohort.
We found that there were strong associations between maternal cortisol concentrations at some time points during pregnancy and birth weight or duration of gesta-tion, and that the association with birth weight was strongest among primiparous women. Associations were attenuated with adjustment for CRP and AGP, which suggests that infection or inflammation were related to this relationship, either as confounding or mediating
factors. There was no association with the risk of SGA, which suggests that the observed differences in birth weight were likely due to the earlier timing of birth, rather than due to intrauterine growth restriction. Late gestation perceived stress was also associated with lower newborn length. These findings are consistent with a number of other studies, including the Ghanaian and Nepali trials described above. Numerous studies have reported an association between maternal cortisol or psychosocial stress during pregnancy and adverse birth outcomes, primarily shorter duration of gestation, the descriptions of which can be found in a number of well-written reviews [16, 17]. Our findings differ somewhat from the Burkinabe trial, which measured cord blood cortisol concentrations and found there to be no associ-ation with measures of size at birth [48]. A possible explanation for this apparent difference may reflect the different pools from which the cortisol was measured and timing of measurement. We measured maternal salivary cortisol concentrations during gestation, while Roberfroid et al. measured cord serum concentrations. While maternal and fetal cortisol concentrations are correlated, they may act on fetal growth and timing of parturition through different pathways.
Strengths of the present study include the large pro-spective design with multiple measures during pregnancy and generally high rates of follow-up. Imputation of miss-ing data did not substantially change the interpretation of the main findings. The randomized controlled trial design reduced the potential for confounding and bias in the analysis of the effects of the maternal supplements and cortisol concentrations during pregnancy. Unfortunately, resource constraints limited our ability to measure CRH and logistical constraints in the field limited our ability to highly control the timing and sampling protocols for saliv-ary cortisol. Cortisol follows a strong diurnal pattern and
Fig. 3Interaction between baseline cortisol and parity on newborn weight-for-age z-score. Data represent mean (SE) weight for age z-score.P-value for interaction = 0.034
Table 5Risk of adverse birth outcomes in participants by quartile of cortisol concentrations during pregnancy(Continued)
3 41 (15.3) 1.00 (0.68 to 1.48) 1.02 (0.68 to 1.52) 4 48 (21.3) 1.39 (0.96 to 2.01) 1.56 (1.08 to 2.25)
28 wk 1 25 (12.1) 1 0.095 1 0.309 2 27 (15.1) 1.25 (0.75 to 2.07) 1.24 (0.73 to 2.10)
3 33 (16.8) 1.39 (0.86 to 2.25) 1.49 (0.89 to 2.51) 4 37 (17.9) 1.47 (0.92 to 2.36) 1.16 (0.72 to 1.87)
36 wk 1 29 (10.9) 1 0.195 1 0.281 2 38 (15.2) 1.38 (0.88 to 2.16) 1.69 (1.03 to 2.77)
3 30 (14.6) 1.34 (0.83 to 2.16) 1.47 (0.86 to 2.53) 4 33 (15.2) 1.39 (0.88 to 2.22) 1.29 (0.74 to 2.23)
a
Adjusted for parity (primiparous or multiparous), maternal age, sex of fetus, maternal BMI, education, socio-economic score, study site, season at enrolment, gestational age at enrolment, time between waking and saliva collection, and time between last food or drink (except water) and saliva collection, and gestational age at enrolment
b
is responsive to recent events. While we attempted to con-trol for this by standardizing the timing of the sample col-lection during the course of the clinic visit, we were not able to control the timing of arrival of the participants. Thus, the samples were collected throughout the day and we adjusted for time since waking and time since last meal in all of our analyses. Ideally, one would collect multiple samples at standardized times over the course of the day and/or before and after an HPA challenge [53]; however, this was not feasible in this context. Because this measure-ment error was likely non-differential with regard to birth outcomes, the effect size estimates may be biased towards the null and, therefore, are a conservative estimate of the true magnitude of the association between cortisol and birth outcomes. This is supported by the consistency between our study and others on this topic. On the other hand, non-differential measurement error could have masked any true association between the supplement interventions and cortisol concentrations.
Conclusions
We did not observe an effect of maternal supplementa-tion with LNS or MMN on cortisol concentrasupplementa-tions in late gestation among Malawian women. Nevertheless, we found that maternal cortisol concentrations were strongly associated with newborn anthropometric mea-surements and duration of gestation, reiterating findings from studies in other populations regarding the import-ance of this hormone for pregnancy outcomes.
Abbreviations
CRH:Corticotropin-releasing hormone; HCZ: Head circumference-for-age z-score; HPA: Hypothalamic-pituitary-adrenal; IFA: Iron-folic acid supplements; LAZ: Length-for-age z-score; LBW: Low birth weight; LNS: Lipid-based nutrient supplements; MMN: Multiple micronutrient supplements; PSS: Perceived stress scale; SGA: Small for gestational age; TfR: Transferrin receptor; 11-β-HSD2: The 11-β-hydroxysteroid dehydrogenase-2; WAZ: Weight-for-age z-score; ZPP: Zinc protoporpherin.
Competing interests
The authors declare that they have no competing interests.
Authors’contributions
CPS conceived of the sub-study idea and wrote the paper; BMO analyzed the data and analyzed the cortisol samples; KDL oversaw the cortisol samples analysis, contributed to the study design, and interpretation of data; UA was involved in the data collection, translation of forms, and staff training; UH was involved in the data collection and data management; CK was involved in the data collection and establishing study protocols; DC was involved in data collection and quality control; KM, PA, and KGD were members of the iLiNS steering committee, designed the overall study, and designed the sub-study. All authors contributed to drafting the paper and have read and approved the final manuscript.
Acknowledgements
This publication is based on research funded by a grant to the University of California, Davis from the Office of Health, Infectious Diseases, and Nutrition, Bureau for Global Health, U.S. Agency for International Development (USAID) under terms of Cooperative Agreement No. AID-OAA-A-12-00005, through the Food and Nutrition Technical Assistance III Project (FANTA), managed by FHI 360. Additional support was provided by the Bill & Melinda Gates Foundation. This work was also funded by the US Department
of Agriculture’s Agricultural Research Service intramural Project Number 5306–51530-019–00 (principal investigator K.D.L.). The contents of this manuscript are solely the responsibility of the authors and do not represent the official view of the US Department of Agriculture, which is an equal opportunity provider and employer. The authors would also like to acknowledge the dedicated support of Joy Thakwalakwa, Eletina Chilora, Lotta Alho, and Basho Poelman for managing and cleaning the data.
Author details
1Program in International and Community Nutrition, Department of
Nutrition, University of California, Davis, CA, USA.2Western Human Nutrition
Research Center, USDA-ARS, Davis, CA, USA.3Department for International Health, USDA-ARS, Tampere, Finland.4Department of Community Health,
University of Malawi College of Medicine, Blantyre, Malawi.5Department of
Paediatrics, Tampere University Hospital, Tampere, Finland.
Received: 26 May 2015 Accepted: 11 December 2015
References
1. Black RE, Victora CG, Walker SP, Bhutta ZA, Christian P, de Onis M, et al. Maternal and child undernutrition and overweight in low-income and middle-income countries. Lancet. 2013;382(9890):427–51. doi:10.1016/S0140-6736(13)60937-X.
2. Christian P, Lee SE, Donahue Angel M, Adair LS, Arifeen SE, Ashorn P, et al. Risk of childhood undernutrition related to small-for-gestational age and preterm birth in low- and middle-income countries. Int J Epidemiol. 2013; 42(5):1340–55. doi:10.1093/ije/dyt109.
3. Blencowe H, Cousens S, Oestergaard MZ, Chou D, Moller AB, Narwal R, et al. National, regional, and worldwide estimates of preterm birth rates in the year 2010 with time trends since 1990 for selected countries: a systematic analysis and implications. Lancet. 2012;379(9832):2162–72. doi:10.1016/S0140-6736(12)60820-4.
4. Liu L, Johnson HL, Cousens S, Perin J, Scott S, Lawn JE, et al. Global, regional, and national causes of child mortality: an updated systematic analysis for 2010 with time trends since 2000. Lancet. 2012;379(9832): 2151–61. doi:10.1016/S0140-6736(12)60560-1.
5. WHO. Causes of child mortality. 2013. http://www.who.int/gho/child_health/ mortality/causes/en/. Accessed 11 Nov 2014.
6. Romero R, Dey SK, Fisher SJ. Preterm labor: one syndrome, many causes. Science. 2014;345(6198):760–5. doi:10.1126/science.1251816.
7. Christian P. Micronutrients, birth weight, and survival. Annu Rev Nutr. 2010; 30:83–104. doi:10.1146/annurev.nutr.012809.104813.
8. Institute of Medicine. Improving Birth Outcomes: Meeting the Challenge of the Developing World. Washington, DC: The National Academies Press; 2003.
9. Fall CH, Fisher DJ, Osmond C, Margetts BM. Multiple micronutrient supplementation during pregnancy in low-income countries: a meta-analysis of effects on birth size and length of gestation. Food Nutr Bull. 2009;30(4):S533–46.
10. West Jr KP, Shamim AA, Mehra S, Labrique AB, Ali H, Shaikh S, et al. Effect of maternal multiple micronutrient vs iron-folic acid supplementation on infant mortality and adverse birth outcomes in rural Bangladesh: the JiVitA-3 randomized trial. JAMA. 2014;312(24):2649–58. doi:10.1001/jama.2014.16819. 11. WHO. Guideline: Calcium supplementation in pregnant women. Geneva:
World Health Organization; 2013.
12. Hess SY, King JC. Effects of maternal zinc supplementation on pregnancy and lactation outcomes. Food Nutr Bull. 2009;30(1 Suppl):S60–78. 13. Huybregts L, Roberfroid D, Lanou H, Menten J, Meda N, Van Camp J, et al.
Prenatal food supplementation fortified with multiple micronutrients increases birth length: a randomized controlled trial in rural Burkina Faso. Am J Clin Nutr. 2009;90(6):1593–600. doi:10.3945/ajcn.2009.28253. 14. Adu-Afarwuah S, Lartey A, Okronipa H, Ashorn P, Zeilani M, Peerson JM,
et al. Lipid-based nutrient supplement increases the birth size of infants of primiparous women in Ghana. Am J Clin Nutr. 2015;101(4):835–46. doi:10.3945/ajcn.114.091546.
16. Shapiro GD, Fraser WD, Frasch MG, Seguin JR. Psychosocial stress in pregnancy and preterm birth: associations and mechanisms. J Perinatal Med. 2013;41(6):631–45. doi:10.1515/jpm-2012-0295.
17. Giurgescu C. Are maternal cortisol levels related to preterm birth? J Obstet Gynecol Neonatal Nurs. 2009;38(4):377–90. doi:10.1111/j.1552-6909.2009. 01034.x.
18. Voltolini C, Petraglia F. Neuroendocrinology of pregnancy and parturition. Handb Clin Neurol. 2014;124:17–36. doi:10.1016/B978-0-444-59602-4.00002-2. 19. Smith R, Paul J, Maiti K, Tolosa J, Madsen G. Recent advances in understanding
the endocrinology of human birth. Trends Endocrinol Metab. 2012; 23(10):516–23. doi:10.1016/j.tem.2012.05.002.
20. Sandman CA, Glynn L, Schetter CD, Wadhwa P, Garite T, Chicz-DeMet A, et al. Elevated maternal cortisol early in pregnancy predicts third trimester levels of placental corticotropin releasing hormone (CRH): priming the placental clock. Peptides. 2006;27(6):1457–63. doi:10.1016/j.peptides.2005.10. 002. S0196-9781(05)00470-5.
21. Fowden AL, Forhead AJ. Endocrine interactions in the control of fetal growth. Nestle Nutr Inst Workshop Ser. 2013;74:91–102. doi:10.1159/ 000348417.
22. Sferruzzi-Perri AN, Vaughan OR, Forhead AJ, Fowden AL. Hormonal and nutritional drivers of intrauterine growth. Curr Opin Clin Nutr Metab Care. 2013;16(3):298–309. doi:10.1097/MCO.0b013e32835e3643.
23. Bolt RJ, van Weissenbruch MM, Lafeber HN. Delemarre-van de Waal HA. Glucocorticoids and lung development in the fetus and preterm infant. Pediatr Pulmonol. 2001;32(1):76–91.
24. Christian P, Stewart CP. Maternal Micronutrient Deficiency, Fetal Development, and the Risk of Chronic Disease. J Nutr. 2010;140(3):437–45. 25. Moisiadis VG, Matthews SG. Glucocorticoids and fetal programming part 1:
Outcomes. Nature Rev Endocrinol. 2014;10(7):391–402. doi:10.1038/nrendo. 2014.73.
26. Kalantaridou SN, Zoumakis E, Makrigiannakis A, Lavasidis LG, Vrekoussis T, Chrousos GP. Corticotropin-releasing hormone, stress and human reproduction: an update. J Reproduct Immunol. 2010;85(1):33–9. doi:10.1016/j.jri.2010.02.005.
27. Coussons-Read ME, Okun ML, Nettles CD. Psychosocial stress increases inflammatory markers and alters cytokine production across pregnancy. Brain Behav Immun. 2007;21(3):343–50. doi:10.1016/j.bbi.2006.08.006. 28. Coussons-Read ME, Okun ML, Schmitt MP, Giese S. Prenatal stress alters
cytokine levels in a manner that may endanger human pregnancy. Psychosom Med. 2005;67(4):625–31. doi:10.1097/01.psy.0000170331.74960.ad.
29. Davis EP, Sandman CA. The timing of prenatal exposure to maternal cortisol and psychosocial stress is associated with human infant cognitive development. Child Dev. 2010;81(1):131–48. doi:10.1111/j.1467-8624.2009.01385.x.
30. Moisiadis VG, Matthews SG. Glucocorticoids and fetal programming part 2: Mechanisms. Nature Rev Endocrinol. 2014;10(7):403–11. doi:10.1038/nrendo. 2014.74.
31. Gitau R, Cameron A, Fisk NM, Glover V. Fetal exposure to maternal cortisol. Lancet. 1998;352(9129):707–8. doi:10.1016/S0140-6736(05)60824-0. 32. Lesage J, Blondeau B, Grino M, Breant B, Dupouy JP. Maternal undernutrition
during late gestation induces fetal overexposure to glucocorticoids and intrauterine growth retardation, and disturbs the hypothalamo-pituitary adrenal axis in the newborn rat. Endocrinology. 2001;142(5):1692–702. doi:10.1210/endo.142.5.8139.
33. Rosario JF, Anbu Gomez P, Patrick Gomez M. Does the maternal micronutrient deficiency (Cu or Zn or Vit E) modulate the expression of placental 11 beta hydroxysteriod dehydrogenase and per se predispose the offspring to insulin resistance and hypertension in later life? Pediatr Res. 2005;58(5):1035. 34. Tomiyama AJ, Mann T, Vinas D, Hunger JM, Dejager J, Taylor SE. Low calorie
dieting increases cortisol. Psychosom Med. 2010;72(4):357–64. doi:10.1097/ PSY.0b013e3181d9523c.
35. Friedl KE, Moore RJ, Hoyt RW, Marchitelli LJ, Martinez-Lopez LE, Askew EW. Endocrine markers of semistarvation in healthy lean men in a multistressor environment. J Applied Physiol. 2000;88(5):1820–30.
36. Fernald LC, Grantham-McGregor SM. Stress response in school-age children who have been growth retarded since early childhood. Am J Clin Nutr. 1998;68(3):691–8.
37. Fernald LC, Grantham-McGregor SM. Growth retardation is associated with changes in the stress response system and behavior in school-aged Jamaican children. J Nutr. 2002;132(12):3674–9.
38. Fernald LC, Grantham-McGregor SM, Manandhar DS, Costello A. Salivary cortisol and heart rate in stunted and nonstunted Nepalese school children. Eur J Clin Nutr. 2003;57(11):1458–65. doi:10.1038/sj.ejcn.1601710.
39. Christian P, Nanayakkara-Bind A, Schulze K, Wu L, LeClerq SC, Khatry SK. Antenatal micronutrient supplementation and third trimester cortisol and erythropoietin concentrations. Matern Child Nutr. 2014. doi:10.1111/mcn.12138. 40. Cohen S, Kamarck T, Mermelstein R. A global measure of perceived stress.
J Health Soc Behav. 1983;24(4):385–96.
41. Rondo PH, Ferreira RF, Nogueira F, Ribeiro MC, Lobert H, Artes R. Maternal psychological stress and distress as predictors of low birth weight, prematurity and intrauterine growth retardation. Eur J Clin Nutr. 2003;57(2): 266–72. doi:10.1038/sj.ejcn.1601526.
42. Beard JL, Hendricks MK, Perez EM, Murray-Kolb LE, Berg A, Vernon-Feagans L, et al. Maternal iron deficiency anemia affects postpartum emotions and cognition. J Nutr. 2005;135(2):267–72.
43. Coates J, Swindale A, Bilinsky P. Household Food Insecurity Access Scale (HFIAS) for Measurement of Food Access: Indicator Guide. Washington, DC: Academy for Educational Development, Food and Nutrition Technical Assistance Project (FANTA)2007; 2007.
44. Vyas S, Kumaranayake L. Constructing socio-economic status indices: how to use principal components analysis. Health Policy Plan. 2006;21(6):459–68. doi:10.1093/heapol/czl029. czl029.
45. Alexander GR, Himes JH, Kaufman RB, Mor J, Kogan M. A United States national reference for fetal growth. Obstet Gynecol. 1996;87(2):163–8. 46. Schafer JL. Multiple imputation: a primer. Stat Methods Med Res. 1999;
8(1):3–15.
47. Huybregts L, Roberfroid D, Lanou H, Meda N, Taes Y, Valea I, et al. Prenatal lipid-based nutrient supplements increase cord leptin concentration in pregnant women from rural Burkina Faso. J Nutr. 2013;143(5):576–83. doi:10.3945/jn.112.171181.
48. Roberfroid D, Huybregts L, Lanou H, Henry MC, Meda N, Kolsteren FP, et al. Effect of maternal multiple micronutrient supplements on cord blood hormones: a randomized controlled trial. Am J Clin Nutr. 2010;91(6): 1649–58. doi:10.3945/ajcn.2009.28855.
49. Christian P, Khatry SK, Katz J, Pradhan EK, LeClerq SC, Shrestha SR. Effects of alternative maternal micronutrient supplements on low birth weight in rural Nepal: double blind randomised community trial. BMJ. 2003;326(7389):571. 50. Oaks BM, Laugero KD, Stewart CP, Adu-Afarwuah SM, Lartey A, Ashorn P,
et al. Late pregnancy salivary cortisol concentrations of Ghanaian women participating in a randomized controlled trial of prenatal lipid based nutrient supplements. J Nutr. 2016 (in press).
51. Bellavance MA, Rivest S. The HPA - Immune Axis and the
Immunomodulatory Actions of Glucocorticoids in the Brain. Front Immunol. 2014;5:136. doi:10.3389/fimmu.2014.00136.
52. de Weerth C, Buitelaar JK. Physiological stress reactivity in human pregnancy–a review. Neurosci Biobehav Rev. 2005;29(2):295–312. doi:10.1016/j.neubiorev. 2004.10.005.
53. Kudielka BM, Gierens A, Hellhammer DH, Wust S, Schlotz W. Salivary cortisol in ambulatory assessment–some dos, some don'ts, and some open questions. Psychosom Med. 2012;74(4):418–31. doi:10.1097/PSY.0b013e31825434c7.
• We accept pre-submission inquiries
• Our selector tool helps you to find the most relevant journal
• We provide round the clock customer support
• Convenient online submission
• Thorough peer review
• Inclusion in PubMed and all major indexing services
• Maximum visibility for your research
Submit your manuscript at www.biomedcentral.com/submit