TECHNICAL REPORT
The ERG Science Center
Yoshizumi Miyoshi
1*, Tomoaki Hori
1, Masafumi Shoji
1, Mariko Teramoto
1, T. F. Chang
1, Tomonori Segawa
1,
Norio Umemura
1, Shoya Matsuda
2, Satoshi Kurita
1, Kunihiro Keika
3, Yukinaga Miyashita
4, Kanako Seki
3,
Yoshimasa Tanaka
5, Nozomu Nishitani
1, Satoshi Kasahara
3, Shoichiro Yokota
2, Ayako Matsuoka
2,
Yoshiya Kasahara
6, Kazushi Asamura
2, Takeshi Takashima
2and Iku Shinohara
2Abstract
The Exploration of energization and Radiation in Geospace (ERG) Science Center serves as a hub of the ERG project, providing data files in a common format and developing the space physics environment data analysis software and plug-ins for data analysis. The Science Center also develops observation plans for the ERG (Arase) satellite according to the science strategy of the project. Conjugate observations with other satellites and ground-based observations are also planned. These tasks contribute to the ERG project by achieving quick analysis and well-organized conjugate ERG satellite and ground-based observations.
© The Author(s) 2018. This article is distributed under the terms of the Creative Commons Attribution 4.0 International License (http://creat iveco mmons .org/licen ses/by/4.0/), which permits unrestricted use, distribution, and reproduction in any medium, provided you give appropriate credit to the original author(s) and the source, provide a link to the Creative Commons license, and indicate if changes were made.
Introduction
The Exploration of energization and Radiation in Geo-space (ERG) project investigates radiation belt and geo-space storm dynamics. The ERG (Arase) satellite was launched in December 2016 and began observations in March 2017. The satellite includes nine scientific instru-ments that provide various types of data for measuring plasma and particles over a wide energy range, as well as fields and waves over wide frequency ranges (Miyoshi et al. 2018).
However, for a comprehensive geospace investigation, ground-based observations and multi-point observa-tions from the satellite are equally important. The ERG project, therefore, includes both satellite and ground-based observation teams. Ground-ground-based observations are obtained from Super Dual Auroral Radar Network (SuperDARN) high-frequency (HF) radars, European Incoherent Scatter Scientific Association (EISCAT) radar, magnetometers, very low-frequency (VLF)/ELF (extremely low-frequency) loop antennas, riometers, VLF/low-frequency (LF) radio wave receivers, and opti-cal imagers (Shiokawa et al. 2017).
Comparing simulations with observations is important to determine causal relationships and increase our quan-titative understanding of various geospace phenomena. Hence, the project also involves a team that manages simulation and integrated studies (Seki et al. 2018).
However, it is not always easy to employ multiple datasets to their full potential, because it is difficult to learn the different types of data file formats and develop the necessary tools to access and process the relevant data for detailed analysis. Using common data formats and analysis tools can solve this problem. For exam-ple, the National Aeronautics and Space Administration (NASA)/Common Data Format (CDF) has standardized data storage and data access considerably. The solar–ter-restrial physics community has developed common data analysis software, including the Space Physics Environ-ment Data Analysis Software (SPEDAS), to analyze dif-ferent data types for integrated studies. SPEDAS was originally developed for the Time History of Events and Macroscale Interactions during Substorms (THEMIS) mission and was known as the THEMIS Data Analysis Software (TDAS) (Angelopoulos 2008). This software is a suite of scientific analysis routines written in the Inter-active Data Language (IDL). To promote accessibility for the space research community, other satellite projects, including the Magnetospheric Multiscale (MMS) mission (Burch et al. 2016) and Van Allen probes (Mauk et al.
2013), provided their own programs as SPEDAS plug-ins,
Open Access
*Correspondence: [email protected]
1 Institute for Space-Earth Environmental Research, Nagoya University, Nagoya 464-8601, Japan
by developing and customizing the SPEDAS code to ena-ble seamless collaborative data sharing among missions.
Considering these advantages, the ERG project has archived its project data in CDF format and made these files accessible on the Internet. The ERG project has cooperated with the Inter-university Upper Atmosphere Global Observation NETwork (IUGONET) (Hayashi et al. 2013; Tanaka et al. 2013) to develop SPEDAS plug-ins for ground-based observation data. It has also coop-erated with the THEMIS project to develop SPEDAS plug-ins to serve as common data analysis software across project teams (Hori et al. 2015). These include not only software to download data files from the remote data server, but also several tools to aid in data analysis, such as plasma dispersion solvers.
In order to coordinate observations made by the ERG satellite, on the ground, and by other satellites, it is neces-sary to properly organize the observation modes of the ERG satellite. The plasma wave experiment (PWE)/wave-form capture (WFC) (Kasahara et al. 2018b; Matsuda et al. 2018) and Software-type wave –particle interaction analyzer (S-WPIA) (Katoh et al. 2017; Hikishima et al.
2018) have intermittently performed waveform obser-vations along a satellite orbit. Waveform data of plasma waves are important for studying wave–particle interac-tions through detailed comparisons with the ground-based optical and wave observations (Shiokawa et al.
2017). The waveform data would accumulate more than 6 GB if always recorded along a satellite orbit. As a nomi-nal case, the possible downlink budget available for the
waveform data is approximately 700 Mb per day. There-fore, it is necessary to strategically select limited periods of waveform observations, taking into account the satel-lite orbit, conjunction periods with ground-based obser-vations and other satellites, size of the data recorder, and the telemetry downlink plan.
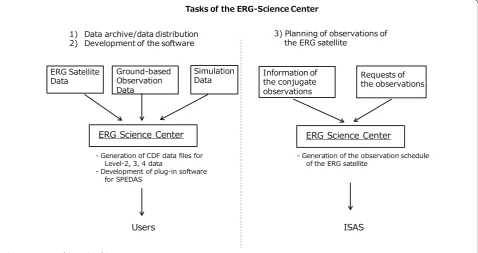
The ERG project established the ERG Science Center (ERG-SC), which is operated by the Institute of Space and Astronautical Science (ISAS)/Japan Aerospace Exploration Agency (JAXA) and the Institute for Space-Earth Environmental Research (ISEE), Nagoya Univer-sity. The main tasks of the ERG-SC are (1) to archive and distribute data to both research teams and the public, (2) to develop research software as SPEDAS plug-ins, and (3) to plan the operation of the ERG satellite and arrange for coordinated studies among ERG, other satellites, and ground-based observations. Figure 1 shows a summary of ERG-SC tasks in the ERG project. In this paper, we pro-vide an overview of the ERG-SC and several examples of its tasks.
Design of ERG data archive
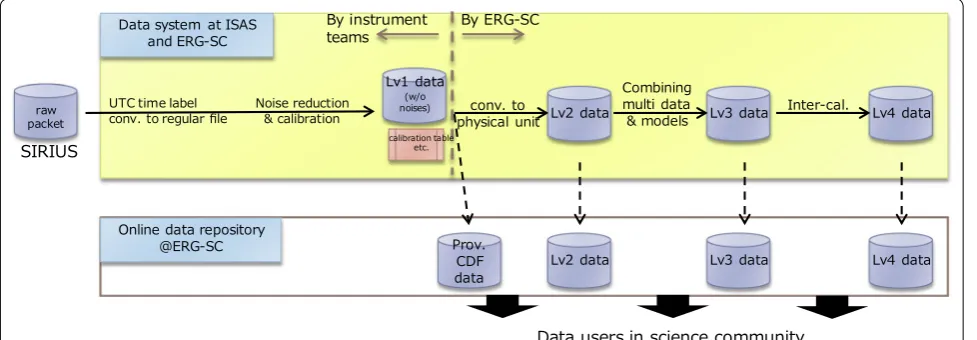
The ERG satellite has continuously conducted obser-vations and produced scientific and engineering data, which are downlinked to ground tracking stations every day. Figure 2 summarizes how these data are processed and delivered to end users. All raw data packets received by the multiple ground stations are first merged into the telemetry database of the Scientific Information Retrieval and Integrated Utilization System (SIRIUS) of ISAS
(Nomura et al. 1983). Then, the server of ISAS extracts the raw data for each onboard scientific instrument and converts them to regular files in predefined formats, stor-ing observed data in instrument-origin units. After data processing by the instrument teams, the data files are transferred to the data processing system of the ERG-SC, where multiple datasets are combined with additional information to produce scientific data at several process-ing levels. Durprocess-ing this file rearrangement, scientific data are converted to physical units. At this stage, necessary data evaluation and calibrations are conducted, resulting in datasets that can be used for scientific data analyses. Finally, the generated data products will be made avail-able to users on the ERG-SC Web site (https ://ergsc .isee. nagoy a-u.ac.jp).
Over the course of the data production pipeline described above, data are categorized into several prede-fined processing levels. Raw packet data received from the satellite and archived on SIRIUS are referred to as Level-0. Level-1 data are converted to regular files on the refor-matting system at ISAS. Level-1 data carry time labels converted to Coordinated Universal Time (UTC), while observed data values are stored in instrument-dependent
units. Further processes at the ERG-SC, including data calibration, generate Level-2 data. Unlike Level-1 data, Level-2 data have been assigned standard physical units as well as some geophysical coordinates. Data up to Level-2 are generated solely from Level-1 data of a sin-gle instrument. Level-3 data are the merged products of multiple Level-2 data points from different instruments. A typical example is pitch angle distributions of particle fluxes, which merges particle flux data from a particle instrument and magnetic field data from the magnetic field experiment (MGF) (Matsuoka et al. 2018). Another example is electron density data that are deduced using frequency traces of upper hybrid resonance observed by the PWE instrument (Kasahara et al. 2018b; Kumamoto et al. 2018) and MGF data. Level-3 particle data also go through inter-instrument calibrations to produce parti-cle flux and phase space density data of electrons over a combined energy range of ~ 20 eV to more than 10 MeV. These data are referred to as Level-4 data.
Figure 3 outlines the data production pipeline for the ERG scientific data arranged by data processing level. In principle, scientific data are processed in order of increasing level. The instrument teams and the ERG-SC Fig. 2 Overview of the data processing flow for the ERG satellite data
share tasks regarding the development and actual opera-tion of these pipeline processes. Each instrument team is primarily responsible for the production of Level-1 data, while the ERG-SC is responsible for the production and archiving of Level-2 and higher-level data.
After necessary calibrations and data evaluation, Level-2, 3, and 4 data are made available on the ERG-SC Web site, which users can access online, as shown in Fig. 4. Integrated data analysis tools developed by the ERG-SC using SPEDAS, which are described in detail in the next section, can be also used to download these data files from the ERG-SC Web site.
Level-2 and higher-level data are archived as CDF data files (Hori et al. 2015). CDF supports various data types and data structures and allows data files to carry vari-ous forms of metadata. It also guarantees inter-operabil-ity independent of operating system and endian type of variables. In addition to its functionality, another bene-fit of archiving the project data in CDF is that CDF has become one of the de facto standard file formats of the solar–terrestrial physics community and the data in CDF are easily available in several software programs.
The ERG-SC has defined the standardized contents of data variables and metadata for data files archived in CDF. These standardized contents are used for both sat-ellite observation data and ground-based observation data. In the past, many projects used their own data for-mats and data variable structures, which made it difficult for data users to combine data from different types of instruments in their data analyses. For example, the time label format often varies from project to project, and dif-ferent observational data carry numerical values in differ-ent forms and are grouped into data files with differdiffer-ent lengths. In fact, ERG satellite data and ground-based
observational data were also provided in different for-mats/styles/granularity according to each instrument and observation team. In order to overcome this difficulty, the time label format is standardized by CDF epoch and data values are converted to the physical unit that can be directly used for data analysis. Moreover, the data format is rearranged in a simple and straightforward sequential order. The ERG-SC has unified them into our standard-ized data format and added common metadata. As a result, the data files contain ancillary information as metadata that are necessary for not only SPEDAS data analysis but other data analysis software. On the basis of discussions with the instrument and observation teams, the ERG-SC identified necessary ancillary information and defined the common metadata list to accommodate all necessary information. The designed metadata list was partly reported by the literature (Hori et al. 2015). Meta-data also include information on the names of the origi-nal data and the programs with version ID to generate the CDF files. This information guarantees the traceability of the data version for both data users and the data archive center. Hence, these unified data archives, with the inte-grated data analysis tools described in the next section, allow data users to combine and analyze different types of data in a truly seamless way.
In general, the data center must overcome common dif-ficulties, such as data file preservation and data transfer issues. For the ERG project data, the total size of pos-sible data from both satellite and ground-based net-work observations is expected to be several tens of TB, and they can be processed without serious difficulty by utilizing commonly used computers and disk systems. Furthermore, the speed of commonly installed inter-uni-versity networks such as the Science Information NET-work (SINET) is not a bottleneck for data transfer from the ERG-SC to other universities and institutes.
As mentioned, the ERG-SC archives many types of data files and should control the version of the data file. For example, the number of satellite data product types is more than hundred, and the number of ground-based observation data product types is several hundreds. Because these data are irregularly transferred to the ERG-SC from each instrument and observation team, it is not easy to manage, archive, and deliver such various files of data to users. In order to overcome these difficul-ties, the ERG-SC developed a system to automatize the process of data production to the maximum extent pos-sible. As discussed in Fig. 3, we have developed and con-nected many modules of data processing into a pipeline system which can facilitate all data processing from the raw observation data of each instrument and observa-tion team to the scientific data files. The actual imple-mentation of the system is made as much as possible with Fig. 4 Screenshot of a web browser viewing the ERG satellite data
common routines of SPEDAS and IDL. Use of the single software language, which has also been widely used for scientific data analyses, enables efficient development of program codes and contributes to substantially reducing the time spent on development and maintenance work.
For data file preservation, a standardized data file con-taining all types of necessary information can contribute to this issue because a single data file carries all the nec-essary information for scientific analysis. The practical information contained in data files, such as file names with version numbers of the source data files, and com-puter codes to generate data files, enables automatic pro-cessing of data files in many tasks for maintenance of the data archive. In addition to these efforts, the data files are synchronized between the ERG-SC at Nagoya University and ISAS/JAXA for redundancy.
Data analysis tools for the ERG project
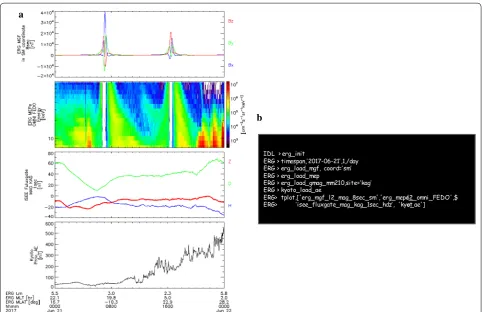
The ERG-SC has also released software to load and ana-lyze data obtained by the ERG satellite, as described in “Design of ERG data archive” section, in the form of plug-in software libraries for SPEDAS (Hori et al. 2015). Figure 5 shows an example of visualizing multiple data using SPEDAS and the plug-ins. Figure 5a shows mag-netic field data in the solar magmag-netic (SM) coordinate system obtained by the MGF instrument, omnidirec-tional electron flux data observed by the medium-energy particle experiments—electron analyzer (MEP-e) instru-ment (Kasahara et al. 2018a) onboard ERG, geomagnetic field data at Kagoshima (KAG: 31.48N geographic lati-tude and 130.72E longilati-tude, Yumoto et al. 1996), and the provisional AE index on June 21, 2017. This plot combin-ing multiple data is created uscombin-ing only a few commands of SPEDAS and the plug-in shown in Fig. 5b. Using “erg_ init” in the command line, the environment for loading ERG data is set up. The “timespan” command included in the SPEDAS core routines is used for designating the date. The magnetic field and electron flux data saved in CDF files are loaded and stored as “tplot variables” using load procedures “erg_load_mgf” and “erg_load_mep,” which are available in the ERG plug-ins. The geomagnetic field data observed by a fluxgate magnetometer at KAG, and the provisional AE data, which are provided by the World Data Center for Geomagnetism, Kyoto, are loaded using “erg_load_gmag_mm210” and “kyoto_load_ae.” All “tplot variables” are plotted using the “tplot” command, one of the SPEDAS core routines. Using only seven com-mands of SPEDAS and the plug-ins, we can seamlessly visualize data observed by the ERG satellite and ground-based instruments. Thus, this tool encourages collabo-rative studies using not only ERG satellite data but also ERG-ground network and other project data.
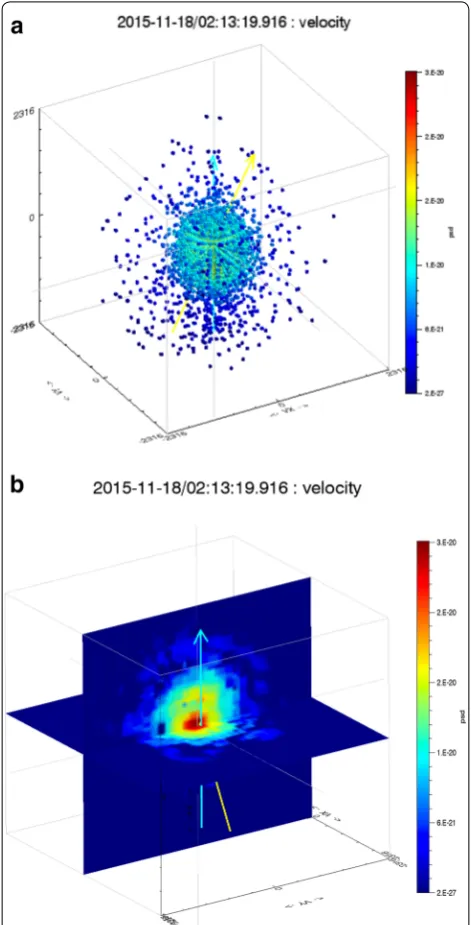
As a new attempt for the space plasma physics, the ERG-SC developed ISEE_3D, an interactive visualization tool for the three-dimensional plasma velocity distribu-tion funcdistribu-tion (Keika et al. 2017). This tool provides a vari-ety of visualization methods for the distribution function of space plasma; scatter, volume, and iso-surface visuali-zation. ISEE-3D has been included in the bleeding edge of SPEDAS as it is capable of loading plasma data from the magnetospheric multiscale (MMS) mission. Exam-ples of 3-D ion distribution visualizations are shown in Fig. 6. For these 3-D distributions, ions with energies of 10 eV to 30 keV and the magnetic field observed by the fast plasma investigation (FPI) instrument (Pollock et al.
2016) and the fluxgate magnetometer (FGM) (Russell et al. 2016) are applied. Figure 6a, b presents the 3-D ion distributions in scatter mode and the 2-D slice of dis-tributions for 02:13:19.916 UT on November 18, 2015, respectively. Cyan and yellow arrows represent the direc-tions of the magnetic field and velocity vector. Note that this tool will be applied to data obtained from the ERG satellite after L2 particle data are released.
The ERG-SC has also implemented the SPEDAS GUI plug-in package of the Kyoto University Plasma Disper-sion Analysis Package (KUPDAP) (Sugiyama et al. 2015), which is a plasma dispersion solver. The main engine original KUPDAP code was developed by the space group of the Research Institute for Sustainable Humanosphere (RISH), Kyoto University. Figure 7a shows a control panel of KUPDAP in IDL. Figure 7b is an example diagram of the wave frequency and wave number (ω–k diagram) and linear growth rate as a function of frequency and wave number on the electromagnetic ion cyclotron (EMIC) waves. This plug-in package has been used in various studies of plasma waves (Uchino et al. 2017; Shoji and Omura 2017) as a function of SPEDAS.
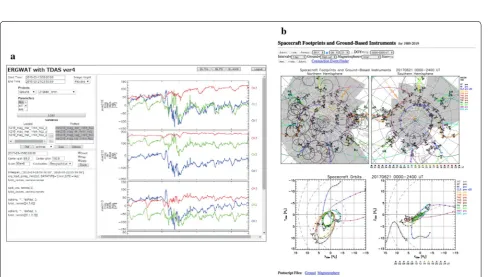
As well as software in SPEDAS, the ERG-SC has developed two tools that run on a web browser. One is the ERG Web Analysis Tool (ERGWAT), which can be used for interactive data visualization and analysis on a web browser, as shown in Fig. 8a (Umemura et al. 2017). Another tool is the Conjunction Event Finder (CEF) shown in Fig. 8b (Miyashita et al. 2011). CEF provides orbits and footprints of ERG and other satellites and information on ground-based instruments, which can be used to confirm the relative locations between satel-lites and ground-based observations and to produce the operation schedule.
Science operation planning
depending on various factors such as L-shell, magnetic latitude of the satellite position, so that planning of the science operation based on the predicted orbit is neces-sary. In addition to the nominal observations, the ERG satellite has burst mode operation modes for PWE/ WFC and S-WPIA. Data from the burst observations of PWE/WFC and S-WPIA are first stored in the mission data recorders (MDR) and subsequently downloaded to the ground through the system data recorder (SDR) (Takashima et al. 2018). Note that the size of MDR and SDR is 32 GB and 2 GB, respectively.
The observation schedules for the ERG satellite are first drafted by the ERG-SC using information on the satel-lite orbit, the Earth’s shadowing, and the electric power available onboard. The sampling frequency for PWE and MGF instruments and the time resolution of particle instruments vary for each orbit. Intermittent chorus and EMIC burst observations of PWE/WFC and S-WPIA are also conducted, and plans are scheduled for the burst mode operations.
Besides the default observation schedules, conjugate observations with ground-based instruments and other
satellites such as Van Allen Probes are often planned, in which PWE/WFC and S-WPIA are included. The drafted schedule files are reviewed by the instrument teams and then the finalized files are sent to the satellite tracking center in ISAS where they are converted to a command plan used to operate the satellite. If any problem is found in the schedule files, they are updated to satisfy the feasi-ble operation conditions.
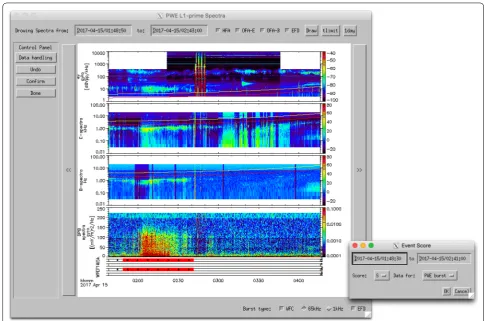
As mentioned in “Introduction” section, the expected amount of waveform data is more than 6 GB if recorded along a satellite orbit, while the potential amount of downlink data for waveform data along a satellite orbit is approximately 700 MB per day. Thus, it is necessary to select periods for the waveform observations, taking into account the size of the data recorder and the telemetry downlink plan. The frequency–time spectrogram data of the PWE/onboard frequency analyzer (OFA) are quickly reviewed to select time periods for the burst observations of PWE/WFC and S-WPIA that require downlinking for further scientific analyses. Figure 9 shows an example of the tool for data selection. This tool shows PWE/OFA data that are used to examine an overview of the plasma
b a
wave observations and identifies the period when the ERG satellite observes plasma waves of interest, such as chorus, hiss, and other types of plasma wave. Those peri-ods of interest are preferentially selected and then trans-ferred to SDR.
The possible data size for MDR to SDR transfer depends on the downlink plan from the satellite to the ground; therefore, the selection of burst observations of PWE/WFC and S-WPIA has to consider actual estimates of the downlink data size. Occasionally, the potential amount of downlink data for the waveform observations
is small, less than 500 MB per day. If the downlink data amount can be estimated before uploading the schedule file to the satellite, we can reduce the operation periods for WFC and S-WPIA in the schedule file. On the other hand, if we know the possible downlink data amount after uploading the schedule file to the satellite, observa-tions of WFC and S-WPIA are made and stored in MDR. In this case, because the potential amount of downlink data to the ground is smaller than the typical amount, careful data selection is required by looking at the PWE/ OFA data and deleting some wave form data from MDR.
Concluding remarks
This paper provides an overview of the ERG-SC. The tasks of the ERG-SC include: (1) archiving data from the ERG satellite, ground-based instruments, and modeling/ simulation; (2) developing SPEDAS plug-in software for data analysis and visualization of various data file types; and (3) scheduling observations and data downlinks from the satellite.
The data processing pipelines in this system employ commonly used software/languages, such as IDL, C, and UNIX shell. Thus, implementing these processes in various cloud-computing systems is technically feasible. In fact, the Center for Integrated Data Analysis Science (CIDAS), ISEE, Nagoya University, has been operating a cloud system in which users can use SPEDAS to analyze the ERG satellite data, ground-based observations, and other satellite data by connecting from their remote ter-minals. Use of a cloud system has great merit for users in that they do not need computer resources with large memory and a high CPU clock speed. Thus, cloud sys-tems will be a useful computer environment for the large data quantity and varied data types included in the ERG-SC data archive.
The ERG-SC works as a hub for the ERG project by unifying management of data CDF files for different observations and modeling/simulation and integrated data analysis software to seamlessly visualize and analyze different types of data. As integrated data analysis is a key for a comprehensive understanding of phenomena that occur simultaneously at different locations, which are observed by several satellites and ground-based instru-ments, the ability to develop tools for such analyses is essential.
Because SPEDAS is a standard software package used across the space physics community, SPEDAS plug-ins contribute to providing a seamless data analysis envi-ronment across different projects. The ERG project has collaborated with the THEMIS team to develop and enhance SPEDAS by generating plug-in software that allows researchers to not only download files from the ERG project, but also perform advanced analysis, such Fig. 6 Examples of ISEE_3D. a Scatter plot and b 2-D slice plot for
as ISEE_3D and KUPDAP. It is worth mentioning sci-ence centers of other geospace projects. As an exam-ple of related geospace missions, the NASA/Van Allen Proves mission comprises science operation centers
(SOC) for each instrument, and each SOC provides its own database and software for data analysis (e.g., Kletz-ing et al. 2013; Spence et al. 2013). Similar to the ERG-SC, science data files are archived in CDF format and Fig. 7 a Control panel of KUPDAP GUI package. b Example of output panel. The frequency–wave number, the growth rate–frequency, and the growth rate–wave number plots are displayed
these CDF files can be accessed via the internet, so that users can use appropriate software for their analysis. This is a good example of the benefits of using standardized data files. Software like SPEDAS can read and manipu-late data in CDF files from both the ERG project and Van Allen Probes, which is helpful for analyzing phenom-ena from various angles by integrating different types of data. The developed software, combining different data types, will be an important legacy for future space sci-ence missions. The ERG-SC thus contributes to achiev-ing the scientific objectives of the ERG project, providachiev-ing new insights into the dynamics of radiation belts and the inner magnetosphere.
Authors’ contributions
YM is the manager of the ERG-SC and the project scientist of the geospace exploration project ERG. TH is the sub-manager of the ERG-SC and takes a lead of the development of CDF files for HEP, MEPs and Super Dual Auroral Radar Network (SuperDARN) and related ground-based data and development of SPEDAS plug-in. MS is a member of the ERG-SC and takes a lead of the devel-opment of CDF files for PWE, KUPDAP, and simulation data. MT is a member of the ERG-SC and takes a lead of XEP and MGF. TC is a member of the ERG-SC and takes a lead of LEP-e and the orbit/attitude files. TS and NU are engineers
at the ERG-SC to develop several tools and operate computer resource. SM is a member of the ERG-SC and develops tools for plasma waves analysis and the data manager of ERG/PWE. SK is a member of the ERG-SC and supports to develop CDF files for Arase and ground-based data. KK is a member of the ERG-SC and takes a lead of development for ISEE_3D and CDF files for MEP and orbit file. YM was a member of the ERG-SC and took a lead of develop-ment of MGF and XEP and CEF. KS is a member of the ERG-SC and supports to develop tools. YT is a member of IUGONET and has collaborated with the ERG-SC. SK is the PI of MEP-e. SY is the PI of MEP-i. AM is the PI of MGF. YK is the PI of PWE. NN is a member of the ERG-SC and suggests developing CDF files. KA is a member of the ERG-SC and the lead manager of the science instruments of the Arase satellite. TT is a member of the ERG-SC and the mission manager of the Arase project. IS is a member of the ERG-SC and the project manager of the Arase project. All authors read and approved the final manuscript
Author details
1 Institute for Space-Earth Environmental Research, Nagoya University, Nagoya 464-8601, Japan. 2 Institute of Space and Astronautical Science, Japan Aerospace Exploration Agency, Sagamihara 252-0222, Japan. 3 Gradu-ate School of Science, University of Tokyo, Tokyo 113-0033, Japan. 4 Korea Astronomy and Space Science Institute, 776 Daedeokdae-ro, Yuseong-gu, Daejeon 34055, Republic of Korea. 5 National Institute for Polar Research, Tachi-kawa 190-8518, Japan. 6 Kanazawa University, Kanazawa 920-1192, Japan.
Acknowledgements
The authors thank Vassilis Angelopoulos and the THEMIS team for developing SPEDAS. The authors also thank the IUGONET project for collaborations on development of SPEDAS.
Competing interests
The authors declare that they have no competing interest.
Availability of data and materials
All science data of the ERG project are distributed by the ERG-SC (https ://ergsc .isee.nagoy a-u.ac.jp/index .shtml ). MMS data are provided from MMS Science Data Center (https ://lasp.color ado.edu/mms/sdc/publi c/). The AE index is provided from WDC for Geomagnetism, Kyoto (http://wdc.kugi.kyoto -u.ac.jp/ aedir /).
Ethics approval and consent to participate
Not applicable.
Funding
The ERG Science Center is operated by ISAS/JAXA and ISEE/Nagoya University.
Publisher’s Note
Springer Nature remains neutral with regard to jurisdictional claims in pub-lished maps and institutional affiliations.
Received: 4 September 2017 Accepted: 23 May 2018
References
Angelopoulos V (2008) The THEMIS mission. Space Sci Rev 141:5–34. https :// doi.org/10.1007/s1121 4-008-9336-1
Burch JL, Moore TE, Torbert RB, Giles BL (2016) Magnetospheric multiscale overview and science objectives. Space Sci Rev 199:5–21
Hayashi H, Koyama Y, Hori T, Tanaka Y, Abe S, Shinbori A, Kagitani M, Kouno T, Yoshida D, UeNo S, Kaneda N, Yoneda M, Umemura N, Tadokoro H, Motoba T, IUGONET project team (2013) Inter-university upper atmos-phere global observation network (IUGONET). Data Sci J 12:WDS179– WDS184. https ://doi.org/10.2481/dsj.WDS-030
Hikishima M, Kojima H, Katoh Y, Kasahara Y, Kasahara S, Mitani T, Higashio N, Matsuoka A, Miyoshi Y, Asamura K, Takashima T, Yokota S, Kitahara M, Matsuda S (2018) Data processing in software-type wave-particle interac-tion analyzer on board the Arase satellite. Earth Planets Space. https ://doi. org/10.1186/s4062 3-018-0856-y
Hori T, Miyashita Y, Miyoshi Y et al (2015) CDF data archive and integrated data analysis platform for ERG-related ground data developed by ERG science center (ERG-SC). J Space Sci Inf Jpn 4:75–89. ISSN 1349-1113.
(JAXA-RR-14-009)
Kasahara S, Yokota S, Mitani T, Asamura K, Hirahara M, Shibano Y, Takashima T (2018a) Medium-energy particle experiments-electron analyzer (MEP-e) for the exploration of energization and radiation in geospace (ERG) mis-sion. Earth Planets Space. https ://doi.org/10.1186/s4062 3-018-0847-z Kasahara Y, Kasaba Y, Kojima H, Yagitani S, Ishisaka K, Kumamoto A, Tsuchiya
F, Ozaki M, Matsuda S, Imachi T, Miyoshi Y, Hikishima M, Katoh Y, Ota M, Shoji M, Matsuoka A, Shinohara I (2018b) The plasma wave experiment (PWE) on board the Arase (ERG) satellite. Earth Planets Space. https ://doi. org/10.1186/s4062 3-018-0842-4
Katoh Y, Kojima H, Hikishima M, Takazhima T, Asamura K, Miyoshi Y, Kasahara S, Mitani T, Higashio N, Matsuoka A, Ozaki M, Yagitani S, Yokota S, Matsuda S, Kitahara M, Shinohara I (2017) Software-type wave-particle interaction analyzer on board the Arase satellite. Earth Planets Space 70:4. https ://doi. org/10.1186/s4062 3-017-0771-7
Keika K, Miyoshi Y, Machida S et al (2017) A visualization tool for three-dimensional plasma velocity distributions (ISEE_3D) as a plug-in tool for SPEDAS. Earth Planets Space 69:170. https ://doi.org/10.11896 /s4062 3-017-9761-9
Kletzing CA et al (2013) The electric and magnetic field instrument suite and integrated science (EMFISIS) on RBSP. Space Sci Rev. https ://doi. org/10.1007/978-1-4899-7433-4_5
Kumamoto A, Tsuchiya F, Kasahara Y, Kasaba Y, Kojima H, Yagitani S, Ishisaka K, Imachi T, Ozaki M, Matsuda S, Shoji M, Matsuoka A, Katoh Y, Miyoshi Y, Obara T (2018) High frequency analyzer (HFA) of plasma wave experi-ment (PWE) onboard the Arase spacecraft. Earth Planets Space. https :// doi.org/10.1186/s4062 3-018-0854-0
Matsuda S, Kasahara Y, Kojima H, Kasaba Y, Yagitani S, Ozaki M, Imachi T, Ishi-saka K, Kumamoto A, Tsuchiya F, Ota M, Kurita S, Miyoshi Y, Hikishima M, Matsuoka A, Shinohara I (2018) Onboard software of plasma wave experi-ment aboard Arase: instruexperi-ment manageexperi-ment and signal processing of wave form capture/onboard frequency analyzer. Earth Planets Space. https ://doi.org/10.1186/s4062 3-018-0830-0
Matsuoka A, Teramoto M, Nomura R, Nose M, Fujimoto A, Tanaka Y, Shinohara M, Nagatsuma T, Shiokawa K, Obana Y, Miyoshi Y, Mita M, Takashima T, Shinohara I (2018) The Arase (ERG) magnetic field investigation. Earth Planets Space. https ://doi.org/10.1186/s4062 3-018-0800-1
Mauk BH, Fox NJ, Kanekal SG, Kessel RL, Sibeck DG, Ukhorskiy A (2013) Science objectives and rationale for the radiation belt storm probes mission. Space Sci Rev. https ://doi.org/10.1007/s1121 4-012-9908-y
Miyashita Y, Shinohara I, Fujimoto M, Hasegawa H, Hosokawa K, Takada T, Hori T (2011) A powerful tool for browsing quick-look data in solar-terrestrial physics: “conjunction event finder”. Earth Planets Space. https ://doi. org/10.5047/eps.2011.01.003
Miyoshi Y, Shinohara I, Takashima T, Asamura K, Higashio N, Mitani T, Kasahara S, Yokota S, Kazama Y, Wang S-Y, Tam SW, Ho PTP, Kasahara Y, Kasaba Y, Yagitani S, Matsuoka A, Kojima H, Katoh H, Shiokawa K, Seki K (2018) Geospace exploration project ERG. Earth Planets Space. https ://doi. org/10.1186/s4062 3-018-0862-0
Nomura T, Sekiguchi Y, Kato T (1983) On the scientific information retrieval and integrated utilization system. In: Proceedings of symposium on scientific satellites, institute of space and astronautical science, pp 37–40 Pollock C, Moore T, Jacques A et al (2016) Fast plasma investigation for
magne-tospheric multiscale. Space Sci Rev 199:331–406. https ://doi.org/10.1007/ s1121 4-016-0245-4
Russell CT, Anderson BJ, Baumjohann W et al (2016) The magnetospheric multiscale magnetometers. Space Sci Rev 199:189–256. https ://doi. org/10.1007/s1121 4-016-0245-4
Seki K, Miyoshi Y, Ebihara Y, Katoh Y, Amano T, Saito S, Shoji M, Nakamizo A, Keika K, Hori T, Nakano S, Watanabe S, Kamiya K, Takahashi N, Omura Y, Nose M, Fok MC, Tanaka T, Ieda A, Yoshikawa A (2018) Theory, modeling, and integrated studies in the Arase (ERG) project. Earth Planets Space. https ://doi.org/10.1186/s4062 3-018-0785-9
Shiokawa K, Kato Y, Hamaguchi Y et al (2017) Ground-based instruments of the PWING project to investigate dynamics of the inner magnetosphere at subauroral latitudes as a part of the ERG-ground coordinated observa-tion network. Earth Planets Space 69:160. https ://doi.org/10.1186/s4062 3-017-0745-9
Shoji M, Omura Y (2017) Nonlinear generation mechanism of EMIC falling tone emissions. J Geophys Res Space Phys 122:9924–9933. https ://doi. org/10.1002/2017J A0238 83
Spence HE et al (2013) Science goals and overview of the radiation belt storm probes (RBSP) energetic particle, composition, and thermal plasma (ECT) suite on NASA’s Van Allen probes mission. Space Sci Rev. https ://doi. org/10.1007/s1121 4-013-0007-5
Sugiyama H, Singh S, Omura Y, Shoji M, Nunn D, Summers D (2015) Elec-tromagnetic ion cyclotron waves in the Earth’s magnetosphere with a kappa-Maxwellian particle distribution. J Geophys Res Space Phys 120:8426–8439. https ://doi.org/10.1002/2015J A0213 46
Takashima T, Ogawa E, Asamura K, Hikishima M (2018) Design of a mission network system using SpaceWire for scientific payloads onboard the Arase spacecraft. Earth Planets Space. https ://doi.org/10.1186/s4062 3-018-0839-z
to polar science. Adv Polar Sci 24:231–240. https ://doi.org/10.3724/ SP.J.1085.2013.00231
Uchino H, Kurita S, Harada Y, Machida S, Angelopoulos V (2017) Waves in the innermost open boundary layer formed by dayside magnetopause reconnection. J Geophys Res Space Phys 122:3291–3307. https ://doi. org/10.1002/2016J A0233 00
Umemura N, Segawa T, Miyashita Y et al (2017) Development and future plans of web based data analysis tool ERGWAT. J Space Sci Inf Jpn 6:25–37. https ://doi.org/10.20637 /JAXA-RR-16-007/0003(in Japanese)