R E S E A R C H
Open Access
Special role of
JUN
in papillary thyroid
carcinoma based on bioinformatics analysis
Wenzheng Chen
1†, Qingfeng Liu
2†, Yunxia Lv
1, Debin Xu
1, Wanzhi Chen
1and Jichun Yu
1*Abstract
Background:Papillary thyroid carcinoma (PTC) is the most common malignancy in thyroid tissue, and the number of patients with PTC has been increasing in recent years. Discovering the mechanism of PTC genesis and progression and finding new potential diagnostic biomarkers/therapeutic target genes of PTC are of great significance.
Methods:In this work, the datasets GSE3467 and GSE3678 were downloaded from the Gene Expression Omnibus (GEO) database. Differentially expressed genes (DEGs) were identified with the limma package in R. GO function and KEGG pathway enrichment were conducted with DAVID tool. The interaction network of the DEGs and other genes was performed with Cytoscape plugin BisoGenet, while clustering analysis was performed with Cytoscape plugin ClusterOne.
Results:A total of 1800 overlapped DEGs were detected in two datasets. Enrichment analysis of the DEGs found that the top three enriched GO terms in three ontologies and four significantly enriched KEGG pathways were mainly concerned with intercellular junction and extracellular matrix components. Interaction network analysis found that transcription factor hepatocyte nuclear factor 4, alpha (HNF4A) and DEGJUNhad higher connection degrees. Clustering analysis indicated that two function modules, in whichJUN was playing a central role, were highly relevant to PTC genesis and progression.
Conclusions:JUNmay be used as a specific diagnostic biomarker/therapeutic molecular target of PTC. However, further experiments are still needed to confirm our results.
Keywords:PTC, DEGs, Enrichment analysis, Interaction network,JUN
Background
The thyroid cancer incidence has been increasing world-wide in recent years, and more cases of thyroid cancer are diagnosed every year [1]. Papillary thyroid carcinoma (PTC) is the most common malignancy in the thyroid and accounts for almost 80% of all thyroid cancers [2]. It is characterized by distinctive nuclear alterations includ-ing pseudoinclusions, grooves, and chromatin clearinclud-ing [3]. Most patients with PTC have an excellent prognosis, but a small number of patients remain suffering with aggressive PTC which can develop invasive tumors and/ or distant metastases [4]. Undoubtedly, PTC places an enormous economic burden on society and personality and greatly lowers the quality of one’s life. It is of great
significance to study the mechanism of PTC genesis and explore new avenues to prevent PTC formation.
Previous study indicated that a number of different genetic changes were related to PTC, particularly the chimeric oncogenes formed by a fusion of a membrane receptor protein tyrosine kinase domain with another gene’s 5-prime terminal region. Oncogenic gene rear-rangements involving the RET and NTRK1 have been found in PTC tissues [5, 6]. BRAF and RAS mutations are also observed in PTC cases, and the constitutive ac-tivation of effectors along the RET/PTC-RAS-BRAF sig-naling pathway contributed to the transformation of the thyroid cell to PTC [7–9]. For the diagnosis and progno-sis of PTC, several methods and markers are used. Im-munohistochemical markers have been evaluated and tested in PTC tissues, such as CK19, HBME-1, RET, galectin-3, and CITED1. However, they are helpful only in some cases, for all of them have their limits and may
* Correspondence:[email protected] †Equal contributors
1Department of Thyroid and Neck Surgery, The Second Affiliated Hospital of
Nanchang University, Nanchang, Jiangxi Province 330006, China Full list of author information is available at the end of the article
bring some error diagnostics [10–13]. Molecular studies also conferred some useful information for the diagnosis and therapy of PTC. Liu et al. have reported that CXCR7 gene involves in regulating proliferation and metastasis of PTC cell and provides a potential target for thera-peutic interventions in PTC [14]. Minna et al. found that miR-199a-3p could act as a tumor suppressor in PTC [15]. Despite those researches on PCT, there are still so many mechanisms underlining PTC genesis and pro-gression that needed further investigation, especially in the gene expression profile level.
In this study, we aimed to identify the differentially expressed genes (DEGs) in PTC tissues compared with normal thyroid tissue adjacent to PTC tumors. A series of bioinformatics analyses including DEGs identification, function enrichment, and interaction network construc-tion were conducted to gain more insights into the molecular mechanisms of PTC genesis and progression. Our aim is to explore the pathogenesis of PTC and find potential diagnostic biomarkers/therapeutically targets of PTC by bioinformatic methods.
Methods
Affymetrix microarray data
Gene expression profiles of GSE3467 and GSE3678 were downloaded from the Gene Expression Omnibus (GEO) database (http://www.ncbi.nlm.nih.gov/geo/), which is se-quenced on the GPL570 (Affymetrix Human Genome U133 Plus 2.0 Array) platform. A total of 32 chips were used for the analysis, including 18 samples in GSE3467 (9 PTC samples and 9 matched normal tissue samples [16]) and 14 samples in GSE3678 (7 PTC samples and 7 paired normal thyroid tissue samples). Total RNA was extracted from paired tumor and normal thyroid tissues from the PTC patients. The downloaded raw data in CEL files were converted into expression measures and performed back-ground correction and quartile data normalization using the robust multichip average (RMA) algorithm [17] in Affy package manufactured by Affymetrix [18].
DEGs analysis
Both aforementioned datasets were divided into the PTC group and the normal group. The limma method [19] was used to identify DEGs in both datasets. The threshold of DEGs was set as |log2FC| > 0.5 with false discovery rate
(FDR) <0.01. The BH method was used to adjust the raw
p value into FDR to circumvent the multi-test problem which might induce too many false positive results [20]. Subsequently, two sets of DEGs were obtained after the above process. Venn diagram package [21] was used to perform Venn diagram to get the overlapped DEGs in both datasets. To further study the overlapped DEGs, heat maps of the overlapped DEGs were depicted in both data-sets using R package“pheatmap”function [22]. We could
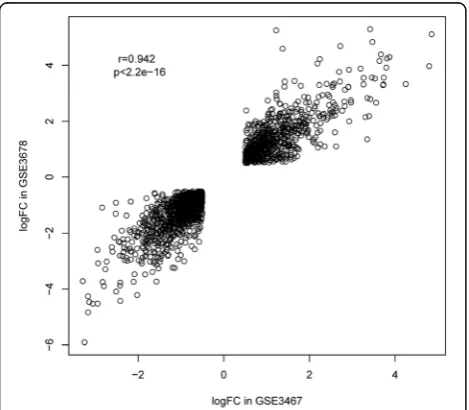
inspect the different expression patterns of these genes between the PTC group and the normal group through the heat maps. Besides, the correlation analysis between the logFC values of the DEGs in GSE3467 and GSE3678 was also processed to verify whether the gene expression trends in both datasets were the same or not [23]. The Pearson’s correlation coefficient was used to assess the associations. All p values <0.05 were considered to be statistically significant.
Enrichment analysis
Firstly, the probes were converted to the official gene symbol according to Da et al. [24] using DAVID. Then, both Gene Ontology (GO) enrichment analysis and Kyoto Encyclopedia of Genes and Genomes (KEGG) pathway enrichment analysis were processed to complete the func-tional enrichment analysis, and DAVID was utilized to select online biological classification. GO provides three structured networks of defined terms (biological process, molecular function, and cellular compartment) to describe gene product attributes [25]. We performed GO enrich-ment analysis in these three ontologies to functionally classify the DEGs. KEGG pathway is a collection of manu-ally drawn metabolic pathway map which represents our knowledge on the molecular interaction and reaction net-works [26]. The count number≥5 and the pvalue <0.01 were chosen as the cutoff for defined GO terms and KEGG pathways.
Interaction network construction
Cytoscape [27] is a free software project for integrating biomolecule interaction networks with high-throughput expression data and other molecular states into a unified conceptual framework. BisoGenet [28] is a new plugin of Cytoscape for gene network construction, visualization, and analysis. A trait of Bisogenet is the availability to include coding relations to distinguish between genes and their products. In the present study, BisoGenet was used to get the interaction networks of the DEGs based on Biomolecular Interaction Network Database (BIND) [29], a database designed to store full descrip-tions of interacdescrip-tions, molecular complexes, and pathways, to search the all known interactions. The interaction patterns with a degree ≥0.8 were selected. Besides, the clustering analyses of the genes were also per-formed with the Cytoscape plugin ClusterOne [30] under default parameters to obtain the important function modules, and the pvalues of hypergeometric distribution were defined <0.05.
Results DEGs analysis
there were 1800 overlapped DEGs observed in both datasets. Among them, 1083 genes were significantly downregulated while 717 genes were significantly upregulated.
The hierarchical clustering analysis of the 1800 over-lapped genes in the two datasets is shown in Fig. 1. As the heat maps have shown, in both datasets, the expression patterns of these genes were significantly different between the PTC group and the control group, and there was an obvious boundary line between them. Besides, correlation analysis between the logFC values of the DEGs in GSE3467 and GSE3678 also showed that they were highly positively correlated as the correlation coefficient
reached 0.94 and the p value <2.2e−16 (Fig. 2). This result indicated that the expression patterns of the DEGs in the two datasets were highly consistent, and the 1800 overlapped DEGs may be truly differentially expressed in the PTC group compared with those in the control group.
Fig. 1Bidirectional hierarchical clustering analysis of the 1800 overlapped DEGs between PTC and control groups in dataset GSE3467 (a) and GSE3678 (b)
Fig. 2Correlation scatter plot of the 1800 DEGs’logFC values in dataset GSE3467 and that in dataset GSE3678
Table 1The top five enriched GO terms in three categories and all enriched KEGG pathways in PTC
Category Term Pvalue GOTERM_BP_FAT GO:0007155~cell adhesion 8.71E-08 GOTERM_BP_FAT GO:0022610~biological adhesion 9.42E-08 GOTERM_BP_FAT GO:0009611~response to wounding 1.53E-06 GOTERM_BP_FAT GO:0007242~intracellular signaling
cascade
1.92E-06 GOTERM_BP_FAT GO:0008637~apoptotic mitochondrial
changes
2.35E-06 GOTERM_CC_FAT GO:0031012~extracellular matrix 4.21E-07 GOTERM_CC_FAT GO:0044459~plasma membrane part 7.73E-06 GOTERM_CC_FAT GO:0005578~proteinaceous extracellular
matrix
Function enrichment analysis
A total of 179 significantly enriched GO terms in the aforementioned three ontologies and four significantly enriched KEGG pathways were obtained. The top three enriched GO terms in the three ontologies and the four enriched KEGG pathways are listed in Table 1. Taken together, the intercellular junction and extracellular matrix components may be related with the PCT genesis.
Interaction network analysis
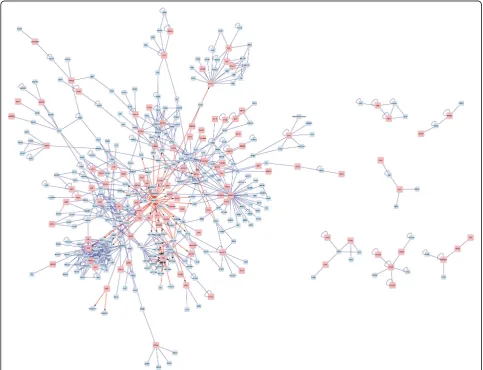
The interaction network of the DEGs was created to deeply understand how these DEGs are related and how the different pathways crosslink to each other (Fig. 3). As the result had shown, transcription factor (TF) hepatocyte nuclear factor 4, alpha (HNF4A), regulated the expression of many DEGs, while the DEG PGR could be regulated by many transcription
factors. The DEG JUN was connected with many
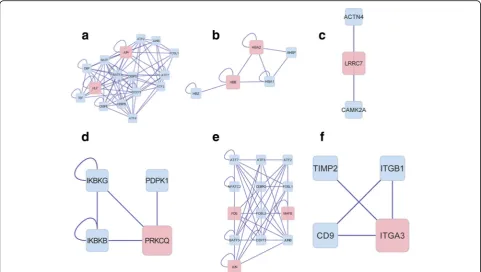
other genes, which implied that its encoding product could interact with many target proteins, and be involved in many pathways. Six function clusters of the DEGs were obtained using the plugin ClusterOne including cluster 1 with the DEGsJUNandHLF(Fig. 4a),
cluster 2 with the DEGs HBA2 and HBB (Fig. 4b),
cluster 3 with the DEG LRRC7 (Fig. 4c), cluster 4 with the DEG PRKCQ (Fig. 4d), cluster 5 with the DEGs JUN, FOS, and MAFB (Fig. 4e), and cluster 6 with the DEG ITGA3 (Fig. 4f ). These six significant clusters mainly function in protein dimerization, hemoglobin complex, cytoplasmic vesicle, regulation of molecular function, sequence-specific DNA binding, and integrin complex. The detailed genes involved in these clusters and the top significant GO term of these genes were listed in Table 2. What was notice-able was that the gene JUN appeared in two clusters (cluster 1 and cluster 5), suggesting its important role in PTC genesis.
Fig. 3DEGs interaction network construction in PTC. Thered squaresstand for DEGs and theblue squaresstand for target proteins. Theblue lines
stand for the interaction between two proteins and theblue lineswitharrowsstand for the interaction between DNA and protein
Discussion
The incidence of PTC has increased worldwide over the past 15 to 20 years, especially in developed countries [31, 32]. To manage the increasing PTC patients effect-ively, a better understanding of the molecular mechanism involved in PTC is necessary. We applied bioinformatics techniques to investigate the DEGs in PTC and deeper explore the molecular mechanism underlying PTC genesis in this study. A total of 1800 overlapped DEGs were detected in two datasets. Enrichment analysis found the top five enriched GO terms in three ontologies and four significant enriched KEGG pathways were mainly con-cerned with regulation of pigmentation, cellular homeo-stasis, extracellular matrix, and intercellular junction. By constructing interactive network of the DEGs, we found that transcription factor HNF4A and DEGJUNhad higher
connection degrees in the network. By employing plugin
ClusterOne, we got six subnetworks and DEG JUN
appeared in two subnetworks.
In the constructed interaction network, we observed that the transcription factor HNF4A was connected with many other DEGs. However, its own expression has not changed in PTC. HNF4A regulates expression of genes involved in glucose metabolism and homeostasis [33]. It may play important roles in the occurrence and progres-sion of PTC by interfering other genes’normal expression and further disturbing cellular homeostasis. Nevertheless, further studies are still needed to illustrate its specific role in PTC genesis. We also discovered that the DEG gene
JUN could interact with many other target proteins, implying its important role in PTC genesis. JUN is a proto-oncogene, and its encoding product is the first
Fig. 4Significant clusters in PTC. The interaction networks in cluster 1 (a), cluster 2 (b), cluster 3 (c), cluster 4 (d), cluster 5 (e), and cluster 6 (f)
Table 2The detailed information of the significant enriched function modules
Nodes Pvalue Genes Top significant GO term Cluster 1 16 0.0000143 ATF2, ATF3, ATF4, BATF, CEBPE, HLF, DBP, TEF, JUN,
CEBPB, BATF3, DDIT3, JUNB, CEBPG, FOSL1, ATF7
GO:0046983~protein dimerization activity Cluster 2 5 0.005 HBZ, HBB, HBA1, HBA2, AHSP GO:0005833~hemoglobin complex Cluster 3 3 0.026 CAMK2A, ACTN4, LRRC7 GO:0044433~cytoplasmic vesicle part
Cluster 4 4 0.027 IKBKB, IKBKG, PRKCQ, PDPK1, GO:0044093~positive regulation of molecular function Cluster 5 13 0.032 ATF2, ATF3, NFATC2, MAFB, JUN, FOSL2, BATF3,
DDIT3, JUNB, CEBPG, FOS, FOSL1, ATF7
discovered oncogenic transcription factor [34]. Previous study demonstrated that it could promote tumor forma-tion and maintain tumor cell survival between the initi-ation and progression stages [35]. The activiniti-ation of JUN was also involved in the progress of breast cancer, gastric cancer, and colorectal carcinomas [36–38]. But the role of
JUNin PTC has not been studied, and here, we observed its significant different expression in PTC tissues and noticed its interaction with so many other proteins in the created interaction network. We deduced that the JUN may also play an important role in PTC genesis and progression and can be a possible potential diagnostic biomarker/therapeutical target gene of PTC.
Our deduction get further conferred by the cluster analysis, as theJUNappeared again in cluster 1 and clus-ter 5 (Fig. 4a, e). GO enrichment analysis manifested that cluster 1 was mainly concerned with“protein dimerization activity.”There were only two DEGs in cluster 1, namely
JUN and HLF. The rest were all unchanged target pro-teins, and most of them were transcription factors, such as ATF2, ATF3, ATF4, ATF7, DDIT3, and FOSL1.HLFis a proto-oncogene whose expression product is a subset of the bZIP transcription factors and can cause abnormal transcriptional regulations of target genes which is related to leukemia development [39]. ATF2 binds with JUN to form a heterodimer and participates in reducing the amount of tumor necrosis factor (TNF) transcription through competitive binding [40]. The co-expressing JUN and ATF3 in two neuronal-like cell lines significantly enhanced JUN-mediated neurite sprouting [41]. The inter-actions of JUN with the aforementioned other transcrip-tion factors in regulatranscrip-tion certain gene expression have also been reported [41, 42]. We presumed that the acti-vated JUN might interact with some transcription factors and further induce abnormal gene expressions which lead to carcinogenesis.
The top significant GO term of function cluster 5 was
“sequence-specific DNA binding.” Many transcription factors, such as ATF2, ATF3, ATF4, and ATF7, were also clustered to this module. What is noteworthy is the gene
FOS, another proto-oncogene playing an important role in tumourigenesis and carcinogenesis [43], which chan-ged its expression either in this module. The expression product ofFOScan dimerize with JUN and form Activa-tor Protein-1 (AP-1) complex. AP-1 binds to target genes at AP-1-specific sites at the promoter/enhancer regions and converts extracellular signals into changes of gene expression [44]. Some studies found that the JUN/FOS dimer, namely AP-1 complex, was involved in certain cancer genesis, and it can be the potential targeted therapeutic genes for certain cancer therapy. Magrisso et al. state that the expression of JUN and/or FOS are important events in colorectal tumorigenesis [45]. Wong et al. reported that the cyclooxygenase-2
inhibitor (SC-236) functioned the antitumor effects via inhibiting JNK-c-Jun/AP-1 activation, and the inhibition of JNK activation may have a therapeutic benefit against gastric cancer [37]. Zhang demonstrated that geldanamycin is a highly potent inhibitor of the AP-1 transcription factor and affects the activation of JNK in hypoxic HT29 human colon adenocarcinoma cells [36]. We supposed that the JUN/FOS dimer might also act as a promoter in PTC genesis. Design drugs targeting at this complex is potentially effective in PTC therapy. Even though, further immunohistochemical studies are still needed to confirm our results.
Conclusions
In conclusion, we had analyzed the gene expression pro-files of PTC using bioinformaticanalysis. Interaction net-work analysis indicated that the gene JUN was closely connected with PTC genesis. It might be used as specific therapeutic molecular target in order to benefit the cure of PTC patients. However, further experiments are still needed to confirm our results.
Abbreviations
BIND:Biomolecular Interaction Network Database; DEGs: Differentially expressed genes; FDR: False discovery rate; GEO: Gene Expression Omnibus; GO: Gene Ontology; KEGG: Kyoto Encyclopedia of Genes and Genomes; PTC: Papillary thyroid carcinoma; TF: Transcription factor; TNF: Tumor necrosis factor
Acknowledgements Not applicable.
Funding
This work was supported by the Young Scientists Cultivating Program of Jiangxi Province (20161BAB215249).
Availability of data and materials
All data generated or analyzed during this study are included in this published article.
Authors’contributions
WC and QL participated in the design of this study, and they both performed the statistical analysis. YL, DX, and WC carried out the study and collected important background information. WC, QL, and JY drafted the manuscript. All authors read and approved the final manuscript.
Ethics approval and consent to participate Not applicable.
Consent for publication Not applicable.
Competing interests
The authors declare that they have no competing interests.
Publisher’s Note
Springer Nature remains neutral with regard to jurisdictional claims in published maps and institutional affiliations.
Author details
1
Department of Thyroid and Neck Surgery, The Second Affiliated Hospital of Nanchang University, Nanchang, Jiangxi Province 330006, China.
2Department of General Surgery, The People’s Hospital of Liaoning Province,
Shenyang 110016, China.
Received: 21 February 2017 Accepted: 22 June 2017
References
1. Chen W, Zheng R, Baade PD, Zhang S, Zeng H, Bray F, Jemal A, Yu XQ, He J. Cancer statistics in China. CA Cancer J Clin. 2016;66:115–32.
2. Haugen BR, Alexander EK, Bible KC, Doherty GM, Mandel SJ, Nikiforov YE, Pacini F, Randolph GW, Sawka AM, Schlumberger M, et al. 2015 American Thyroid Association Management Guidelines for Adult Patients with Thyroid Nodules and Differentiated Thyroid Cancer: The American Thyroid Association Guidelines Task Force on Thyroid Nodules and Differentiated Thyroid Cancer. Thyroid. 2016;26:1–133.
3. Bonora E, Tallini G, Romeo G. Genetic predisposition to familial
nonmedullary thyroid cancer: an update of molecular findings and state-of-the-art studies. J Oncol. 2010;2010:385206.
4. Hardin H, Guo Z, Shan W, Montemayor-Garcia C, Asioli S, Yu XM, Harrison AD, Chen H, Lloyd RV. The roles of the epithelial-mesenchymal transition marker PRRX1 and miR-146b-5p in papillary thyroid carcinoma progression. Am J Pathol. 2014;184:2342–54.
5. Pierotti MA, Bongarzone I, Borello MG, Greco A, Pilotti S, Sozzi G. Cytogenetics and molecular genetics of carcinomas arising from thyroid epithelial follicular cells. Genes Chromosomes Cancer. 1996;16:1–14. 6. Pierotti MA, Vigneri P, Bongarzone I. Rearrangements of RET and NTRK1
tyrosine kinase receptors in papillary thyroid carcinomas. Recent Results Cancer Res. 1998;154:237–47.
7. Kimura ET, Nikiforova MN, Zhu Z, Knauf JA, Nikiforov YE, Fagin JA. High prevalence of BRAF mutations in thyroid cancer: genetic evidence for constitutive activation of the RET/PTC-RAS-BRAF signaling pathway in papillary thyroid carcinoma. Cancer Res. 2003;63:1454–7.
8. Namba H, Nakashima M, Hayashi T, Hayashida N, Maeda S, Rogounovitch TI, Ohtsuru A, Saenko VA, Kanematsu T, Yamashita S. Clinical implication of hot spot BRAF mutation, V599E, in papillary thyroid cancers. J Clin Endocrinol Metab. 2003;88:4393–7.
9. Xing M, Tufano RP, Tufaro AP, Basaria S, Ewertz M, Rosenbaum E, Byrne PJ, Wang J, Sidransky D, Ladenson PW. Detection of BRAF mutation on fine needle aspiration biopsy specimens: a new diagnostic tool for papillary thyroid cancer. J Clin Endocrinol Metab. 2004;89:2867–72.
10. Khanafshar E, Lloyd RV. The spectrum of papillary thyroid carcinoma variants. Adv Anat Pathol. 2011;18:90–7.
11. Cheung CC, Ezzat S, Freeman JL, Rosen IB, Asa SL. Immunohistochemical diagnosis of papillary thyroid carcinoma. Mod Pathol. 2001;14:338–42. 12. Scognamiglio T, Hyjek E, Kao J, Chen YT. Diagnostic usefulness of HBME1,
galectin-3, CK19, and CITED1 and evaluation of their expression in encapsulated lesions with questionable features of papillary thyroid carcinoma. Am J Clin Pathol. 2006;126:700–8.
13. Prasad ML, Pellegata NS, Kloos RT, Barbacioru C, Huang Y, de la Chapelle A. CITED1 protein expression suggests papillary thyroid carcinoma in high throughput tissue microarray-based study. Thyroid. 2004;14:169–75. 14. Liu Z, Yang L, Teng X, Zhang H, Guan H. The involvement of CXCR7 in
modulating the progression of papillary thyroid carcinoma. J Surg Res. 2014; 191:379–88.
15. Minna E, Romeo P, De Cecco L, Dugo M, Cassinelli G, Pilotti S,
Degl'Innocenti D, Lanzi C, Casalini P, Pierotti MA, et al. miR-199a-3p displays tumor suppressor functions in papillary thyroid carcinoma. Oncotarget. 2014;5:2513–28.
16. He H, Jazdzewski K, Li W, Liyanarachchi S, Nagy R, Volinia S, Calin GA, C-g L, Franssila K, Suster S. The role of microRNA genes in papillary thyroid carcinoma. Proc Natl Acad Sci U S A. 2005;102:19075–80.
17. Irizarry RA, Hobbs B, Collin F, Beazer-Barclay YD, Antonellis KJ, Scherf U, Speed TP. Exploration, normalization, and summaries of high density oligonucleotide array probe level data. Biostatistics. 2003;4:249–64. 18. Gautier L, Cope L, Bolstad BM, Irizarry RA. affy—analysis of Affymetrix
GeneChip data at the probe level. Bioinformatics. 2004;20:307–15. 19. Smyth GK. limma: linear models for microarray data. In: Gentleman R, Carey
V, Huber W, Irizarry R, Dudoit S, editors. Bioinformatics and Computational Biology Solutions Using R and Bioconductor. New York: Springer; 2005. p. 397–420. Statistics for Biology and Health].
20. Benjamini Y, Hochberg Y. Controlling the false discovery rate: a practical and powerful approach to multiple testing. Journal of the Royal Statistical Society Series B (Methodological). 1995;57:289–300.
21. Chen H, Boutros PC. VennDiagram: a package for the generation of highly-customizable Venn and Euler diagrams in R. BMC bioinformatics. 2011;12:35. 22. Cuaranta-Monroy I, Simandi Z, Kolostyak Z, Doan-Xuan Q-M, Poliska S,
Horvath A, Nagy G, Bacso Z, Nagy L. Highly efficient differentiation of embryonic stem cells into adipocytes by ascorbic acid. Stem Cell Res. 2014; 13:88–97.
23. Ihaka R, Gentleman RR. A language for data analysis and graphics. J Comput Graph Stat. 1996;5:299–314.
24. Da Wei Huang BTS, Lempicki RA. Systematic and integrative analysis of large gene lists using DAVID bioinformatics resources. Nat Protoc. 2008;4:44–57. 25. Zhu W, Li C, Ai Z. Candidate agents for papillary thyroid cancer identified by
gene expression analysis. Pathol Oncol Res. 2013;19:597–604.
26. Q-y C, D-m J, Wu Y-q, Wang L, Hu H-z, Song J, Yan J, Wu L-j. Functional and pathway enrichment analysis for integrated regulatory network of high-and low-metastatic lung cancer. Mol BioSyst. 2013;9:3080–90.
27. Shannon P, Markiel A, Ozier O, Baliga NS, Wang JT, Ramage D, Amin N, Schwikowski B, Ideker T. Cytoscape: a software environment for integrated models of biomolecular interaction networks. Genome Res. 2003;13:2498–504. 28. Martin A, Ochagavia ME, Rabasa LC, Miranda J, Fernandez-de-Cossio J,
Bringas R. BisoGenet: a new tool for gene network building, visualization and analysis. BMC bioinformatics. 2010;11:91.
29. Bader GD, Betel D, Hogue CWV. BIND: the Biomolecular Interaction Network Database. Nucleic Acids Res. 2003;31:248–50.
30. Nepusz T, Yu H, Paccanaro A. Detecting overlapping protein complexes in protein-protein interaction networks. Nat Methods. 2012;9:471–2. 31. Chen AY, Jemal A, Ward EM. Increasing incidence of differentiated thyroid
cancer in the United States, 1988-2005. Cancer. 2009;115:3801–7. 32. Davies L, Welch HG. Increasing incidence of thyroid cancer in the United
States, 1973-2002. JAMA. 2006;295:2164–7.
33. Damcott CM, Hoppman N, Ott SH, Reinhart LJ, Wang J, Pollin TI, O'Connell JR, Mitchell BD, Shuldiner AR. Polymorphisms in both promoters of hepatocyte nuclear factor 4-alpha are associated with type 2 diabetes in the Amish. Diabetes. 2004;53:3337–41.
34. Vogt PK. Fortuitous convergences: the beginnings of JUN. Nat Rev Cancer. 2002;2:465–9.
35. Eferl R, Ricci R, Kenner L, Zenz R, David JP, Rath M, Wagner EF. Liver tumor development. c-Jun antagonizes the proapoptotic activity of p53. Cell. 2003; 112:181–92.
36. Zhang Y, Pu X, Shi M, Chen L, Song Y, Qian L, Yuan G, Zhang H, Yu M, Hu M, et al. Critical role of c-Jun overexpression in liver metastasis of human breast cancer xenograft model. BMC Cancer. 2007;7:145.
37. Wong BC, Jiang XH, Lin MC, Tu SP, Cui JT, Jiang SH, Wong WM, Yuen MF, Lam SK, Kung HF. Cyclooxygenase-2 inhibitor (SC-236) suppresses activator protein-1 through c-Jun NH2-terminal kinase. Gastroenterology. 2004;126: 136–47.
38. Vasilevskaya IA, O'Dwyer PJ. Effects of geldanamycin on signaling through activator-protein 1 in hypoxic HT29 human colon adenocarcinoma cells. Cancer Res. 1999;59:3935–40.
39. Hunger SP, Li S, Fall MZ, Naumovski L, Cleary ML. The proto-oncogene HLF and the related basic leucine zipper protein TEF display highly similar DNA-binding and transcriptional regulatory properties. Blood. 1996;87:4607–17. 40. Newell CL, Deisseroth AB, Lopez-Berestein G. Interaction of nuclear proteins
with an AP-1/CRE-like promoter sequence in the human TNF-alpha gene. J Leukoc Biol. 1994;56:27–35.
41. Pearson AG, Gray CW, Pearson JF, Greenwood JM, During MJ, Dragunow M. ATF3 enhances c-Jun-mediated neurite sprouting. Brain Res Mol Brain Res. 2003;120:38–45.
42. Hai T, Curran T. Cross-family dimerization of transcription factors Fos/Jun and ATF/CREB alters DNA binding specificity. Proc Natl Acad Sci U S A. 1991;88:3720–4.
43. Milde-Langosch K. The Fos family of transcription factors and their role in tumourigenesis. Eur J Cancer. 2005;41:2449–61.
44. Chiu R, Boyle WJ, Meek J, Smeal T, Hunter T, Karin M. The c-Fos protein interacts with c-Jun/AP-1 to stimulate transcription of AP-1 responsive genes. Cell. 1988;54:541–52.