Answer Attenutation in Question Answering
Katie Bell and James R. Curran School of Information Technology
University of Sydney Sydney, Australia
{kbel5892, james}@it.usyd.edu.au
Abstract
Research in Question Answering (QA) has been dominated by theTRECmethodology of black-box system evaluation. This makes it difficult to evaluate the effectiveness of dividual components and requires human in-volvement. We have collected a set of an-swer locations within theAQUAINTcorpus for a sample of TRECquestions, in doing so we also analyse the ability of humans to retrieve answers. Our answer corpus allows us to track answer attenuation through aQAsystem. We use this method to evaluate the ProntoQA sys-tem (Bos et al., 2007).
1 Introduction
A Question Answering system, is any system which answers questions posed in natural language. In its earliest forms, QA systems were natural
lan-guage front-ends to structured databases of knowl-edge (Androutsopoulos, 1995). Today, there exists a massive quantity of data freely available on the in-ternet in raw textual form, but to find specific infor-mation the user may be required to read many doc-uments returned from a query. The goal of open do-mainQAis to enable users to find specific answers to questions from enormous corpora spanning many domains.QAcan be seen as a search problem:
find-ing answers in a corpus of text. A QA system re-duces the search space in stages, starting with se-lecting documents, then passages, and so on, until a single answer is returned.
The current method of evaluating Question An-swering systems stems from the Text REtrieval Con-ference (TREC) Question Answering track. Using a standard document collection and question set,
each participating system is graded on the propor-tion of answers which are correct and supported by the source document. These criteria are assessed by the only reliable way to determine the correctness and support of an answer: humans. However, man-ual evaluation is costly and not feasible for constant evaluation of QA while developing new systems or
techniques. For this purpose a set of correct answer regular expressions are crafted from the correct an-swers as judged by the TREC QAhuman assessors. These answer keys are unreliable as they are both not exhaustive and do not take into account the sup-port of the source document (Lin, 2005).
For reliable automated evaluation we need a gold standard dataset. This would be an exhaustive list of the exact locations of human verified correct answer instances for a set of questions. Using such a set of answer locations, we can define an extension of current evaluation practices, which we call answer attenuation. Answer attenuation is the proportion of correct answers lost from the search space after each stage of processing. The purpose of this mea-sure is both to provide more information about the effectiveness of each system component and a more reliable overall system evaluation.
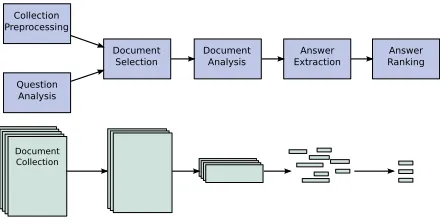
Figure 1: The generic structure ofQAsystems
2 Background
Question answering can be seen as a search prob-lem. QAsystems typically follow a pattern of suc-cessively narrowing the search space for answers. The generic structure defined by Hirschman and Gaizauskas (2001) provides a model for describ-ing QAsystems. Not all QAsystems include all of these components, yet it provides a useful frame-work to draw parallels. The generic system structure is shown in Figure 1, starting with pre-processing of the document collection, usually indexing to im-prove retrieval time. The question analysis stage in-volves determining the expected answer type of the question and generating keywords to be used in re-trieving documents in the document selection stage. The document analysis stage involves selecting sec-tions from the text which are considered likely to contain answers. Short phrases which match the expect answer type of the question are selected in the answer extraction stage, these answers are then ranked according to how well they match or answer the original question.
2.1 QAEvaluation
The methods for evaluating and analysing QA
sys-tems can be divided into three categories: black-box whole system evaluation, component specific evalu-ation and system-wide component analysis.
Black-box EvaluationThe results of a human as-sessment of an answer can be approximated using human generated answer keys (Breck et al., 2000). This method remains the most widely used form of evaluation of QA systems. However, this method should be used with caution (Lin, 2005). Lin’s work calls into question the reliability of the use of these answer keys for system evaluation and comparison.
Firstly, the answer keys do not take into account the support of the source document. Similarly, the an-swers are limited to those returned by existing sys-tems. Any new QA system will not be evaluated
as better than the sum of preceding systems. Con-sequently, Lin finds that these evaluation resources underestimate answer accuracy.
Lin proposes a potential solution as future work which is very similar to the method proposed here: the tagging of all instances of the correct answer for each question. He then highlights the difficulties of such an approach, particularly in the creation of the test data. There is no efficient way to exhaustively find all answer instances without a manual search of the entire document collection. Searching for the known answer string is unreliable as answers can pear in multiple forms, for example a date can ap-pear aslast Monday. We can never guarantee a com-pletely exhaustive corpus. However, currentQA
sys-tems have no reached performance levels where an exhaustive corpus is necessary to measure improve-ment. We use the results of our human annotations as an approximation to this ideal corpus. Lin only described the usefulness of this method as a replace-ment for the current black-box system evaluation but did not consider the additional use of this method for component analysis ofQAsystems.
Component Specific EvaluationSeveral groups have realised the importance of evaluating individ-ual components independently of the whole system and have attempted to do so for specific compo-nents, for example, answer extraction (Light et al., 2001). Particular focus has been placed on the docu-ment retrieval component. For example, substituting different algorithms then comparing overall perfor-mance (Tellex et al., 2003). Also, human assessment ofQA document retrieval has formed an additional part of the TREC QA Track (Voorhees, 2003) and the results are then used for automated evaluation (Monz, 2003). These individual analyses are use-ful, yet their application is limited to specific com-ponents and implementations. Our approach is not component specific.
experi-ments (Brill et al., 2002), where each component is replaced by a baseline component which performs the same function in a minimal way.
The second approach is to look at cases where the system does not perform correctly, and iden-tify the components which are causing these failures. Moldovan et al. (2003) manually traced each incor-rectly answered question and decided which com-ponent was the cause. Each comcom-ponent was given a score in terms of the percentage of failures that it caused. This was used to determine which compo-nents of the system should be focused on to improve overall system performance. While useful, this anal-ysis is time consuming and it is difficult to assign errors to specific components.
3 Collecting the Corpus
As the basis for the initial data collection we used
the AQUAINT-1 document collection, consisting of
approximately 1 million newswire articles, and a set of questions taken from the 1999 and 2000 TREC QA tracks. Also provided by NIST were expected answers and sets of regular expression answer keys intended for automatic marking.
Collecting an exhaustive list of correct answer in-stances is non trivial. We start with the assumption that humans are adept at finding specific informa-tion, in this case, the answers to questions. We or-ganised a group of 20 volunteers to each spend 5 hours finding the answers to a set of TREC ques-tions and annotating them. Reading through the en-tire document collection is infeasible. Thus, a web-based user interface was developed to assist the pro-cess, providing the annotators with a searching tool to first select a set of likely documents, then read them to find answers. All of the volunteer annotators were comfortable with keyword searching, primarily from the use of search engines such as Google.
Each annotator was allocated a question and given the expected answer and answers keys from TREC. They would then select some search keywords, and refine them until a manageable number of docu-ments were returned. They would read through the documents and highlight any instances of the cor-rect answer. Then they would create another search query and repeat the process until they were confi-dent that they had found all of the answers.
The guidelines given to the annotators were as fol-lows: The answer can exist in multiple forms, e.g. 1991, 25th March 1991, today. These should be tagged no matter what form or precision it is. Ad-ditionally, the whole answer should be tagged, if the document says 25th March 1991, then that whole phrase should be tagged. The annotators were also instructed that a correct answer must be supported by the sentence in which it is found, such that if a person read that sentence they would know, for cer-tain, the answer to the question. This differs from the TRECevaluation process, which uses the entire document as support. The choice to allow only sen-tences both simplifies the annotation process and provides a closer correlation with how current QA
systems select answers.
The questions were chosen based on the num-ber of answers present in the document collection. This is impossible to determine without searching for, and verifying each answer. Therefore, the volun-teer annotators also selected which questions would be included in the final set. Questions with fewer answer instances are most interesting for evaluation because systems are more likely to answer them in-correctly. For some questions, the number of correct answers in the document collection is overwhelm-ingly large and would be impossible for annotators to find all of them within a reasonable period. For these reasons, the annotators were instructed to dis-card questions when it became obvious that there would be more than 100 answer instances.
4 Behaviour of the Annotators
The use of human annotators was based on the as-sumption that humans, particularly those used to searching the internet for information, would be good at finding answers to questions. Looking at the behaviour of our volunteers, this is not the case. Humans are good at judging relevance but not at re-trieval with high recall.
We analyse the shortcomings of the pilot corpus and discuss the necessary steps to enable efficient and reliable annotations of a more complete corpus.
4.1 Search Stopping Criteria
0 1 2 3
0 2 4 6 8
Annotator
Time (minutes)
[image:4.612.316.535.74.156.2]Search Read Annotation
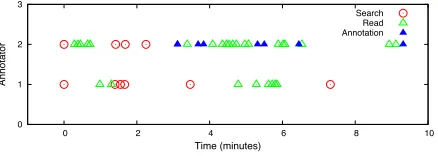
Figure 2: Time lines forWhat movie did Madilyn Kahn star in with Gene Wilder?
0 1 2 3
0 2 4 6 8 10
Annotator
Time (minutes)
Search Read Annotation
Figure 3: Timelines forWhere is Tufts University?
there is no definite way to know when there are no more answers to be found. We found that the an-notators used three different stopping criteria. (1) They had read all the documents returned from their searches and they believed that the search was gen-eral enough; (2) Further searches returned no new results; (3) After initially finding answers, if they read several documents with no answers.
We have plotted timelines showing when annota-tors searched for, read or annotated documents. Fig-ure 2 shows two different stopping criteria. Annota-tor 1 stopped when there were no more documents in the search results and further searches yielded no results. Annotator 2 used a more general set of search terms and stopped annotating when they had read several documents without finding any answers. Both annotators found the same single answer.
This was not always the case. Figure 3 shows the behaviour of the two annotators assigned the
ques-tion Where is Tufts University? Annotator 1,
af-ter several attempts at searching, decided that there were no answers for this question. Annotator 2 used more sophisticated queries, eventually finding sev-eral answers. From this variation in query genera-tion ability, we know that not all of the answers have been found for each question.
Selecting the correct stopping criteria is not a triv-ial task and none of the criteria used by the annota-tors is sufficient in all circumstances.
0 1 2 3
0 10 20 30 40 50 60 70
Annotator
Time (minutes)
[image:4.612.76.296.75.154.2]Search Read Annotation
Figure 4: Time lines forWhere is Venezuela?
4.2 Efficiency and Accuracy
The efficiency of the annotators related primarily to their choice of search terms. For example in the question Where is Venezuela?, shown in Figure 4. One annotator, not only was slower in reading and annotating documents, but also had fewer annota-tions within those documents because of the search terms used, they were less specific. The more effi-cient annotator searched forVenezuela AND ‘south
america’whereas the other annotator used keywords
instead of a string literal and consequently had a higher proportion of irrelevant documents.
4.3 Search Terms
From a detailed analysis of the terms that the an-notators used to retrieve documents we can both as-sess whether the annotators were thorough in finding answers exhaustively, and determine the annotators techniques for generating search queries.
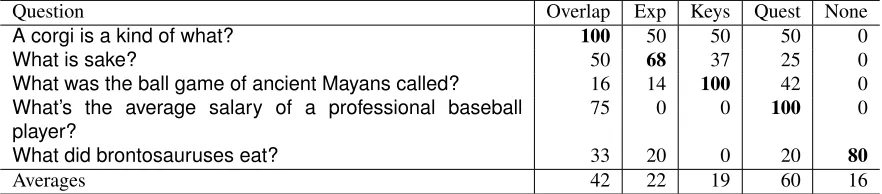
For each question, the annotators were given the question, the expected answer and the set of answer keys. As shown in Table 1, the search terms used are usually generated from a combination of key-words from the question and from the expected an-swer. Unfamiliarity with regular expressions made using answer keys hard for the annotators.
The results in Table 1 were calculated based on simple case-insensitive string matching. Since the words were not stemmed, the search terms for the question, What did brontosauruses eat? had lit-tle overlap with the question because the annotators used the search term brontosaurus in combination with other words such aseat and food. The over-all results suggest that the annotators used very few search terms which were not directly drawn from the question. In this example, the only word which is not a variation from the question isfood.
[image:4.612.77.296.205.283.2]an-Question Overlap Exp Keys Quest None
A corgi is a kind of what? 100 50 50 50 0
What is sake? 50 68 37 25 0
What was the ball game of ancient Mayans called? 16 14 100 42 0
What’s the average salary of a professional baseball player?
75 0 0 100 0
What did brontosauruses eat? 33 20 0 20 80
[image:5.612.86.527.72.169.2]Averages 42 22 19 60 16
Table 1: The overlap of annotators search terms and the percentage source of the search terms, from the expected answer, answer keys and the question. The sample questions were chosen as the maximum of each column.
Text with annotation #annotes Correct
For instance , a 1993 fire that killed 188 workers at a toy factory in Thailand was similar to a1911New York clothing factory fire which previously held the record for the highest number of fatalities with 146 dead .
1 Incorrect
Some of the nation ’s most stringent workplace-safety laws were prompted by the1911 Triangle Shirtwaist Co. fire in New York City .
20 Correct
The decline has been particularly pronounced in high-risk industries such as mining , where the average death rate was 329 per 100,000 from1911to 1915 , compared with 25 per 100,000 in 1996-97 , the CDC said .
2 Incorrect
Here are some highlights : TRIANGLE FACTORY FIRE : OnMarch 25 , 1911, a blaze at the Triangle Shirtwaist Co. in Manhattan ’s garment district claimed 146 lives .
14 Correct
Here are some highlights : TRIANGLE FACTORY FIRE : On March 25 ,1911, a blaze at the Triangle Shirtwaist Co. in Manhattan ’s garment district claimed 146 lives .
4
Table 2: A sample of the answer locations for the common questionWhen was the Triangle Shirtwaist fire?
notators has further ramifications. In many cases, this lead to the annotators restricting their searches to only answers of a particular form. For example for the question When was Microsoft established?
both annotators made the same search. Both anno-tators searched forMicrosoft AND established AND 1975. Despite this high agreement, it is possible that further answers were completely disregarded, for example there could be answers of the form
Mi-crosoft was established 25 years ago today.
A total of 73% of the searches generated by the annotators contained either the expected answer or answer key in some form. The risk of making the queries answer specific is that answers in other for-mats will be missed. If the expected answer and an-swer keys were not provided, the annotators would be more likely to search for answers of any form. However, this has the disadvantage that the annota-tors would be less efficient in finding the answers.
The overall behaviour of the annotators focuses on speed and efficiency rather than accuracy or thor-oughness, as the annotations were done within a
short amount of time, with the goal of getting as much data as possible. With more time allowed for the annotations, more detailed guidelines and train-ing, a far more exhaustive set of answer instances could be found for the question set.
4.4 Reliability of Manual Annotations
In order to study how accurately and exhaustively the annotators were finding the answers, all anno-tators were required to answer a common question:
When was the Triangle Shirtwaist fire?Some results
(unsup-ported) answer was 9, and the lowest agreement for a correct answer was 16 out of the 20 annotators. This is a significant gap and indicates that when there are enough annotators using only the answers which the majority of annotators agree upon is reliable both in terms of coverage and accuracy.
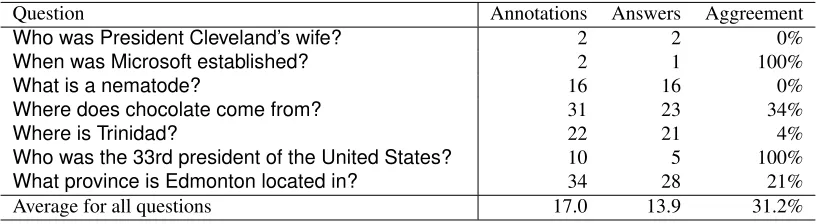
In addition to the common question, half of the set of questions were annotated by at least two annota-tors. A sample of questions and the overall anno-tation agreement results are shown in Table 3. The questionWho was President Cleveland’s wife?is an example of where both annotators failed to find all of the answers, both annotators found a different cor-rect answer to the question. It is likely that there are more answers which were not found by either anno-tator. There were also clear mistakes in the dataset such as the questionWhat is a nematode?, the two annotators assigned this question had annotated al-most exactly the same sentences, however one of the annotators had mistakenly tagged the word
ne-matodein each sentence and not the actual answer
to the question.
In using this annotated answer set, there are two options, the first is to only use annotations which both annotators have agreed upon, this will signif-icantly reduce the erroneous answers, however it would also reduce the coverage of the answer set. When using the answer set to analyse aQAsystem, the system would appear to be performing worse than it actually is. The other option is to include all answers regardless of whether multiple annota-tors agreed on them. This would result in the system appearing worse than it actually is when it does not retain the wrong answer, however it will appear to be performing better than it actually is if it retains the wrong answers. We chose to include all of the answers to maximise coverage, as this it is cover-age which is one of the faults of the current standard evaluation system. Ideally, there would be more an-notators for each question, and thus the inclusion of each answer location could be decided with relative confidence by a majority vote, as shown in result of the common question described above.
5 Using Answer Attenuation
When constructing or modifying aQAsystem, there is a trade-off between speed, memory and how
much of the document collection is retained at each stage. For example, if at the document selection stage, all of the documents are selected, this guar-antees that all answers in the document collection are still within the search space, however the fol-lowing stages will take much more time to process this larger search space. Alternatively only one doc-ument or passage could be selected at each stage. This would result in very fast processing in the later stages however most of the answers will be lost and assuming each stage involves some probability of error, it is possible that all correct answers are lost resulting in the system returning the wrong answer or no answer. Consequently a QA system designer must balance these two concerns: efficiency and re-call. This is where our answer attenuation measure is critical.
Using the answer set we collected, it is possible to measure the proportion of this answer set which is still in theQAsystem’s search space after each stage of processing each question. What defines a stage of processing, is any work done by the system which narrows the search space for answers, whether this is intentional or not. For example, document retrieval is intentionally narrowing the search to a specific set of documents, whereas a parsing step removes sen-tences if they fail to parse, an effect which is unin-tentional. Consequently, answer attenuation serves the dual purpose of error detection as well as an anal-ysis tool to fine tune theQAsystem to maximise per-formance.
6 Results
We compared answer attenuation to the TREC an-swer keys in two ways. Firstly, we compared all of the annotated answers to check whether they would have been marked as correct by the TREC answer keys. Secondly, we calculated the answer attenua-tion for all six stages of the ProntoQAsystem. The evaluation of the final answer, we compared with the
TRECanswer key evaluation. Our final evaluation of answer attenuation is to show that it is useful in de-tecting and repairing flaws inQAsystems.
6.1 Comparing Annotations with Answer Keys
Question Annotations Answers Aggreement
Who was President Cleveland’s wife? 2 2 0%
When was Microsoft established? 2 1 100%
What is a nematode? 16 16 0%
Where does chocolate come from? 31 23 34%
Where is Trinidad? 22 21 4%
Who was the 33rd president of the United States? 10 5 100%
What province is Edmonton located in? 34 28 21%
Average for all questions 17.0 13.9 31.2%
Table 3: A sample of questions and the agreement when a question was answered by two annotators
answer location was one of those in the answer set. A difference between these two scores must have one of three possible causes: (1) there is a correct answer in the document collection which the anno-tators did not find; (2) the answer key marks the an-swer as correct when it is not supported by the doc-ument; (3) the answer returned was annotated incor-rectly by the annotators. In all of the experiments run, this third case never occurred, despite Pronto answering most of the questions wrong, and the ex-istence of several incorrect answers in the answer set. The questionWhat is the busiest air travel sea-son?is an example of theTRECanswer key marking as correct when the document does not actually an-swer the question. The source document refers to a specific summer in which there were many air traf-fic delays, not that the season of summer is the bus-iest time to travel or even busy at all. Similarly for the questionWhere is Tufts University?, the answer
Bostonis correct according to theTRECanswer keys
but the document from which it was taken does not support it.
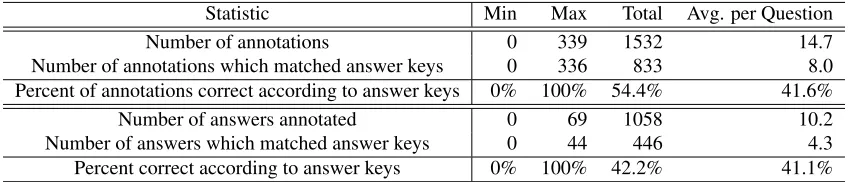
That document was read by both annotators who were assigned that question yet was not annotated, indicating their belief that it did not answer the ques-tion. In every case where the returned answer was not one of the annotations and theTRECanswer key marked it as correct, the document was found by a human assessment to not support the answer. This drawback in the answer key method is clearly shown by marking all of the human annotations according to theTRECanswer keys, the results of this
compar-ison is shown in Table 4. Only 42% of the answers found by the annotators would be considered cor-rect according to an evaluation based solely on the answer key. Additionally for some of the questions, none of the answers marked by the annotators would
have been marked as correct by the TREC answer key.
7 Answer Attenuation in Pronto
The Pronto QA system has 6 discrete components which actively reduce the search space. The doc-ument retrieval component selects the docdoc-ument identifiers from an index based on search terms, these documents are extracted into a single file which is parsed with the wide-coverageCCGParser (Clark and Curran, 2004). This syntactic analysis is then used by a component called Boxer to gen-erate a semantic analysis of the text (Bos, 2005). The document retrieval and extraction components form the document selection stage according to the generic QA system structure. Similarly, the CCG
and Boxer stages form the document analysis stage. The matching component performs answer extrac-tion, and ‘select’ refers to the answer ranking stage. Pronto is currently in a state of development and is consequently not performing to the standard ex-pected of a state of the art system.
Component Q %L Run1 %L Run2 %L Total Ans. 10 0 872 0 872 0 DocRet 4 60 493 43 493 43
Extract 4 0 418 15 493 0
CCG 4 0 345 17 415 15
Boxer 4 0 345 0 415 0
Matcher 1 75 30 91 27 93
Select 1 0 5 83 4 85
[image:7.612.102.512.71.183.2]Answer 1 0 3 40 3 25
Table 5: The answer attenuation for Pronto. Showing the answers remaining in the search space and the % loss for an example question (Q) and two runs.
Statistic Min Max Total Avg. per Question
Number of annotations 0 339 1532 14.7
Number of annotations which matched answer keys 0 336 833 8.0 Percent of annotations correct according to answer keys 0% 100% 54.4% 41.6%
[image:8.612.94.520.71.162.2]Number of answers annotated 0 69 1058 10.2 Number of answers which matched answer keys 0 44 446 4.3 Percent correct according to answer keys 0% 100% 42.2% 41.1%
Table 4: For each question, the number of answers the annotators found and the percentage of these which would be judged correct by the answer keys
stage. An example question,What is the wingspan
of a condor? is shown in Table 5, there were a
to-tal of 10 answers in the annotated answer set for this question. Only 4 answers were found in the doc-ument retrieval stage, and 3 of those answers were lost in the matching stage. The system returned the remaining correct answer as its final result. The first run shows the initial results aggregated over all ques-tion. We expected the document extraction phase to have zero loss. This stage only copies the doc-uments from the collection into a single file and is not intended to reduce the search space. This was traced to a problem in the way Pronto handles results form multiple searches and the problem repaired for the second run. This repair improved the individ-ual component score, yet did not improve the over-all system score, hence by black box evaluation the repair would not be detectable.
8 The Ultimate Answer Set
Our results indicate that with a larger group of an-notators, a more complete set of answers could be found. We propose the creation of a collaborative dataset, emulating the success of open projects such as Wikipedia. Using a fixed document collection and question set, an initial set of answer locations is used as an evaluation set alongside theTRECanswer keys
and manual evaluations. Whenever a new answer is found, it is added to the dataset if a threshold num-ber of humans agree on the answer. Similarly, if an answer is included in the collection which is agreed to be incorrect or not have enough support from the source document, it is removed. Over time the an-swer set is refined to be both exhaustive and accu-rate.
9 Conclusion
The answer attenuation measure provides both a useful analysis of QA system components and has the potential to also be a reliable whole system per-formance evaluation. This depends on the creation of a sufficiently exhaustive corpus of answer loca-tions. We have created a pilot corpus of answer lo-cations, and by studying the behaviour of the anno-tators we conclude that it is not yet reliable enough to replace current methods of overall evaluation. What was lacking in QA evaluation was an
auto-mated method for conducting an evaluation across all system components.
The next step is the creation of a larger high qual-ity answer location corpus. This would involve more detailed guidelines for the annotators, more anno-tators assigned to each question and more time al-lowed. The resulting corpus could then be improved collaboratively over time as it is used to evaluateQA
systems.
The creation of our pilot corpus has shown that this goal is feasible. We have used this corpus to analyse answer attenuation in Pronto, and have shown that it can reveal flaws in existing question answering systems.
Acknowledgements
We would like to thank the anonymous reviewers for their helpful feedback, Johan Bos who helped with our installation of Pronto, and our 20 volunteer an-notators for helping us test these ideas.
References
Johan Bos, James R. Curran, and Edoardo Guzzetti. 2007. The Pronto QA System at TREC 2007: Harvest-ing Hyponyms, UsHarvest-ing Nominalisation Patterns, and Computing Answer Cardinality. InTREC 2007. Johan Bos. 2005. Towards wide-coverage
seman-tic interpretation. In Proceedings of Sixth Interna-tional Workshop on ComputaInterna-tional Semantics IWCS-6, pages 42–53.
Eric J. Breck, John D. Burger, Lisa Ferro, Lynette Hirschman, David House, Marc Light, and Inderjeet Mani. 2000. How to Evaluate your Question Answer-ing System Every Day and Still Get Real Work Done. InLREC-2000, pages 1495–1500.
Eric Brill, Susan Dumais, and Michele Banko. 2002. An analysis of the askmsr question-answering system. In
EMNLP ’02, pages 257–264, Morristown, NJ, USA. Association for Computational Linguistics.
Stephen Clark and James R. Curran. 2004. Parsing the WSJ using CCG and Log-Linear Models. In Proceed-ings of the 42nd Annual Meeting of the Association for Computational Linguistics (ACL ’04).
L. Hirschman and R. Gaizauskas. 2001. Natural lan-guage question answering: the view from here. Nat. Lang. Eng., 7(4):275–300.
Marc Light, Gideon S Mann, Ellen Riloff, and Eric Breck. 2001. Analyses for elucidating current ques-tion answering technology. Natural Language engi-neering, 7(4):325–342.
Jimmy Lin. 2005. Evaluation of resources for question answering evaluation. InSIGIR ’05: Proceedings of the 28th annual international ACM SIGIR conference on Research and development in information retrieval, pages 392–399, New York, NY, USA. ACM.
Dan Moldovan, Marius Pas¸ca, Sanda Harabagiu, and Mi-hai Surdeanu. 2003. Performance issues and error analysis in an open-domain question answering sys-tem. ACM Trans. Inf. Syst., 21(2):133–154, April. Christof Monz, 2003. Document Retrieval in the Context
of Question Answering, chapter 8, page 546. Springer Berlin / Heidelberg.