Product Classification in E-Commerce using Distributional Semantics
Vivek Gupta , Harish KarnickIndian Institute of Technology , Kanpur
{vgupta,hk}@cse.iitk.ac.in
Ashendra Bansal , Pradhuman Jhala Flipkart Internet Pvt. Ltd., Bangalore
{ashendra.bansal,pradhuman.jhala}@flipkart.com
Abstract
Product classification is the task of automatically predicting a taxonomy path for a product in a predefined taxonomy hierarchy given a textual product description or title. For efficient prod-uct classification we require a suitable representation for a document (the textual description of a product) feature vector and efficient and fast algorithms for prediction. To address the above challenges, we propose a new distributional semantics representation for document vector forma-tion. We also develop a new two-level ensemble approach utilizing (with respect to the taxonomy tree) path-wise, node-wise and depth-wise classifiers to reduce error in the final product classi-fication task. Our experiments show the effectiveness of the distributional representation and the ensemble approach on data sets from a leading e-commerce platform and achieve improved results on various evaluation metrics compared to earlier approaches.
1 Introduction
Existing e-commerce platforms have evolved into large B2C and/or C2C marketplaces having large in-ventories with millions of products. Products in ecommerce are generally organized into a hierarchical taxonomy of multilevel hierarchical categories. Product classification is an important task in catalog formation and plays a vital role in customer oriented services like search and recommendation and seller oriented services like seller utilities on a seller platform. Product classification is a hierarchical classifi-cation problem and presents the following challenges: a) a large number of categories have data that is extremely sparse with a skewed long tailed distribution, b) a hierarchical taxonomy imposes constraints on activation of labels. If a child label is active then it is necessary for a parent label to be active, c) for practical use the prediction should happen in real time - ideally within few milli-seconds.
Traditionally, documents have been represented as a weighted bag-of-words (BoW) or tf-idf feature vector, which contains weighted information about the presence or absence of words in a document by using a fixed length vector. Words that define the semantic content of a document are expected to be given higher weight. While tf-idf and BoW representations perform well for simple multi-class classi-fication tasks, they generally do not do as well for more complex tasks because the BoW representation ignores word ordering and polysemy, is extremely sparse and high dimensional and does not encode word meaning. Such disadvantages have motivated continuous, low-dimensional, non-sparse distribu-tional representations. A word is encoded as a vector in a low dimension vector space typicallyR100 to
R300. The vector encodes local context and therefore is sensitive to local word order and captures word meaning to some extent. It relies on the ‘Distributional Hypothesis’(Harris, 1954) i.e. Similar words occur in similar contexts. Similarity between two words can be calculated via cosine distance between their vector representations.
Le and Mikolov (Le and Mikolov, 2014) proposed paragraph vectors, which use global context to-gether with local context to represent documents. But paragraph vectors suffer from the following prob-lems: a) current techniques embed paragraph vectors in the same space (dimension) as word vectors
This work is licensed under a Creative Commons Attribution 4.0 International Licence. Licence details: http:// creativecommons.org/licenses/by/4.0/.
although a paragraph can consist of words belonging to multiple topics (senses), b) current techniques also ignore the importance and distinctiveness of words across documents. They assume all words con-tribute equally both quantitatively (weight) and qualitatively (meaning).
In this paper we describe a new compositional technique for formation of document vectors from se-mantically enriched word vectors to address the above problems. Further, to capture importance, weight and distinctiveness of words across documents we use a graded weights approach, inspired by the work of Mukerjee et al. (Pranjal Singh, 2015), for our compositional model. We also propose a new two-level approach for product classification which uses an ensemble of classifiers for label paths, node labels and depth-wise labels (with respect to the taxonomy) to decrease classification error. Our new ensemble tech-nique efficiently exploits the catalog hierarchy and achieves improved results in topK taxonomy path prediction. We show the effectiveness of the new representation and classification approach for product classification of two e-commerce data-sets containing book and non-book descriptions.
2 Related Work
2.1 Distributional Semantic Word Representation
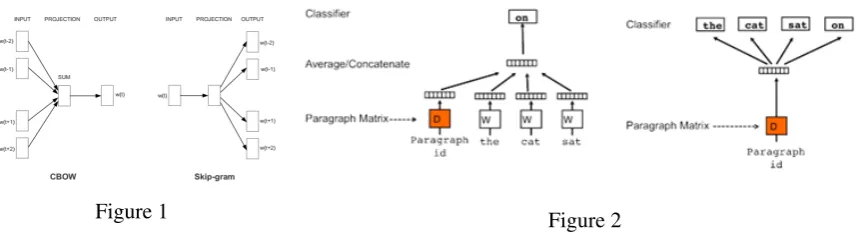
The distributional word embedding method was first introduced by Bengio et al. as the Neural Proba-bilistic Language Model (Bengio et al., 2003). Later, Mikolov et al. (Mikolov et al., 2013) proposed a simple log-linear model which considerably reduced training time - Word2Vec Continuous Bag-of-Words (CBoW) model and Skip-Gram with Negative Sampling (SGNS) model. Figure 1 shows the architecture for CBoW (Left) and Skip-Gram (Right).
Later Glove (Jeffrey Pennington, 2014) a log-bilinear model with a weighted least-squares objective was proposed which uses the statistical ratio of global word-word co-occurrences in the corpus for train-ing word vectors. The word vectors learned ustrain-ing the skip-gram model are known to encode many linear linguistic regularities and patterns (Levy and Goldberg, 2014b).
While the above methods look very different they implicitly factorize a shifted positive point-wise mutual information matrix (PPMI) with tuned hyper parameters as shown by Levy and Goldberg (Levy and Goldberg, 2014c). Some methods also describe use of non-linear dependency based context (Levy and Goldberg, 2014a). Some variants incorporate ordering information in context words to capture syntactic information by replacing summation of context word vectors with concatenation during training (Wang Ling, 2015) of CBoW and SGNS models.
2.2 Distributional Paragraph Representation
Most models for learning distributed representations for long text such as phrases, sentences or doc-uments that try to capture semantic composition do not go beyond simple weighted average of word vectors. This approach is analogous to a bag-of-words approach and neglects word order while repre-senting documents. Socher et al. (Socher et al., 2013) propose a recursive tensor neural network where the dependency parse-tree of the sentence is used to compose word vectors in a bottom-up approach to represent sentences or phrases. This approach considers syntactic dependencies but cannot go beyond sentences as it depends on parsing.
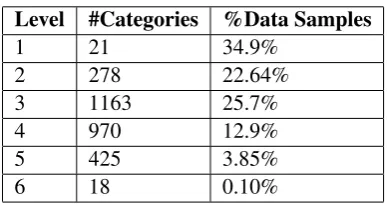
Mikolov proposed a distributional paragraph vector framework called paragraph vectors which are trained in a manner similar to word vectors. He proposed two types of models calledDistributed Memory Model Paragraph Vectors (PV-DM) (Le and Mikolov, 2014) andDistributed BoWs paragraph vectors (PV-DBoW)(Le and Mikolov, 2014). In PV-DM the model is trained to predict the center word using context words in a small window and the paragraph vector (Le and Mikolov, 2014). Here context words to be predicted are represented bywt−k,....,wt+kand the document vector is represented byDi. In
PV-DBoW the paragraph vector is trained to predict context words directly. Figure 2 shows the network architecture for PV-DM(Left) and PV-DBoW(Right).
Figure 1 Figure 2
This model mostly performs better than the BoW models which usually create a very high-dimensional representation leading to poorer generalization.
2.3 Problem with Paragraph Vectors
Paragraph vectors obtained from PV-DM and PV-DBoW are shared across context words generated from the same paragraph but not across paragraphs. On the other hand a word is shared across paragraphs. Paragraph vectors are also represented in the same space (dimension) as word vectors though a paragraph can contain words belonging to multiple topics (senses). The formulation for paragraph vectors ignores the importance and distinctiveness of a word across documents i.e. assumes all words contribute equally both quantitatively (weight wise) and qualitatively (meaning wise). Quantitatively, only binary weights i.e. 0 weight for stop-words and non-zero weight for others are used. Intuitively, one would expect the paragraph vector to be embedded in a larger and enriched space.
2.4 Hierarchical Product Categorization
Most methods for hierarchical classification follow agates-and-expertsmethod which have a two level classifier. The high-level classifier serves as a “gate” to a lower level classifier called the “expert” (Shen et al., 2011). The basic idea is to decompose the problem into two models, the first model is simple and does coarse-grained classification while the second model is more complex and does more fine-grained classification. The coarse-fine-grained classification deals with a huge number of examples while the fine-grained distinction is learned within a subtree under every top level category with better feature generation and classification algorithms and deals with fewer categories. Later, Xue et al. (Xue et al., 2008) suggested an interesting two stage strategy called“deep classification”. The first stage (search) groups documents in the training set that are similar to a given document. In the second stage (classifica-tion) a classifier is trained on these classes and used to classify the document. In this approach a specific classifier is trained for each document making the algorithm computationally inefficient.
For large scale classification Bengio et al. (Bengio et al., 2010) use the confusion matrix for estimating class similarity instead of clustering data samples. Two classes are assumed to be similar if they are often confused by a classifier. Spectral clustering, where the edges of the similarity graph are weighted by class confusion probabilities, is used to group similar classes together.
Shen and Ruvini (Shen et al., 2012) (Shen et al., 2011) extend the previous approach by using a mixture of simple and complex classifiers for separating confused classes rather then spectral clustering methods which has faster training times. They approximate the similarity of two classes by the probability that the classifier incorrectly predicts one of the categories when the correct label is the other category. Graph algorithms are used to generate connected groups from estimated confusion probabilities. They represent the relationship among classes using an undirected graphG= (V, E), where the set of verticesV is the set of all classes andEis the set of all edges. Two vertices’s are connected by an edge if the confusion probabilityConf(c1, c2)is greater than a given thresholdα(Shen et al., 2012).
3 Graded Weighted Bag of Word Vectors
We propose a new method to form a composite document vector using word vectors i.e. distributional meaning and tf-idf and call it a Graded Weighted Bag of Words Vector (gwBoWV). gwBoWV is in-spired from the computer vision literature where we use a Bag of Visual words to form feature vectors. gwBoWV is calculated as follows:
1. Each document is represented in a lower dimensional spaceD=K∗d+K, whereK represents number of semantic clusters anddis the dimension of the word-vectors.
2. Each document is also concatenated with inverse cluster frequency(icf) values which is calculated using idf values of words present in the document.
Idf values from the training corpus are directly used for the test corpus for weighting. Word vectors are first separated into a pre-defined number of semantic clusters using a suitable clustering algorithm (e.g. k-means). For each document we add the word-vectors of each word in the document belonging to a cluster to form a cluster vector. We finally concatenate the cluster vector and the icf for each of theK clusters to obtain the document vector. Algorithm 1 describes this in more detail.
Algorithm 1:Graded Weighted Bag of Word Vectors Data: DocumentsDn, n = 1. . .N
Result:Document vectorsgwBoW V~ Dn, n = 1. . .N
1 Train SGNS model to obtain word vector representation (wvn) using all documentDn, n= 1..N; 2 Calculate idf values for all words:idf(wj), j = 1..|V|; /* |V| is vocabulary size */ 3 Use K-means algorithm for clustering all words inV using their word-vectors into K clusters; 4 for i∈(1..N)do
5 Initialize cluster vectorcv~k=~0, k= 1..K; 6 Initialize cluster frequencyicfk= 0, k= 1..K; 7 whilenot at end of documentDido
8 read current wordwj and obtain wordvecwv~j; 9 obtain cluster indexk=idx(wv~j)for wordvecwv~j; 10 update cluster vectorcv~k+ =wv~j;
11 update cluster frequencyicfk+ =idf(wj);
12 end
13 obtaingwBoW V~ Di =LKk=1cv~k⊕icfk; /* ⊕ is concatenation */ 14 end
Since semantically different vectors are in separate clusters we avoid averaging of semantically dif-ferent words during Bag of Words Vector formation. Incorporation of idf values captures the weight of each cluster vector which tries to model the importance and distinctiveness of words across documents.
4 Ensemble of Multitype Predictors
We propose a two level ensemble technique to combine multiple classifiers predicting product paths, node labels and depth-wise labels respectively. We construct an ensemble of multi-type features for categorization inspired by the recent work of Zornitsa et. al. from Yahoo Labs (Kozareva, 2015). Below are the details of each classifier used at level one:
• Path-Wise Prediction Classifier: We take each possiblepathin the catalog taxonomy tree, from leaf node to root node, as a possible class label and train a classifier (P P) using these labels.
• Depth-Wise Node Prediction Classifiers: We train multiple classifiers (DNPi) one for each depth
level of the taxonomy tree. Each possible node in the catalog taxonomy tree at that depth is a possible class label. We take all data samples which have a potential node at depthkfor training. For samples of data point whose path ended before depthkwe use special None Label and use 10% of such data points for training.
We use the output probabilities of these classifiers at level one (P P,NP,DNPi) as a feature vector
and train a classifier (level two) after some dimensionality reduction.
The increase in training time can be reduced by training all level one classifiers in parallel. The algorithm for training the ensemble is described in Algorithm 2. The testing algorithm is similar to training Algorithm 3
Algorithm 2:Training Two Level Boosting Approach
Data: Catalog Taxonomy Tree (T) of depth M and training dataD= (d,pd) wheredis the
product description andpdis the taxonomy path label.
Result: Set of level one Classifiers C ={P P, NP, DNP1, . . . , DNPM}and level two classifier
F P P.
1 ObtaingwBoW V~ dfeatures for each product description d ;
2 Train Path-Wise Prediction Classifier (P P) with possible classes as product taxonomy paths (pd); 3 Train Node-Wise Prediction Classifier (NP) with possible classes as nodes in taxonomy path i.e.
(nd). Here each description will have multiple node labels.
4 form∈(1. . . M)do
5 Train Depth-Wise Node Classifier for depthm(DNPm) with labels as nodes at depthmi.e.
(nm)
6 end
7 Obtain output probabilities ~PX over all classes for each level one classifierXi.e. ~PP P, ~PNP and
~PDNPm, m= 1..M.;
8 Obtain feature vectorF V~ dfor each description as:
~
F Vd=gwBoW V~ d⊕~PP P ⊕~PNP M
M
m=1
~PDNPm (1)
/* L is the concatenation operation */
9 Reduce feature dimension (RF V~ d) using suitable supervised feature selection technique based on
mutual information criteria;
10 Train Final Path-Wise Prediction Classifier (F P P~ d) usingRF Vdas feature vector and possible
class labels as product taxonomy paths (pd)
5 Dataset
We use seller product descriptions and title samples from a leading e-commerce site for experimentation1.
The data set had two product taxonomies:non-bookandbook. Non-book data is more discriminative with average description + title length of around 10 to 15 words, whereas book descriptions have an average length greater than 200 words. To give more importance to the title compared to the description, we repeated words in title three times (i.e. weighting trice). The distribution of items over leaf categories (verticals) exhibits high skewness and heavy tailed nature and suffers from sparseness as shown in Figure 3. We use random forest and k-nearest neighbors as base classifiers as they are less affected by data skewness.
Algorithm 3:Testing Two Level Boosting Approach
Data: Catalog Taxonomy Tree (T) of depth M and testing dataD= (d,pd) where d is product
descriptionpdis taxonomy of paths. Set of level one Classifiers C ={P P,NP,DNP1 . . . DNPM}and final level two classifierF P P
Result:top 6 prediction pathPdfor training description d
1 ObtaingwBoW V~ dfeatures for each product description d in test data;
2 Get Prediction Probabilities from all level one classifiers to obtain level two feature vector (F V~d)
using Equation 1;
3 Obtain (RF V~ d) reduced feature vector;
4 Output top m paths from final prediction using output probabilities from level two classifierF F P
for description d.
Level #Categories %Data Samples
1 21 34.9%
2 278 22.64%
3 1163 25.7%
4 970 12.9%
5 425 3.85%
[image:6.595.202.396.234.337.2]6 18 0.10%
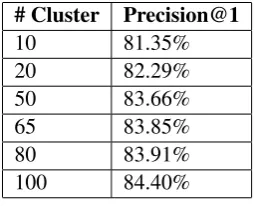
Table 1: Percentage of Book Data ending at each depth level of the book taxonomy hierarchy which had a maximum depth of 6.
We have removed data samples with multiple paths to simplify the problem to single path prediction. Overall, we have 0.16 million training and 0.11 million testing samples for book data and 0.5 million training and 0.25 million testing samples for non-book data. Since the taxonomy evolved over time all category nodes are not semantically mutually exclusive. Some ambiguous leaf categories are even meta categories. We handle this by giving a unique id to every node in the category tree of book-data. Furthermore, there are also category paths with different categories at the top and similar categories at the leaf nodes i.e. reduplication of the same path with synonymous labels. Below are examples of such synonymous path labels.
1. Household→Lights and Lamps→Bulbs→LED Bulbs
2. Home Decor→Lights and Lamps→Bulbs→LED Bulbs
Another Example
1. Home Furnishing→Living→Cushion Pillow Covers
2. Home Furnishing→Bed→Pillows and Pillow Covers→Pillow Covers
The quality of the descriptions and titles also varies a lot. There are titles and descriptions that do not contain enough information to decide an unique appropriate category. There were labels likeOthers
andGeneral at various depths in the taxonomy tree which carry no specific semantic meaning. Also, descriptions with the special label ‘wrong procurement’ are removed manually for consistency.
6 Results
Figure: 3
Figure: 4
The ranking is obtained using the confidence score of the predictor. We also calculate the confidence score of the correct prediction path by using thek(3 to 6) confidence scores of the individual predicted paths. For the purpose of measuring accuracy when more than one path is predicted, the classifier result is counted as correct when the correct class (i.e. path assigned by seller) is one of the returned class (paths). Thus we calculated Top 1, Top 3 and Top 6 prediction accuracy when 1, 3 and 6 paths are predicted respectively.
6.1 Non-Book Data Result
We also compare our results with document vectors formed by averaging word-vectors of words in the document i.e. Average Word Vectors (AWV), Distributed Bag of Words version of Paragraph Vector by Mikolov (PV-DBoW), Frequency Histogram of word distribution in Word-Clusters i.e. Bag of Cluster Vector (BoCV). We keep the classifier (random forest with 20 trees) common for all document vector representations. We compare performance with respect to number of clusters, word-vector dimension, document vector dimension and vocabulary dimension (tf-idf) for various models.
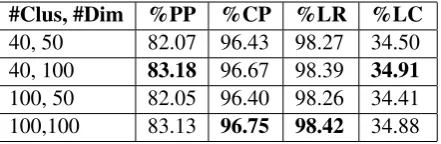
Figure 4 shows results for a random forest (20 trees) on various classifiers trained by various methods on 0.2 million training and 0.2 million testing samples with 3589 classes. It compares our approach gwBoWV with PV-DBoW and PV-DM models with varying word vector dimension and number of clusters. The dimension of word vector for gwBoVW and BoCV is 200. Note AWV , DM and PV-DBoW are independent of cluster number and have dimension 600. Clearly gwBoWV performs much better than other methods especially PV-DBoW and PV-DM. Table 2 Shows the effect of varying cluster numbers on accuracy for Non Book Data for 0.2 million training and testing using 200 dimension word vector for Top 1 prediction using gwBoWV.
# Cluster Precision@1
10 81.35%
20 82.29%
50 83.66%
65 83.85%
80 83.91%
[image:7.595.235.363.557.660.2]100 84.40%
Table 2:Result of classification on varying Cluster Numbers for fixed word vector size 200 for Non Book Data for Precision@1 on #Train Sample = 0.2 million , #Test Sample = 0.2 million
We use the notation given below to define our evaluation metrics for TopKpath prediction :
• τ∗represents the true path for a product description.
#Clus, #Dim %PP %CP %LR %LC 40, 50 82.07 96.43 98.27 34.50 40, 100 83.18 96.67 98.39 34.91 100, 50 82.05 96.40 98.26 34.41 100,100 83.13 96.75 98.42 34.88
Table 3: Result for top 6 paths predicted for multiple Bag of Word Vectors with varying dimension and number of clusters with weighting on Non-Book Data with #Training Samples = 0.50 million, #Test Samples = 0.35 million.
[image:8.595.205.395.194.237.2]#Dim %PP %CP %LR %LC 2000 81.10 94.04 96.85 35.37 4000 82.74 94.78 97.33 35.61
Table 4: Result of top 6 paths prediction for tf-idf with varying dimension on Non Book Data #Training Samples = 0.50 million, #Test Samples = 0.35 million.
• T∗represent the nodes in true pathτ∗.
• Tirepresents the nodes inithpredicted pathτi, wherei∈ {1,2. . . K}.
• p(τ∗) represents the probability predicted by our algorithm for the true path τ∗. p(τ∗) = 0 ifτ∗ ∈/
{τ1, τ2. . . τK}
• p(τi) represents the probability ofithpredicted path by the algorithm, herei∈ {1,2. . . K}.
We use four evaluation metrics to measure performance for the topkpredictions as described below:
1. Prob Precision@K :P P@K = p(τ∗) / (p(τ1) + p(τ2) +. . .+ p(τK)). 2. Count Precision@K :CP@k= 1 ifτ∗ ∈ {τ
1, τ2. . . τK}elseCP@K= 0.
3. Label Recall@K :LR@k=kT∗∩(∪K
1 Ti)k/kT∗k. HerekSkrepresent number of elements in set S.
4. Label Correlation@K :LC@k=k ∩K
1 Tik/k ∪K1 Tik. HerekSkrepresent number of elements in set S.
Table 3 shows the results on all evaluation metrics with varying word-vec dimension and clusters on Non Book Data. Table 4 shows results of top 6 paths prediction for tf-idf baseline with varying dimension for Non Book Data.
6.2 Book Data Result
Book data is harder to classify as it has larger text (>200 words) with more common words. There are more cases of improper paths and labels in the taxonomy and hence we had to do a lot of pre-processing. Around 51% of the books did not have labels at all and 15% books were given extremely ambiguous labels like ‘general’ and ‘others’. To maintain consistency we prune the above 66% data samples and work with the remaining 44% i.e. 0.37 million samples.
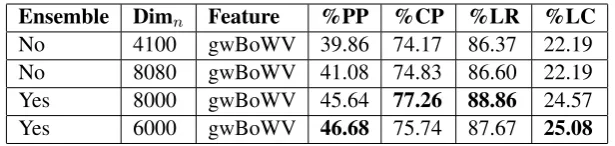
Ensemble Dimn Feature %PP %CP %LR %LC
[image:9.595.145.453.61.134.2]No 4100 gwBoWV 39.86 74.17 86.37 22.19 No 8080 gwBoWV 41.08 74.83 86.60 22.19 Yes 8000 gwBoWV 45.64 77.26 88.86 24.57 Yes 6000 gwBoWV 46.68 75.74 87.67 25.08 Table 5:Results from various approaches for Top 6 predictions for Book Data
Accuracy Precision Recall F-score 81.6% 81.1% 81.1% 80.9%
Table 6: Preliminary Result of gwBoWV with 60 clusters on word-vector dimension of 200 (min word count 20, context window 10), 83% features selection with Anova reduction, C is 2.1 with Linear SVM (one vs rest) on 20newsGroup using weighted averaging for Precision, F-Score and Recall.
6.3 Ensemble Classification
We use the ensemble of multi-type predictors as described in Section 4 for final classification on Book Data. Results on Non-Book data was already very good and as discussed earlier books were harder to classify. For dimensionality reduction we use feature selection methods based on mutual information criteria (ANOVA F-value i.e. analysis of variance). We obtain improved results for all four evaluation metrics with the new ensemble technique as shown in Table 5 for Book Data for Top 6 Prediction. 6.4 Real Examples from Book Data
Description : harpercollins continues with its commitment to reissue maurice sendaks most beloved works in hardcover by making available again this 1964 reprinting of an original fairytale by frank r stockton as illustrated by the incomparable maurice sendak in the ancient country of orn there lived an old man who was called the beeman because his whole time was spent in the company of bees one day a junior sorcerer stopped at the hut of the beeman the junior sorcerer told the beeman that he has been transformed if you will find out what you have been transformed from i will see that you are made all right again said the sorcerer could it have been a giant or a powerful prince or some gorgeous being whom the magicians or the fairies wish to punish the beeman sets out to discover his original form. the beeman of orn. the beeman of orn. the beeman of orn.
Actual Class : books-tree→ children→ knowledge and learning → animals books → reptiles and amphibians
Predictions,Probability Score
books-tree→children→knowledge and learning→animals books→reptiles and amphibians , 0.28 books-tree→children→fun and humor, 0.72
post the new yorker scientific american and science. the upside of irrationality. the upside of irrationality. the upside of irrationality
Actual Class: books-tree→business, investing and management→business→economics Predictions,Probability Score
books-tree→business, investing and management→business→economics 0.15 books-tree→philosophy→logic, 0.175
books-tree→self-help→personal growth, 0.21 books-tree→academic texts→mathematics, 0.465 6.5 Quality of WordVec Clusters
Below are examples of words contained in some clusters formed by clustering of word vectors and their possible cluster topic meaning for book data.
1. Cluster #0 basically talks about crime and punishment related terms likeaccused, arrest, assault, attempted, beaten, attorney,brutal,confessions, convicted cops, corrupt, custody, dealer, gang, in-vestigative, gangster, guns, hated, jails, judge, mob, undercover, trail, police, prison, lawyer, torture, witness etc
2. Cluster #10 talks about scientific experiments and related terms likeyield, valid, variance, alterna-tives, analyses, calculating, comparing, assumptions, criteria, determining, descriptive, evaluation, formulation, experiments, measures model, parameters, inference, hypothesis etc
Similarly, Cluster #13 is talking about dating and marriage, Cluster #11 about tools and tutorials and Cluster #15 about persons. Similarity of words within a cluster leads to an efficient distributional semantic representation of word vectors.
7 Conclusions
We presented a novel compositional technique using embedded word vectors to form appropriate docu-ment vectors. Further, to capture importance, weight and distinctiveness of words across docudocu-ments we used a graded weighting approach. Our document vectors are embedded in a vector space that is dif-ferent from and has higher dimension than the word embedding vector space. This higher dimensional document vector space tries to encode the intuition that a document has more topics than a word.
We also developed a new technique which uses an ensemble of multiple classifiers that predicts label paths, node labels and depth-wise labels to decrease classification error. We tested our method on data sets from a leading e-commerce platform We gain nearly 4% PP@K , 2% CP@K , 2% LR@K and 3% LC@K using gwBoWV with the ensemble classifier compared to other competing methods without the ensemble classifier - see top 6 path prediction on Book Data in Table 5. On Non Book Data we gain nearly 2% in CP@K using gwBoWV without ensemble refer Table 3 and Table 4.
8 Future Work
The number of clustersKis a hyper-parameter we would like to learn this from the data set. We intend to extend the gwBOVW approach to incorporate the path class label in some fashion during the embedding. However, most results are shown on proprietary e-commerce datsets. We experimented gwBoWV with the 20newsgroup data-set and obtain state of art results(Liu et al., 2015) refer Table 6. We are currently applying the approach on large a scale public hierarchy like DMOZ and Wikipedia.
9 Acknowledgement
References
Yoshua Bengio, R´ejean Ducharme, Pascal Vincent, and Christian Janvin. 2003. A neural probabilistic language model. The Journal of Machine Learning Research, 3:1137–1155.
Samy Bengio, Jason Weston, and David Grangier. 2010. Label embedding trees for large multi-class tasks. In
Advances in Neural Information Processing Systems 23, pages 163–171. Curran Associates, Inc.
Zellig Harris. 1954. Distributional structure. Word, 10:146–162.
Christopher D. Manning Jeffrey Pennington, Richard Socher. 2014. Glove: Global vectors for word representa-tion. InEmpirical Methods in Natural Language Processing (EMNLP), pages 1532–1543. ACL.
Zornitsa Kozareva. 2015. Everyone likes shopping! multi-class product categorization for e-commerce. Human
Language Technologies: The 2015 Annual Conference of the North American Chapter of the ACL, pages 1329–
1333.
Quoc V Le and Tomas Mikolov. 2014. Distributed representations of sentences and documents. arXiv preprint arXiv:1405.4053.
Omer Levy and Yoav Goldberg. 2014a. Dependencybased word embeddings. Proceedings of the 52nd Annual Meeting of the Association for Computational Linguistics, 2:302–308.
Omer Levy and Yoav Goldberg. 2014b. Linguistic regularities in sparse and explicit word representations. In
Proceedings of the Eighteenth Conference on Computational Natural Language Learning, pages 171–180.
As-sociation for Computational Linguistics.
Omer Levy and Yoav Goldberg. 2014c. Neural word embedding as implicit matrix factorization. InAdvances in
Neural Information Processing Systems 27, pages 2177–2185.
Yang Liu, Zhiyuan Liu, Tat-Seng Chua, and Maosong Sun. 2015. Topical word embeddings. InAAAI Conference on Artificial Intelligence.
Tomas Mikolov, Kai Chen, Greg Corrado, and Jeffrey Dean. 2013. Efficient estimation of word representations in vector space. arXiv preprint arXiv:1301.3781.
Amitabha Mukerjee Pranjal Singh. 2015. Words are not equal: Graded weighting model for building composite document vectors. In Proceedings of the twelfth International Conference on Natural Language Processing
(ICON-2015). BSP Books Pvt. Ltd.
Dan Shen, Jean David Ruvini, Manas Somaiya, and Neel Sundaresan. 2011. Item categorization in the e-commerce domain. InProceedings of the 20th ACM International Conference on Information and Knowledge
Management, CIKM ’11, pages 1921–1924.
Dan Shen, Jean-David Ruvini, and Badrul Sarwar. 2012. Large-scale item categorization for e-commerce. In
Proceedings of the 21st ACM International Conference on Information and Knowledge Management, CIKM
’12, pages 595–604.
Richard Socher, Alex Perelygin, Jean Y Wu, Jason Chuang, Christopher D Manning, Andrew Y Ng, and Christo-pher Potts. 2013. Recursive deep models for semantic compositionality over a sentiment treebank. In
Pro-ceedings of the conference on empirical methods in natural language processing (EMNLP), volume 1631, page
1642. Citeseer.
Chris Dyer Wang Ling. 2015. Two/too simple adaptations of wordvec for syntax problems. InProceedings of
the 50th Annual Meeting of the North American Association for Computational Linguistics. North American
Association for Computational Linguistics.
Gui-Rong Xue, Dikan Xing, Qiang Yang, and Yong Yu. 2008. Deep classification in large-scale text hierarchies.
In Proceedings of the 31st Annual International ACM SIGIR Conference on Research and Development in