Understanding the Performance of Statistical MT Systems:
A Linear Regression Framework
F rancisco Guzman Stephan Vogel
Qatar Computing Research Institute Qatar Foundation
[email protected] [email protected]
A
BSTRACTWe present a framework for the analysis of Machine Translation performance. We use mul-tivariate linear models to determine the impact of a wide range of features on translation performance. Our assumption is that variables that most contribute to predict translation performance are the key to understand the differences between good and bad translations. During training, we learn the regression parameters that better predict translation quality using a wide range of input features based on the translation model and the first-best translation hypotheses. We use a linear regression with regularization. Our results indicate that with regularized linear regression, we can achieve higher levels of correlation between our predicted values and the actual values of the quality metrics. Our analysis shows that the performance for in-domain data is largely dependent on the characteristics of the translation model. On the other hand, out-of domain data can benefit from better reordering strategies.
T
ITLE ANDA
BSTRACT IN ANOTHER LANGUAGEModelos Lineales para el Análisis del Desempeño de la
Traducción Automática
En este documento presentamos una metodología para el análisis del desempeño de los sistemas de traducción automática. Utilizamos modelos lineales multivariados para determinar el impacto que diversas variables tienen en la calidad de las traducciones. En este estudio se asume que las variables que más contribuyen a predecir la calidad de las traducciones, son determinantes para entender las diferencias entre buenas y malas traducciones. Nuestros resultados demuestran que usando regresión lineal penalizada, se pueden obtener altos índices de predicción de calidad de traducción. Un análisis detallado revela que el desempeño de los sistemas de traducción frente a datosin-domaindependen en gran medida de las características de nuestros modelos de traducción. En contraste, la traducción de documentosout-of-domain está fuertemente ligada a las estrategias de reodenamiento que se utilicen.
K
EYWORDS:
Statistical machine translation, translation quality prediction, system performance analysis.1 Introduction
In their strive to improve machine translation, researchers constantly introduce new models and features; new training and decoding algorithms, or experiment with variations and combination of existing approaches. This is often done based on experience and intuition. The success or failure of an algorithm is based on trial and error, guided by the end-to-end automatic translation quality metrics as a measure of performance. However, little attention is paid to an equally important task: understanding how the different components in the complex SMT systems affect performance. Such knowledge could allow researchers and engineers to address specific weaknesses of their systems. For example, knowing that coverage is an issue, a team might decide to increase the amount of in-domain training data to match their specific needs. In this paper, we develop a methodology to perform this type of analysis. We propose a framework that uses linear models to identify the variables that most contribute to predict the performance of a translation system when dealing with a specific translation task. Our assumption is that variables that most contribute to predicting translation performance are the key to improving performance. Detecting them will provide leverage to design better translation systems.
In our paper, we employ linear models to predict translation quality. Linear regression is a widely known and applied technique. It models the response variableyas a weighted linear combination of a feature vectorX. For instance:
y=θTX+ǫ (1)
whereθrepresents the parameter vector for the regression model andǫis the model error. On a multivariate regression model, Equation 1 represents an hyperplane that minimizes the error
ǫ.
In this paper, we analyze the output of several translation systems that use the same decoder, but differ in the alignment models that they use to build their respective translation model. We use different characteristics of their corresponding translation hypotheses and translation models as input featuresXto predict their translation performanceyin terms of three popular automatic translation quality metrics: BLEU (Papineni et al., 2002), METEOR (Denkowski and Lavie, 2011) and TER (Snover et al., 2006). We use a regularized regression model to estimate the parameters of our prediction model. We use Spearman’s rank correlation, Pearson’s correlation and RMSE to evaluate the fitness of the regression models estimated for two different domains (News, Proceedings) and a mixed-domain, general model.
2 Related work
The work presented in this paper is related to previous analysis done in the past few years. For instance, the correlation between characteristics of the translation model and the automatic quality metrics has previously been addressed. Lopez and Resnik (2006) make a study of different phrase-based translation model (TM) features and their impact translation quality. They also analyze variations in the translation search space of the decoder by having alignments of gradually degraded quality. On the other hand, Birch et al. (2008) study different language-pair characteristics and use them as predictors of BLEU translation quality using linear regression. Furthermore, Pado et al. (2009) use linear models to build a higher-level translation quality metric that uses features from other established metrics (e.g. BLEU, METEOR, TER) as well as Textual Entailment features (Dagan et al., 2006) and that achieves higher correlation with human judgements. However, multivariate regression, has not been used as a tool to predict translation quality based on the characteristics of the translation model.
Others have focused on identifying characteristics of the word alignments upon which these models have been built. Fraser and Marcu (2007) study how alignment quality (AER) is related to its translation quality relative BLEU. As a result, they proposed a modified version of AER to increase the correlation between alignment quality and translation performance. Lambert et al. (2009, 2010) analyze how alignment characteristics correlate with translation quality. They analyze the effect of the number of links of different types of alignments including its repercussions on the size of phrase tables and the ambiguity of the translation model. They also propose new structural metrics for alignments such as link length, distortion and crossings. In this study, we also include alignment features to characterize our translation models. A closely related topic to this study is the task of Quality Estimation for Machine translation (Specia et al., 2009; Specia, 2011), where sentence-level prediction models are used to esti-mate quality of Machine Translation output. In that task, researchers have many sources of information available (typically: model scores, automatic metric scores, post-editing effort scores, etc.) and the goal is to provide a model that reliably is able to distinguish good from bad translations. The proposed work differs from Quality Estimation in two aspects: First, here we are interested in contrasting the output from several translation models, to be able to learn their shared features that help predict better quality scores. Second, we are not interested in performing a local estimation (at a sentence level) but at a document level.
Finally, recent work by Devlin and Matsoukas (2012), focuses in using variation in traits, or hypothesis characteristics to generate alternative hypotheses that are later used for system combination. In their work, they use null words, reordering, ngram-frequency, hypothesis length, among other features. In our view, the current study is complementary to that work, given that our framework allows to detect important features of "traits" which could serve as input a trait-based hypothesis selection system.
3 Problem formulation
Our task is to find the parameter vectorθthat minimizes the squared error of the fitted function θTX. For instance, if we define the error as function of the parameter vector:
ǫ(θ) =y−θTX (2)
then our learning task is to findθˆthat minimizes the squared error:
ˆ
θ=arg min θi
1
mǫ(θi)Tǫ(θi) (3)
wheremrepresents the number of training examples in our training set. In other words, we want to find the weights for each of the input featuresXsuch that their weighted sum minimizes the error across the training set. This serves as a predictor function for our dependent variable (y).
In our scenario, the dependent variable is automatic metric based translation quality, in terms of BLEU, METEOR or TER. The independent variables are features extracted from the translation hypotheses and their corresponding translation models. Below, we describe each of the components of this learning problem. First, we describe the dependent and independent variables. Then, we introduce the algorithms employed for estimating the parameters.
3.1 Features and objective functions
In linear regression, we are interested in building a functionf(θ,X)→yto predicty. In our specific application, we are interested in predicting translation quality. Thus yrepresents a translation quality score. Since most evaluation metrics operate at a document level (i.e. they aggregate statistics of several translations) we need to adapt our formulation to be able to handle this data.
Let(si,tMi ,ri)be a source document (si), its MT translation (tMi ) given a modelMand its human reference translations (ri).
We defineyi=g(tMi ,ri)→R, whereg(·,·)represents an automatic translation quality metric that takes as input a translated documenttM
i and its corresponding reference translationri. Similarly, we need to use aggregated features over the full document set. As such, our features take into account(si,tMi ,M). We divide these into two types of features: the translation hypothesis features (i.e. they take into account onlyti) and the translation model features (that take into accountsiandMto compute their value. Below, we introduce each group briefly. 3.1.1 Translation model features
In this study, we are interested in the characteristics of the part translation modelMthat is visible to the decoder when translating. Therefore, for each input documentsi we extract features from a submodelMis.t.Mi⊂M. In other words, we only keep entries ofMthat had a match in the corresponding sub-documentsi. In practice, this is achieved by filtering the phrase-table to the specific documentsi. The features measured are the following:
the conditional entropy, assuming a uniform distribution over x (i.e.p(x) =1/|X|), For instance, the entropy for the inverse phrasal probabilityp(f|e)is:
Hp(Fi|Ei) =1/|Ei| X
e∈Ei X
f∈Fi
p(f|e)logp(f|e) (4)
Translation model sizeFor each phrase-table, we measure the number of entries (log), as well as the number of source and target singletons.
Alignment density variablesWe use the per-phrase pair number of links (Ayan and Dorr, 2006), source and target gaps (Guzman et al., 2009), averaged over the phrase-table.
Alignment distortion variablesWe use the per-phrase pair number of link-crossings (Lambert et al., 2009), relative link distortion, and a new distortion feature we call diagonality, which is the absolute value of Pearson’s correlation (from 0 to 1) of the positions in the source and target words of an alignment.
3.1.2 Translation hypothesis features
These types of features include the translation cost for each of the features used in the Moses phrase-based decoder (Koehn et al., 2007). These include:
Translation feature costsThe per-phrase cost for each of the translation probability features in the translation model averaged over the translation set ti. We used the baseline translation features in the phrase-based model (Koehn et al., 2003): inverse and direct phrasal translation probabilities and inverse and direct lexical probabilities.
Lexicalized reordering costsThe per phrase cost for the distance-based reordering feature and each of the three different orientations (mono, swap, discontinuous) in a bidirectional setting averaged over the translation setti.
Language model costThe per-word language model cost for each translation hypothesis averaged over the translation setti.
Additionally, we include word-alignment based features:
Word aligment variablesSimilarly to the translation model features, we used aligment density and alignment distortion variables, averaged over the number of phrases used.
3.2 Learning algorithm
There are several algorithms to estimate the multivariate regression parameters (regression coefficients). Here, we use a numerical optimization method withL2 regularization, which allow for the inclusion of many types of variables, regardless of collinearity. For the linear regression problem, the regularized cost function is defined as follows:
There are several minimization methods available for solving this problem. In our experiments, we used a Polack-Ribiere based conjugate gradient minimization routine by Carl Rasmussen1. We optimized theλregularization constant to minimize cost on a cross-validation set.
3.3 Framework architecture
In order to implement this analysis framework, these are the steps that need to be followed.
1.Translation model generation
The first step consists in training the MT system (or systems) of interest, using a standard training pipeline (e.g. Moses). Additionally, use a standard tuning metric (e.g. MERT) to assign optimal parameter weights for each system.
2.Dataset selection
The next step consists in partitioning a dataset (or multiple datasets) for analysis into equally sized subdocuments (source and target parts). For a more diverse sample, we recommend using subdocuments extracted from different datasets.
3.Hypothesis generation
Translate each of the translated subdocuments using the MT systems of interest. Addi-tionally, generate the first-best feature-cost information (e.g. with the-n-best-list
parameter in Moses).
4.Feature extraction
Extract the relevant features corresponding to each subdocument. For the translation model features, filter each of phrase-tables of interest to each of the input subdocuments and extract the phrase-table level features. For the hypothesis features, use the extracted feature costs from the n-best list. For the translation quality, use the generated hypotheses and evaluate them against the given references.
5.Regression
Use the generated data to fit the translation quality regularized regression model with an off-the-shelf ML package. Using zero-mean normalization of features is highly rec-ommended, because it facilitates the interpretation of the results. Cross-validation is recommended to set the optimal regularization penalty.
6.Analysis
Finally, obtain the regression weights and analyze them. To facilitate this task, we recommend using only the top-k largest (in magnitude) coefficients.
4 Experimental setup
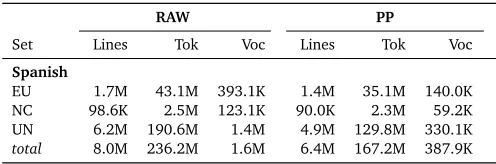
For our experiments, we used a phrase-based system (Moses). For training, we used the Spanish-English portion of Europarl v5, the United Nations, and the news-commentary datasets as provided for the WMT2010 competition. The statistics of this data are shown in table 1.
RAW PP
Set Lines Tok Voc Lines Tok Voc
Spanish
EU 1.7M 43.1M 393.1K 1.4M 35.1M 140.0K
NC 98.6K 2.5M 123.1K 90.0K 2.3M 59.2K
[image:7.420.92.340.70.152.2]UN 6.2M 190.6M 1.4M 4.9M 129.8M 330.1K total 8.0M 236.2M 1.6M 6.4M 167.2M 387.9K
Table 1: Statistics for Raw and preprocessed data for Europarl (EU), News Commentary (NC) and UN training data. We present the total number of training examples (lines), number of tokens (tok) and the vocabulary size (voc).
4.1 Translation model training
The data was lowercased and tokenized with the standard preprocessing toolkit available in Moses. To introduce variation in our translation models, we used different types of alignments. The aligners used for these systems were a discriminative aligner (DWA) (Niehues and Vogel, 2008) with different density thresholds (0.4, 0.5, 0.6, 0.7) to have a variety of dense and sparse alignments. The DWA aligner was trained using hand aligned data from the EPPS (Lambert et al., 2006) dataset. Additionally, we used the symmetrized GIZA++alignments using the heuristics grow-diag, grow-diag-final and grow-diag-final-and. While these variations in alignments might seem minor, in reality, as previously observed by (Guzman et al., 2009; Niehues et al., 2010) they can have a large impact on the characteristics of the translation model. In total we experimented with 7 different translation models.
Each of the systems was tuned using MERT on the WMT news2008 set.
4.2 Feature generation
For our regression training, we translated and analyzed the quality of different documents. We used a variety of different test-sets publicly available for the Spanish-English translation task for the WMT competitions2. The description of the different datasets is presented in Table 2.
4.2.1 Sub-document sampling
To better appreciate the effect of a translation model into translation quality, we split each dataset into used several sub-documents long enough to provide accurate translation statistics (e.g. ngram counts for BLEU), but short enough to allow us to appreciate the differences between different translation models. Sub-document splitting is a known technique that has been used previously for confidence interval estimation (Koehn, 2004).
In our study, we chose a slightly more conservative sub-document size of 100 translation sentences to get smoother results. For our experiments we used only 4 subdocuments (one hundred sentences each) from each of the 9 datasets presented in Table 2. We restricted to 4 samples to ensure that each dataset was equally represented (some datasets are shorter than others). We obtained translations for each of the 7 different translation systems. This resulted in a total set of (9x7x4) 252 different training instances for our regression models (for the cross domain set).
Set id Description Domain Sentences Coverage(%)
AC Acquis Communautaire Legal 4107 95.68
NC07 News Commentary News commentary 2007 98.12
NC08 News Commentary News commentary 2028 98.20
SC09 News System Combination News/Other 502 96.59
NW09 News Test 2009 News 2525 92.83
NW10 News Test 2010 News 2489 92.49
WMT06 Europarl Test 2006 Proceedings 2000 98.60
WMT07 Europarl Test 2007 Proceedings 2000 98.83
WMT08 Europarl Test 2008 Proceedings 2000 98.66
Table 2: Description of the different datasets used in this study. We present the number of the original sentences as well as the percentage of coverage w.r.t. to our training corpus described in Table 1
We also performed a domain-specific (news, proceedings) training, and validation of our linear models to discover which variables were most important in describing performance for each of those genres.
4.3 Regression training
We divided our experiments into three different tasks: learn predictive models for each of the objective functions (BLEU, METEOR and TER). Additionally, to showcase how this technique can be applied to a variety of different scenarios, and to get a better insight of which variables affect different translation tasks, we computed three types of domain-dependent models for each objective function. The first type is a cross-domain or general model, which predicts translation performance regardless of the translation task. For this prediction task, we used all available data from the cross-domain training samples. The second type of prediction model is for out-of-domain news-based data. For training this type of model, we only used the portion of documents that are news related (NW09, NW10). Finally we also present the results for in-domain proceedings data. For these models we used the parliamentary proceedings ( WMT06, WMT07, WMT08).
4.4 Measuring regression performance
One caveat of regression, is that given enough features, it can find the appropriate weights to fit the training set. Regularization helps in part to alleviate over-fitting. However, we performed several tests to ensure that over-fitting was not a problem. Each evaluates a different aspect of our predictions. First, we obtain the root mean square error (RMSE), which gives us an idea of the distance between our predictions and the real value of the translation quality metrics we are approximating. RMSE is given by:
RMSE= sm
X
j
(yj−θTXj)2 (6)
PROC NEWS GENERAL BLEU MET TER BLEU MET TER BLEU MET TER
[image:9.420.77.357.70.139.2]Spearman 0.71 0.72 0.70 0.80 0.80 0.78 0.84 0.82 0.77 Pearson 0.70 0.74 0.65 0.79 0.89 0.84 0.84 0.83 0.78 RMSE 1.38 0.71 1.91 1.05 0.69 1.51 3.04 2.06 3.90
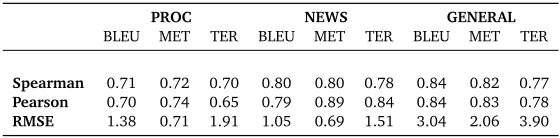
Table 3: Leave-one-out crossvalidation results for the regression algorithm. We present three different performance metrics: Sperman’s rank correlation, Pearson correlation and RMSE. We trained different regression models to fit BLEU, Meteor and TER across three different domains (general, news and proceedings.)
values and rank (order) of our predicted variables are correlated to the values and ranks of the actual values. In other words, how monotonic is the relationship between the predicted and real values. The formula for the correlation is:
ρ= Pm
j(xj−¯x)(yj−¯y) ÆPm
j(yj−¯y)2Pmj(xj−¯x)2
(7)
where eachxjandyjare values (for Pearson’s) or ranks (for Spearman’s). 4.4.1 Cross-validation
Given the reduced amount of data we had (252 training instances), we opted to use leave-one-out cross validation instead of having separate training and test sets. Thus, we trained our models in all-but-one instances, and used the remaining one for testing purposes. We repeated this process for each of our training instances. For our parameter analysis, used the average parameter values of all iterations of our cross-validation.
In Table 3 we observe the results for each of the document sets (general, news, proceedings) and for the each of the three translation quality metrics used.
First, note that correlation (both rank and real-valued) we observe large correlation values (> 0.65). This indicates that our regression algorithm is doing a good job in predicting translation quality using the available information. However, notice that we have a larger correlation values for the general set. This hints that our algorithm can benefit from having additional training data for making more accurate estimations. This is despite the fact that the general set has the highest variance, which naturally results in a higher RMSE.
5 Analysis
By using linear regression, we find the parameter vectorθthat minimizes the error between our prediction and the actual values of the metrics. By looking at the values of each specificθi we can deduce the relative importance of the relationship between a certain featureXiand the quality metricy.
Keys Description BLEU MET TER General
Const Constant term 28.57 33.81 54.15
PT4* Translation model direct lexical entropylex(e|f) -6.28 -3.99 7.78 FPSL* Average length of source phrases used in first-best 5.88 5.06 -8.09 PNE* Translation model size (options) 5.54 2.52 -5.87 PSL* Translation model average length of source phrases -4.42 -2.91 5.55 FPTL Average length of target phrases used in first-best -2.37 3.90 Proceedings
Const Constant term 28.60 33.83 55.47
FD0* Distance-based reordering cost 0.89 0.55 -0.86 FTG* Target Gaps in the alignment of first-best -0.69 -0.30 1.11 PT4 Translation model direct lexical entropylex(e|f) -1.20 0.74 FD4 Right-monotone lexicalized reordering cost -0.40 0.63
News
Const Constant term 21.22 29.54 60.50
[image:10.420.45.365.69.306.2]FT2* Direct lexical costlex(f|e) 1.19 0.92 -1.82 FCR* Average number of alignment crossings of first-best -1.64 -1.10 2.41 FD3* Left-discontinuous lexicalized reordering cost 1.05 0.76 -1.99 PCR* Translation model average number of alignment crossings -0.87 -0.80 1.66 FSG Source Gaps in the alignment of first-best -0.73 1.16
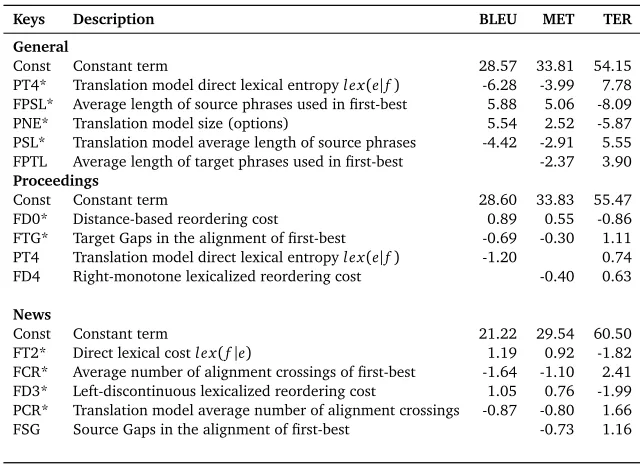
Table 4: Most important features for the regression models for BLEU, Meteor and TER. For simplicity, only those features shared across two or more objective functions are shown. Features that are important to all metrics are marked with a (∗). Notice that for TER (lower is better) the weights have opposite sign than for BLEU and Meteor (higher is better)
have an average of 0 and variance of 1), the magnitude of the scores allows us to compare the strength of the relationship across features.
In Table 4 we present the top five variables for our models, for each of the different scenarios: general, proceedings and news. To further highlight the agreement of the most important features across BLEU, Meteor and TER, we only present those features which are most important to at least two of these quality metrics. We do so to facilitate the analysis.
5.1 General set
For the general models, one of the most important features is the direct lexical entropy of the translation model (PT4). This feature has a negative weight for translation quality which
indicates that the more lexical entropy we have in our model, the worse translations we will have. In other words, given a specific source phrasef, there should be little ambiguity of which is the best translation for it.
The next important feature is the length of the source phrases used to construct our translation (FPSL). This feature indicates that the fewer phrases we need to translate a sentence, the more
reliable our translations will be.
Another feature of importance is size of the translation model (PNE). This variable indicates
that the more translation options we have in our translation model, the better results we will be able to obtain across metrics. This can be interpreted as the importance of coverage. Not only to reduce the number of unseen words, but also to have a good inventory of phrases. Finally, another feature that is present is the average length of the source phrases in the translation model (PSL). In this case, the feature has a negative weight, which indicates that
the longer the phrases in the translation model, the worse our translations are. This result is opposite to that ofFPSLand could be interpreted in two ways: First, that this is a shortcoming
of performing linear regression with two correlated features, (overshooting the weight for one variable can be compensating by setting the complementary with a negative weight). The other interpretation, which we favor, is that usually longer phrases also allows for more noise within boundaries (e.g. more source gaps in the alignment), which are an indication of a poorer model estimation.
In summary, when dealing with an unknown test set, we should aim for larger models (coverage), that are of the best quality possible (low entropy, good estimation).
5.2 News set
One interesting result comes from the news set, where the coverage is considerably lower. These results, however, need to be taken with a grain of salt, as due to the fewer number of training instances regression results (even if regularized) can be unstable.
For the news set, the direct lexical cost (FT2) is an indicator of better translations. This result is
rather counter-intuitive, given that we would expect that better translations are formed using phrases with higher probability. One possible interpretation for this is that in the news set better translations require words, which are less frequently seen and which therefore are penalized with low lexical scores.
Additionally we have three juxtaposing features that regard distortion and reordering. On one hand, the number of alignment crossings at the phrase-table level (PCR) and at hypothesis level
(FCR) indicate that the use of phrases that carry local reordering (more alignment crossings) has
a negative effect on translation quality. On the other hand, we have a preference for hypotheses that have discontinuous reordering.
5.3 Proceedings set
For this type of documents, where coverage is not an issue, translations benefit from having longer distance reorderings (FD0). Also, the negative weight of variable (FTG) indicate that
phrases which lack alignment support (have more target gaps in the alignment), trend to degrade the quality of the translation. Ill-defined, high entropy direct translation model lexical features will hurt performance (PT4). These results are more in line with the expected behavior
of a translation system. Furthermore, as we will present later, they will allow us to perform quick fixes that will result in a gain in translation quality.
5.4 Discussion
Notice that a constant in our models is the lack of a language model component as an important predictor for translation quality. This is a result of our translations being generated using a single language model but different phrase-tables. This does not mean, however, that language models do not matter in translation, but it is merely a result of our experimental design. As we observed, some of the results rather counter-intuitive and the interpretation is difficult, especially the case for the news test. More data needs to be analyzed in order to make more reliable estimations. However, we should note that there is a consistent agreement between features that are important for BLEU, Meteor and TER.
It is well known that the behavior of translation systems depend on many factors, not only on the techniques used for generating translation models or the choices of a specific aligner or symmetrization heuristic. While the results in our study might not be applicable to every possible scenario or language pair, our purpose is not to attain the highest level of generalization, but to encourage the use of analytic methodologies for the design of targeted systems.
6 Practical considerations
While the focus of this paper is the analysis of the most important features for translation quality, which in itself is an important goal, the application of the acquired knowledge is essential for the improvement of translation systems. Therefore, below we provide a set of pointers on how to address specific issues. Furthermore, we provide one case scenario where using this information gives positive results for the in-domain translation task.
6.1 Addressing target gaps: a practical case study
From our models for in-domain data, we observed that translation hypotheses with more target gaps have lower translation quality. Inspired by that fact, and to give the decoder more control over the gaps in the translation hypotheses we introduce a new decoding feature that takes into account the alignment gaps information and uses it dynamically at decoding time. This might be regarded as a low hanging fruit, but it showcases the potential of our methodology. As we will observe later, using such a feature enables the decoder to turn an originally liability (more gaps meant less translation quality) into an asset. The target gap decoding feature (hf t g) is defined as follows:
hf t g(e1I,f1J) =J− X
j∈J Y
i∈I
(1−l(i,j)) (8)
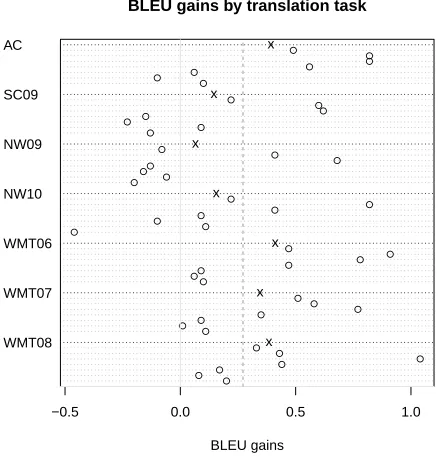
models, which were generated from the alignments we had analyzed previously (DWA-4 to DWA-7, grow-diag, grow-diag-final, grow-diag-final-and). The considered documents were both in-domain Europal test-sets (WMT06, WMT07, WMT08), the also limited domain Acquis corpus (AC) and the News test sets (NW09, NW10, SC09). The translation results are shown in Figure 1. In the image, we see the gains for each of the systems (circles) with respect to their baseline.
● ● ● ● ● ● ● ● ● ● ● ● ● ● ● ●● ● ● ● ● ● ● ● ● ● ● ● ● ● ●● ● ● ● ● ● ● ● ● ● ● ● ● ● ● ● ● ● AC SC09 NW09 NW10 WMT06 WMT07 WMT08 x x x x x x x
−0.5 0.0 0.5 1.0
BLEU gains by translation task
BLEU gains
Figure 1: BLEU gains of systems using the target gap feature segmented by test-document. On the left axis we present the different document groups. On the horizontal axis, the gains of BLEU∆BLEU=BLEUf t g−BLEUbl. For each document set, the overall average gain is marked with anx. The general average is represented by the vertical dashed line.
[image:13.420.108.327.146.377.2]Notice also, how there is a marked difference between clusters of points. For WMT06, we observe three points with almost no gain, while other points have stronger gains. Upon analysis, we discovered that the no-gain group consists on translation models based on heuristics (grow-diag, etc.), which allow for less gaps in the target phrases than the discriminative type of alignments.
6.2 Addressing other issues
Lexical entropy has arisen as an important factor in several of our models. More entropy can lead to modeling errors. One possible alternative to address this problem is to use phrase-table filtering. Filtering techniques have already been proven effective to shrink the footprint of translation models. The challenge however is to preserve the balance between high coverage and low entropy.
Another problem is how to favor longer, yet well defined, phrases. One possibility would be to include the source entropy information for each phrase pair, as a translation feature. In this way, the decoder would be able do counterbalance length vs. entropy for the phrases. There are many other fixes that could be suggested. Unfortunately, addressing each of them would be lengthy, and out of the scope of this paper.
7 Conclusions and future work
In this paper, we presented a framework to analyze the differences in translation quality between several translation systems based on characteristics of their translation models and hypotheses. We use multivariate linear regression to predict different translation quality metrics using a wide range of features. We measured its performance in different scenarios and with different objective functions. We analyzed the results of our regression models emphasizing on the most important features that contribute to explain quality in terms of BLEU, Meteor and TER. Some of the conclusions from these models are straightforward and match the empirically developed intuition. However, the insight gained from this type of analysis can be valuable for designing new systems for new translation tasks. To this end, we gave hints on how this information can be used and provided a practical example on how the information from the regression models can be transformed into features to improve translation.
References
Ayan, N. F. and Dorr, B. J. (2006). Going Beyond AER: An Extensive Analysis of Word Alignments and Their Impact on MT. InProc. of the Joint Conference of the International Committee on Computational Linguistics and the Association for Computational Linguistics (COLING-ACL), pages 9–16.
Birch, A., Osborne, M., and Koehn, P. (2008). Predicting Success in Machine Translation. In Proc. of the 2008 Conference on Empirical Methods in Natural Language Processing (EMNLP), pages 745–754.
Dagan, I., Glickman, O., and Magnini, B. (2006). The pascal recognising textual entail-ment challenge.Machine Learning Challenges. Evaluating Predictive Uncertainty, Visual Object Classification, and Recognising Tectual Entailment, pages 177–190.
Denkowski, M. and Lavie, A. (2011). Meteor 1.3: Automatic Metric for Reliable Optimization and Evaluation of Machine Translation Systems. InProc. of the Workshop on Statistical Machine Translation at the Conference on Empirical Methods in Natural Language Processing, pages 85–91.
Devlin, J. and Matsoukas, S. (2012). Trait-based hypothesis selection for machine translation. InProceedings of the 2012 Conference of the North American Chapter of the Association for Computational Linguistics: Human Language Technologies, pages 528–532, Montréal, Canada. Association for Computational Linguistics.
Fraser, A. and Marcu, D. (2007). Measuring Word Alignment Quality for Statistical Machine Translation.Computational Linguistics, 33:293–303.
Guzman, F., Gao, Q., and Vogel, S. (2009). Reassessment of the Role of Phrase Extraction in PBSMT. InProc. of the Machine Translation Summit XII, pages 49–56.
Koehn, P. (2004). Statistical Significance Tests for Machine Translation Evaluation. InProc. of Conference on Empirical Methods for Natural Language Processing (EMNLP), volume 4, pages 388–395.
Koehn, P., Hoang, H., Birch, A., Callison-burch, C., Federico, M., Bertoldi, N., Cowan, B., Shen, W., Moran, C., Zens, R., Dyer, C., Bojar, O., Constantin, A., and Herbst, E. (2007). Moses: Open Source Toolkit for Statistical Machine Translation. InProc. of Association of Computer Linguistics, pages 177–180.
Koehn, P., Och, F. J., and Marcu, D. (2003). Statistical Phrase-based Translation. InProc. of Human Language Technology Conference of the North American Chapter of the Association of Computer Linguistics (HLT-NAACL), pages 127–133.
Lambert, P., Gispert, A., Banchs, R., and Mariño, J. B. (2006). Guidelines for Word Alignment Evaluation and Manual Alignment.Language Resources and Evaluation, 39(4):267–285.
Lambert, P., Petitrenaud, S., Ma, Y., and Way, A. (2010). Statistical Analysis of Alignment Characteristics for Phrase-based Machine Translation. InProc. of the 14th Annual conference of the European Association for Machine Translation (EAMT).
Lopez, A. and Resnik, P. (2006). Word-based Alignment, Phrase-based Translation: What’s the Link? InProc. of the 7th Biennial Conference of the Association for Machine Translation in the Americas (AMTA), pages 90–99.
Niehues, J., Herrmann, T., Mediani, M., and Waibel, A. (2010). The karlsruhe institute for technology translation system for the acl-wmt 2010. InProceedings of the Joint Fifth Work-shop on Statistical Machine Translation and MetricsMATR, pages 144–148, Uppsala, Sweden. Association for Computational Linguistics.
Niehues, J. and Vogel, S. (2008). Discriminative Word Alignment via Alignment Matrix Modeling.Computational Linguistics, pages 18–25.
Pado, S., Galley, M., Jurafsky, D., and Manning, C. D. (2009). Robust machine translation evaluation with entailment features. InProceedings of the Joint Conference of the 47th Annual Meeting of the ACL and the 4th International Joint Conference on Natural Language Processing of the AFNLP, pages 297–305, Suntec, Singapore. Association for Computational Linguistics.
Papineni, K., Roukos, S., Ward, T., and Zhu, W.-j. (2002). Bleu: a Method for Automatic Evaluation of Machine Translation. In Proc. of the 40th Annual Meeting of the Association for Computational Linguistics (ACL), pages 311–318.
Snover, M., Dorr, B., Schwartz, R., Micciulla, L., and Makhoul, J. (2006). A Study of Translation Edit Rate with Targeted Human Annotation. InProc. of Association for Machine Translation in the Americas (AMTA), pages 223 – 231.
Specia, L. (2011). Exploiting objective annotations for measuring translation post-editing effort. InProceedings of the 15th Conference of the European Association for Machine Translation, pages 73–80.