Investigation on Plasmon Induced Transparency and Its Application
in an MIM Type Compound Plasmonic Waveguide
Jinping Tian1, 2, 3, * and Jiejin Li1
Abstract—In this paper, the investigation about a metal-insulator-metal (MIM) compound plasmonic waveguide is reported, which possesses the transmission property of plasmon induced transparency (PIT) and exhibits the potential application of refractive index sensing. The waveguide structure consists of an MIM-type bus waveguide, a horizontally placed asymmetric H-type resonator (AHR), and a circular ring resonator (CRR). The AHR is directly coupled with the bus waveguide, while the CRR is directly coupled to the AHR, but is indirectly coupled to the bus waveguide. Due to the destructive interference between two different transmission paths, PIT effect can be observed in the transmission spectrum. The finite element method (FEM) is used to study the PIT effect in detail. The results show that the transmission characteristics can be flexibly adjusted by changing the geometric parameters of the structure, and the proposed waveguide structure has potential application prospects in the area of temperature and refractive index sensing with higher sensitivity, better figure of merit, and in the area of slow light photonic devices.
1. INTRODUCTION
In recent years, the research and design of photonic devices have become a hot spot, because of their advantages of broad bandwidth, high density, high speed, and low dissipation [1–5]. However, due to the existence of the diffraction limit, the transverse size of the device is generally in the order of micron meters, which seriously hinders the development of photonic devices. To solve this problem, the use of surface plasmon polaritons (SPPs) is proposed, which is the electromagnetic field mode formed by the coupling of photons and free electrons on the metal surface. SPPs can propagate along the metal-dielectric interface and decay exponentially on both sides of the interface. A large number of studies have shown that SPPs can break through the limitation of diffraction limit and confine electromagnetic wave to sub-wavelength size [6, 7]. Therefore, studying the transmission characteristics of SPPs can provide a new idea for the miniaturization and high-density integration of optoelectronic devices. Among the numerous investigating branches, MIM type surface plasmon optical waveguides are widely used in the design of sub-wavelength photonic devices because of low transmission loss, easy fabrication, and strong electromagnetic field confinement, such as coupler [8], filter [9, 10], interferometer [11], sensor [12, 13], and beam splitter [14]. Furthermore, researchers have also carried out extensive research on the novel feature of PIT effect, which is a phenomenon based on the interaction of SPPs propagating in different resonators and along different paths. It refers to the occurrence of a transmission peak at the position of the original transmission dip [15–18] due to the destructive interference. PIT is a phenomenon similar to the well known electromagnetically induced transparency (EIT) in atomic physics, which has been widely used in optical storage, nonlinear optics, and optical signal processing [19, 20]. In recent years,
Received 20 October 2019, Accepted 20 December 2019, Scheduled 7 January 2020
* Corresponding author: Jinping Tian ([email protected]).
1 School of Physics & Electronics Engineering, Shanxi University, Taiyuan 030006, P. R. China. 2Computer Center, School of Modern
PIT effects in MIM type plasmonic waveguide structure have been widely studied. In 2016, He and Yang designed a plasmonic waveguide system consisting of a bus waveguide with a stub and a ring resonator located on both sides of it to achieve the PIT effect [21]. In 2017, Noual et al.? realized the PIT effect by coupling two horizontally placed rectangular cavities on both sides of a MIM bus waveguide [22]. In 2018, Wang et al. realized the PIT effect by placing a trapezoid resonator and a horizontally placed rectangular resonator to the same side of an MIM bus waveguide [23]. These papers mainly focus on the formation and adjustment of the PIT transmission characteristics, slow light effects, and potential applications of the refractive index sensing properties. To be noted is that the refractive index of some dielectric media is highly sensitive to the temperature, thus based on this idea, temperature sensors can also be achieved by utilizing the specific medium filled in resonators of the MIM type plasmonic waveguides.
In this paper, inspired by the reported research achievements, an MIM type compound plasmonic waveguide structure is designed, which consists of a straight bus waveguide, a horizontally placed AHR, and a CRR. Moreover, as far as we know, the MIM plasmonic waveguide structure using AHR as a resonator has not ever been proposed. Compared with the common stub resonator, slot resonator, ring resonator, and disk resonator, the use of AHR will provide more freedom in adjusting its resonance characteristics. By using the FEM-based COMSOL Multiphysics software with perfect matched layer (PML) absorption boundary condition, the influences of geometry parameters, such as the radius of the CRR, the coupling distance between the CRR and AHR, and the coupling distance between the AHR and bus waveguide, on the transmission characteristics of the proposed structure are studied in detail. During the simulation, convergence analysis is carried out, and the nonuniform mesh grid is adopted to ensure the speed and accuracy of the calculation. The mesh grid in the narrowest area is more than ten layers, while the maximum mesh size is 10 nm. Meanwhile, the simulation results are verified using the time domain coupled mode theory (CMT). In addition, the properties of temperature sensing and refractive index sensing are also studied. At last, the slow light effects are studied.
2. MODEL AND THEORY
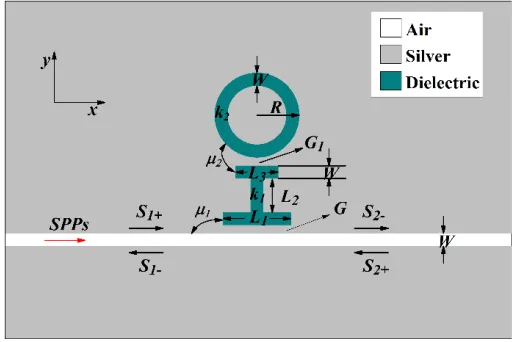
The two-dimensional schematic diagram of the proposed plasmonic waveguide is shown in Figure 1, wherein the white area is air with refractive index n0 = 1, and its width is set as W = 50 nm to
ensure that only the fundamental TM type SPPs mode can be excited and transmitted [3, 14, 23]. The green areas are two resonant cavities which are supposed to be filled with water at the initial stage with refractive indexn= 1.33. For simplicity, the width of the two resonant cavities is also set asW, and the vertical gap between them isG1, which will determine the coupling strength between the two resonators.
As will be discussed below, adjustingG1can tune the bandwidth of the PIT like transmission spectrum
to a certain extent. The top resonator is a CRR, and its outer radius is R. The bottom resonator is
a horizontally placed AHR, of which L1, L2, and L3 are respectively the length of the lower branch,
the vertical slot, and the upper branch. Here, we only consider the case of L1 = L3 that is why it
is called as an AHR. The coupling distance between the AHR and bus waveguide is set as G, and by adjusting the value ofG, the transmission intensity can be changed. In this paper, the use of AHR can not only increase the coupling strength between the AHR and bus waveguide as well as that between the AHR and CRR because of the enlarged coupling areas, but also achieve the tuning effect of the transmission properties. The gray area is silver, of which the dielectric constant is described by the Drude model [24, 25]:
εm(ω) =ε∞− ω2p
ω(ω+iγ) (1)
where ε∞ = 3.7 is the relative dielectric constant of the infinite frequency, ωp = 1.38×10¹⁶Hz the
plasma frequency,γ = 2.73×10¹³Hz the electronic oscillation frequency, and ω the angular frequency of the incident light wave. The dispersion relation of the fundamental mode in MIM type plasmonic waveguide can be expressed by the following relationship [26–28]:
tanh
Wβ2−k2 0εd
2
= −εi
β2−k2 0εm(ω) εm(ω)
β2−k2 0εd
(2)
where β = neff ×k0 is the complex propagation constant of SPPs, neff the mode effective refractive index, k0 = 2π/λ the wave vector in vacuum, λ the wavelength of the incident light in vacuum, and
εd = n2 and εm are respectively the dielectric constant of the dielectric and the silver. The SPPs
propagating in the bus waveguide can enter the AHR through direct coupling, which can be seen as a bright mode cavity. When the resonance condition of AHR is satisfied, most of the SPPs power can be captured into it to form resonance. Meanwhile, the SPPs power can also enter the CRR through the near field coupling with the AHR, but can not directly couple with the bus waveguide, which can be seen as a dark mode cavity. The resonance condition of the CRR and slot cavity can be respectively described by [29–31]:
2π×r×Re (neff) =mλ, (m= 1,2,3...) (3a)
λ = 2Reneff×L/m−Δϕ/2π, (m = 1, 2,3...) (3b)
wherer =R−W/2 is the effective radius of CRR, andL is the length of the slot cavity. Re(neff) and Re(neff) are the real part of the effective refractive index of the CRR and the slot cavity, respectively.
λand λ represent the resonant wavelength, while m and m represent the resonance order. Δϕis the additional phase shift due to the reflection at the ends of the slot cavity, which is often a small value relative to 2π. According to Eq. (3a), increasing the radius of the CRR and Re(neff) will lead to the increase of the resonant wavelength. Based on Eq. (3b), one can estimate the length of a slot cavity for a given resonant wavelength.
In order to analyze the transmission characteristics of the SPPs in the coupled waveguide structure, the CMT is often adopted [18, 32, 33]. As shown in Figure 1, S1+,S1−, and S2− are the amplitude of
the incident, reflected and transmitted SPPs in the MIM bus waveguide, while S2+ = 0 is assumed
for the aim of simplicity. k1 and k2 represent the intrinsic losses of the AHR and CRR, respectively.
μ1 represents the coupling coefficient between the bus waveguide and AHR, while μ2 represents the
coupling coefficient between the AHR and CRR. According to the CMT, the time evolution of the mode amplitudes A,B of the SPPs in the AHR and CRR can be expressed as:
dA
dt = (jωA−k1−μ1)A+
√
μ1S1+−jμ2B (4)
dB
dt = (jωB−k2)B−jμ2A (5)
where ωA and ωB are the resonant frequencies of the AHR and CRR, respectively. According to the
law of conservation of energy and the symmetry of time inversion, the following relationship is always true:
Then the transmission rate of the designed MIM type compound plasmonic waveguide structure can be obtained:
T =S2−
S1+
2=1− μ1[j(ω−ωB) +k2]
[j(ω−ωB) +k2] [j(ω−ωA) +μ1+k1] +μ22
2 (7)
3. SIMULATION AND DISCUSSION
At first, the transmission spectrum with only the AHR is studied, and the simulated result is shown in Figure 2(a) by black solid line with L1 = 220 nm, L2 = 150 nm, L3 = 160 nm, and G = 15 nm.
It should be noted that the selection of these geometric parameters is mainly to ensure that the waveguide size is sub-wavelength within the considered wavelength range. The following research will prove that the position of the resonance within the given wavelength range can be adjusted by selecting appropriate cavity geometry parameters. It can be seen that there are two transmission dips at 992 nm and 1752 nm within the given wavelength range. The magnetic field distributions corresponding to these two transmission dips are indicated in Figures 2(b) and (c), respectively. When the wavelength is 992 nm, it can be seen from Figure 2(b) that a novel and interesting phenomenon that the magnetic field is mainly distributed at the lower branch of the AHR is demonstrated, which is similar to the first order resonance of a horizontal slot cavity. The physical background of this phenomenon can be obtained by the theoretical analysis based on Eqs. (1), (2), and (3b). Considering the first order resonance of a slot cavity withm ≈1 andλ ≈992 nm, the estimated value of cavity lengthLis very close to the length of the lower branch of the AHR. Therefore, we can think about that the first order resonance is excited in the lower branch of the AHR, and at this time, because the vertical slot of the AHR is exactly located at the field node of the first order resonance, SPPs hardly flow into the vertical slot and the upper branch of the AHR. When the wavelength is 1752 nm, however, it can be seen from Figure 2(c) that the magnetic field mainly distributes at the upper and lower branches of the AHR. The red and blue solid lines in Figure 2(a) represent the corresponding absorption and reflection. The relationship among the reflection (R), absorption (A), and transmission (T) can be written as A= 1−T−R.
(a) (b)
(c)
Figure 2. (a) Transmission (black), absorption (red), and reflection (blue) spectra when the CRR is absent. Distributions of the magnetic field components Hz at (b) λ= 992 nm and (c) λ= 1752 nm.
Next, when a CRR with radiusR = 175 nm and coupling distance G1 = 15 nm is placed near the
(a)
(c) (d) (e) (f)
(b)
Figure 3. (a) Transmission (black), absorption (red), and reflection (blue)spectra when the CRR is placed close to the top of the AHR. (b) Comparison between the FEM result and CMT fitting result. Distribution of the magnetic field components Hz corresponding to the wavelengths marked by (c) dip I, (d) dip II, (e) peak I, and (f) dip III.
mechanism that leads to the production of this PIT phenomenon is usually explained by a three-level model, in which the incident bus waveguide can be regarded as the ground state|0. The AHR that can be directly coupled with the incident bus waveguide can be regarded as the radiative plasmonic state (bright mode) |1, while the CRR cannot be directly excited by the incident light and is considered to be the dark plasmonic state (dark mode)|2, which can only be excited by the near-field coupling with the bright mode. The PIT effect is caused by the destructive interference between the two transmission paths |0 → |1 and |0 → |1 → |2 → |1. The red and blue solid lines in Figure 3(a) represent the absorption and reflection, respectively. The red dotted line in Figure 3(b) is the fitting result according to the Eq. (7) of CMT, and the good consistency further confirms the accuracy of the research results. In order to better understand the physical mechanism behind the above phenomenon, the corresponding distributions of magnetic field component Hz at the transmission dips and peak are respectively shown in Figures 3(c)–(f). For the transmission dip I at the shortest wavelength, as can be seen in Figure 3(c), because most of the SPPs power is confined in the lower branch of the AHR, there is little SPPs power can enter CRR through near-field coupling, and as a result, the use of CRR will not change the original transmission spectral line shape. Figures 3(d) and (f) correspond to transmission dips II and III, respectively. It can be seen from the figures that in-phase and out-of-phase coupling will occur between the AHR and CRR, respectively, and most SPPs are coupled into the two resonators through near-field coupling. As a result, most of the SPPs are well confined in the two resonators, and few SPPs can be transferred to the output waveguide. However for Figure 3(e) corresponding to the transmission peak I, the CRR is effectively excited, while the AHR is suppressed due to the destructive interference between the two transmission paths, thus most of the SPPs can be transferred to the output waveguide.
(a) (b) (c)
Figure 4. (a) Transmission spectra for different radius R of the CRR. (b) Red line is the resonant wavelength of the CRR as a function of the radius R, blue line is the resonant wavelength of the AHR corresponding to the right transmission dip shown in Figure 2(a). (c) Wavelengths at dip I, dip II, peak I and dip III as a function of the radiusR of the CRR.
to big, thus the asymmetry of the transmission peak will also experience a similar procedure together with the drop of dip II and the rise of dip III. This phenomenon can also be interpreted in terms of Figure 4(b), in which the red line is the resonant wavelength of the CRR with different R which is calculated directly from Eq. (1), Eq. (2), and Eq. (3a), while the blue line is the resonant wavelength of 1752 nm corresponding to the right transmission dip shown in Figure 2(a). It is obvious that the discrepancy of the resonant wavelength between the AHR and CRR will undergo a process from big to small and then to big, and at the position of about R = 177.5 nm, their resonant wavelengths are nearly the same, which means the perfect PIT effect with symmetric transmission spectrum. Therefore, as a potential application, nanoscale stopband filter with three working bands is achieved, of which the band with short wavelength is fixed, but the center position of the two bands with long wavelength can be flexibly adjusted by changing the radius of the CRR. Figure 4(c) shows the dependency of the wavelength of transmission peak and three transmission dips on the radiusR of the CRR.
The parameters that affect the resonant properties of the AHR areL1,L2, andL3. The influences
of the upper branch length L3 and lower branch length L1 of the AHR on the transmission spectrum
are shown in Figures 5(a) and (b), respectively. When the lower branch lengthL1 = 50 nm, the AHR
becomes a symmetric T-shaped resonator, and its resonant wavelength is very far away from both the first and second order resonant wavelengths of the CRR. Therefore, while the T-shaped resonator is in resonance, the CRR cannot be well excited at all, so there is only one transmission dip in the transmission spectrum, as shown in the topmost panel of Figure 5(a). With the increase of L1, the
T-shaped resonator becomes a horizontally placed AHR. It is found that whenL1 < L3, there is only
one type of stronger resonant mode in the AHR while its resonant wavelength will increase with the increase ofL1, and gradually approaches the first order resonant wavelength of the CRR, leading to the
more and more obvious PIT effect appearing in the spectrum. WhenL1≥L3, another type of resonant
mode will occur in the AHR, and the resonance is excited only in the lower branch of AHR with shorter resonant wavelength, which will increase with the increase of L1. Because this type of resonant mode
can hardly be coupled with the CRR, PIT effect cannot be formed near this wavelength, as can be seen from the leftmost transmission dip in the bottom two panels of Figure 5(a). However, the original long-wavelength resonant mode in the AHR can always be excited during the process of increasing L1,
which can be always interfered destructively with the first order resonant mode excited in the CRR, thus ensuring the existence of PIT effect when L1 increases, but it will be red shifted. Figure 5(b)
shows the transmission spectra corresponding to the increase of the upper branch length L3 of the
AHR from 50 nm to 180 nm. During this process, there always exist two types of resonant mode in the AHR, i.e., the short-wavelength resonant mode excited in the lower branch of the AHR and the long-wavelength resonant mode excited in the whole AHR. With the increase ofL3, the length of the lower
branch of the AHR is unchanged, so the location and spectral line shape corresponding to the leftmost transmission dip do not change. But asL3 increases from 50 nm to 180 nm, the wavelength of the
(a)
(c)
(b)
(d)
Figure 5. Transmission spectra under different value of (a) the lower branch length L1, and (b) the
upper branch length L3 of the AHR for the proposed waveguide structure. Comparison between the
transmission spectra with only CRR and with only AHR under different value of (c) the lower branch length L1, and (b) the upper branch lengthL3.
order resonant wavelength of the CRR, thus the PIT effect becomes more and more obvious. This can also be interpreted with the help of Figures 5(c) and (d). It is known that to form the PIT like effect, the transmission spectra of a sole CRR and a sole AHR must overlap effectively to generate destructive interference. As shown in Figures 5(c) and (d), for given parameters, the spectral line of the CRR is fixed with its transmission dip wavelength located at about 1740 nm. Meanwhile, the transmission spectrum of the AHR will have a red shift with the increase ofL1 orL3. During this process, the two
transmission spectra will experience a process of approaching, overlapping, and separating, and as a result, the PIT like effect will undergo a process of gradually establishing, enhancing, weakening, and disappearing. When L1 orL3 increases up to a certain value, the reduced overlap of the spectral lines
(a) (b)
Figure 6. (a) Transmission spectra under different value of the vertical branch lengthL2 of the AHR.
(b) Wavelengths at dip I, dip II, peak I and dip III as a function of the vertical branch lengthL2 of the
AHR.
(a)
(b)
Figure 7. Transmission spectra under different value of the coupling distance (a)Gand (b) G1.
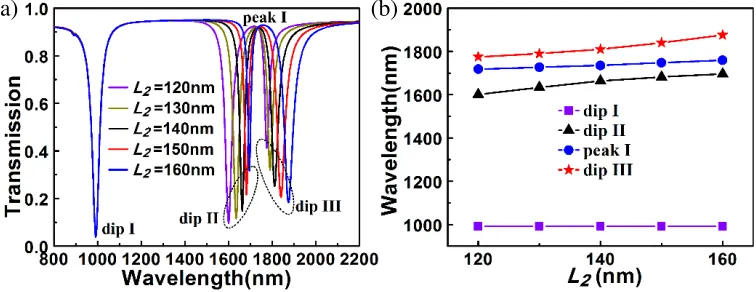
Figure 6(a) demonstrates the transmission spectra under value of the vertical branch length L2 of
the AHR. It is obvious that the increase ofL2 from 120 nm to 160 nm cannot bring any change to the
length of the lower branch of the AHR, but will change the resonant length of the whole AHR. So the location and spectral line shape of the transmission dip I with short resonant wavelength excited only in the lower branch of the AHR do not change. But for the long-wavelength resonant mode excited in the whole AHR, with the increase of L2, its resonant wavelength will have a red shift from the value
less than that of the first order resonant wavelength of the CRR to the value larger than that, thus the symmetry of the occurred PIT spectral line shape will have a corresponding change trend, and the transmission dip II and III exhibit the trend of rising and dropping, respectively. Figure 6(b) shows the wavelengths at dip I, dip II, peak I, and dip III as a function of the vertical branch length L2 of the
AHR.
The remaining parameters that affect the transmission properties of the proposed waveguide structure are the coupling distances G and G1. Keeping G1 = 15 nm unchanged and increasing the
coupling distanceGbetween the bus waveguide and the AHR from 10 nm to 30 nm with a step of 5 nm, the simulated transmission spectra of the structure are shown in Figure 7(a). Theoretically, based on Eqs. (3a) and (3b), it is known that the resonant wavelengths of the CRR and AHR do not depend on parameters G and G1. Besides, peak I is originated from the destructive interference between the
resonant modes of CRR and AHR. So adjusting parameters Gand G1 within a proper range will not
rising. This is because the increase of the coupling distance weakens the coupling between the bus waveguide and AHR, thus the amount of SPPs power entering the AHR through near-field coupling is reduced, and the transmitted SPPs power is increased. Another result coming from the decreasing coupling strength is that the effective refractive index of the resonant modes excited in the AHR will decrease slightly, which will lead to the decrease of the resonant wavelength. In addition, in terms of the Eq. (10) obtained in [34], the width of the transmission dip will decrease with the decreasing coupling strength. Meanwhile, when G = 15 nm is unchanged, the increase of the coupling distance
G1 between the AHR and CRR will have no effect on the resonant mode excited in the lower branch
of the AHR, so the line shape and location of the left most transmission dip do not change, as shown in Figure 7(b). But for the PIT like spectral line, as G1 increases from 10 nm to 30 nm, the gradually
decreasing coupling strength between the AHR and CRR will weaken the PIT effect. At this time, due to the asymmetry of the transmission spectrum resulted from the discrepancy between the resonant wavelengths of two resonators, the two transmission dips on both sides of peak I will get closer to each other with different speeds. Finally, the transmission spectrum will tend to the case that the CRR is absent whenG1 is larger enough.
Furthermore, the potential application of the designed structure in the field of nanoscale sensors is studied, because the PIT like effect is always accompanied by a phase abrupt process, that is, in a very short wavelength interval, there will be a rapid change from the transmission dip (peak) to the transmission peak (dip). Therefore, it will provide higher sensitivity than the normal plasmonic waveguide. To this end, the AHR and CRR are filled with temperature sensitive ethanol at first, of which the dependence of its refractive index and ambient temperature can be written as [35, 36]:
n= 1.36048−3.94×10⁻⁴(T−T0) (8)
whereT is the ambient temperature, andT0 = 20◦C is the room temperature. Furthermore, the
thermo-optical coefficient of silver is two orders of magnitude smaller than that of ethanol, so the influence of temperature on the silver can be neglected [36]. According to Eq. (8), the increase of temperature T
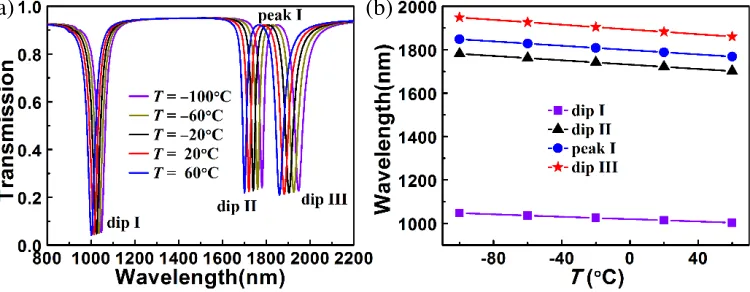
will reduce the refractive index of ethanol. Considering that the melting point and boiling point of ethanol are −114.3◦C and 78◦C, respectively, Figure 8(a) demonstrates the transmission spectra when the ambient temperature T is increased from −100◦C to 60◦C with a step of 40◦C. It can be seen from the figure that with the increase of temperatureT, the whole transmission spectra exhibit a trend of blue shift. This can be explained through Eqs. (2), (3a), and (3b), of which the value of Re(neff) will decrease with the decrease of the refractive index of the ethanol, resulting in the decrease of the resonant wavelength of the two resonators. Besides, the temperature-dependent sensitivity S is one of the important indexes for evaluating the temperature sensing characteristics, which is described as [36]:
S = Δλ/ΔT (9)
where S denotes the change of resonant wavelength caused by the unit change of the ambient temperature, and Δλ and ΔT denote the change of the resonant wavelength and the temperature,
(a) (b)
respectively. Figure 8(b) proves that the variation of the resonant wavelength at dip I, dip II, peak I, and dip III with the ambient temperatureT is almost linear, which is consistent with Eqs. (3a) and (3b). The calculated temperature sensitivities corresponding to the transmission dip I, dip II, peak I, and dip III are−0.275 nm/◦C, −0.5 nm/◦C, −0.5 nm/◦C, and−0.55 nm/◦C, respectively. The device is not only helpful to the design of compact optical temperature sensors for photonic integrating, but also can be used as a tunable SPPs stopband filter by controlling the temperature.
In order to further study the sensing performance of the device, let us consider the refractive index of the dielectric medium filled in the two resonators ranges from 1 to 1.6, covering the common gases, liquids, and biomolecules in DNA [37]. Figure 9(a) indicates the transmission spectra when the AHR and CRR are filled with air (n = 1), water (n = 1.33), ethylene glycol (n ≈ 1.41), and bromoform (n= 1.56). For simplicity, the working wavelength is limited within the range of 1200 nm to 2400 nm. It can be seen that corresponding to the four different dielectric media, the transmission spectrum undergoes a significant red shift, which can be interpreted according to Eqs. (3a) and (3b). The complete numerical simulation results are shown in Figure 9(b), which further confirm the accuracy of the research results. Figure 9(c) shows that the dependence of the resonant wavelength of the transmission dip II, peak I, and dip III on the refractive index n is almost linear. The calculated sensitivities defined byS = Δλ/Δn[38], corresponding to dip II, peak I, and dip III are 1261 nm/RIU, 1309 nm/RIU and 1379 nm/RIU, respectively, which is better than some reported results [1, 6, 21, 26, 39] as shown in Table 1.
(a) (b)
(c)
Figure 9. (a) Transmission spectra when the dielectric medium filled in the two resonators is air (n= 1), water (n= 1.33), ethylene glycol (n≈1.41) and bromoform (n= 1.56). (b) Pseudo-color map of the transmission spectra as a function of the refractive index ranges from 1 to 1.6. (c) Wavelength at dip II, peak I and dip III as a function of the refractive index of the dielectric medium filled in the two resonators.
At last, it is known that the PIT effect is confirmed to support the slowlight effects in the field of nano-integrated optics. Here, the slowlight effects of the proposed waveguide are also studied. The group index is usually used to describe the slow light effect, which is defined as [18, 39]:
ng = c vg
= c
Table 1. Comparison of the sensitivity S with some reported references.
Reported references Sensitivity (nm/RIU)
Ref. [1] 800
Ref. [6] 800, 590
Ref. [21] 1100
Ref. [26] 1200
Ref. [39] 812
This paper 1261, 1309, 1379
where c, vg, and D represent the speed of light in the vacuum, the group velocity, and the effective
length of the waveguide system, respectively. τg is the delay time, which is defined as [18, 39]
τg = dϕ dω =−
λ2
2πc × dϕ
dλ (11)
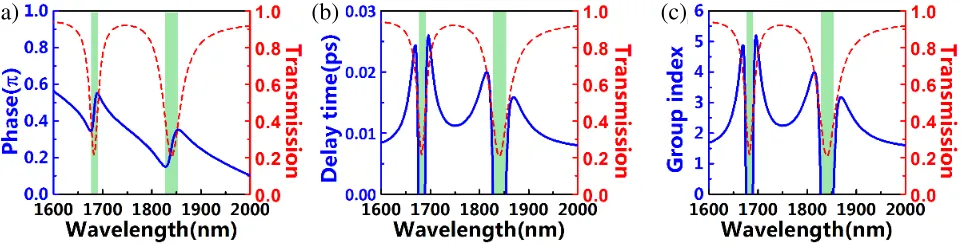
where ϕ(ω) is the transmission phase shift. Here, D = 1500 nm, other parameters are L1 = 220 nm,
L2 = 150 nm, L3 = 160 nm, G = 15 nm, R = 175 nm, G1 = 15 nm, W = 50 nm, which are the same
as Figure 3(b). The calculated results are shown in Figure 10, in which the red dashed line represents the transmission spectrum. Figure 10(a) shows the calculated transmission phase shift, and it can be found that phase mutations occur at around the transmission dips on both sides of the PIT window, indicating stronger abnormal dispersion, for which dϕ/dλ > 0 is satisfied, as shown by the shadow areas. At this time, according to Eq. (10) and Eq. (11), one can find that both τg < 0 and ng < 0
are satisfied, which can be proved through Figures 10(b) and (c). From Figures 10(b) and (c), it is found that the maximum optical delay time is more than 0.025 ps, and the maximum group refractive index is larger than 5. In detail, within the region outside the abnormal dispersion regions withτg>0,
the transmission phase shift is gradually reduced with the increasing wavelength, which means that the SPPs need more time to be transmitted through the waveguide structure than in vacuum, that is to say, slow light effect can be obtained. On the contrary, within the abnormal dispersion regions with
τg <0, the phase increases rapidly with the wavelength, which means the fast light effect. It is noted
that the maximum group index or slowest velocity is not at the PIT peak. This can be interpreted as follows. It is well known that the decrease of group velocity comes from the enhancement of the dispersion, the stronger the dispersion, the smaller the group velocity. Therefore, the place with the strongest dispersion is the place with the slowest group velocity, that is, the place with the largest group refractive index. As shown in Figure 10(a), the bandwidth of the PIT window is wider, and the PIT peak is not very sharp. Consequently, the position with the largest dispersion is not at the position of PIT peak, but at the position where the transmission phase shift changes abruptly, and this wavelength
(a) (b) (c)
position is definitely within the PIT window. This proves once again that the PIT effect is one of the factors leading to the slow light effect. As a result, the proposed waveguide structure also has potential applications in the field of slow light and fast light optical devices, such as optical storage devices and ultrafast all-optical switches.
4. CONCLUSION
In conclusion, the transmission and sensing characteristics of a compact MIM plasmonic waveguide are designed and numerically discussed. The use of AHR and CRR results in a common transmission dip at the short wavelength together with a PIT window at long wavelength. The CMT has been applied to verify the PIT transmission properties. In addition, the potential application as a type of temperature sensor as well as the properties of refractive index sensing is simulated in detail. The calculated maximum temperature sensitivity is −0.55 nm/◦C, and the refractive index sensitivity can be as high as 1379 nm/RIU. Finally, the fast and slow light effects supported by the proposed plasmonic waveguide structure are also studied. As a slow light devices, the maximum optical delay time is more than 0.025 ps, and the maximum group refractive index is larger than 5. Because of its compactness, simplicity, and small size, the structure has broad application prospects in nanoscale devices such as tunable three-band stopband filters, temperature sensors, refractive index sensors, and other highly integrated optical circuits.
ACKNOWLEDGMENT
This work was supported by the Natural Science Foundation of Shanxi Province (Grant No. 201801D121119), by the Opened Fund of the State Key Laboratory of Integrated Optoelectronics under Grant IOSKL2019KF16, and by the National Natural Science Foundation of China (Grants No. 61775126).
REFERENCES
1. Zheng, G. G., L. H. Xu, Y. Z. Liu, and W. Su, “Optical filter and sensor based on plasmonic-gap-waveguide coupled with T-shaped resonators,” Optik, Vol. 126, 4056–4060, 2015.
2. Lu, H., X. M. Liu, L. R. Wang, Y. K. Gong, and D. Mao, “Ultrafast all-optical switching in nanoplasmonic waveguide with Kerr nonlinear resonator,”Opt. Express, Vol. 19, 2910–2915, 2011. 3. Chen, Z., L. Yu, L. L. Wang, G. Y. Duan, Y. F. Zhao, and J. H. Xiao, “A refractive index nanosensor based on Fano resonance in the plasmonic waveguide system,” IEEE Photonics Technol. Lett., Vol. 27, 1695–1698, 2015.
4. Tao, J., Q. J. Wang, and X. G. Huang, “All-optical plasmonic switches based on coupled nano-disk resonator structure containing nonlinear material,” Plasmonics, Vol. 6, 753–759, 2011.
5. Wu, D., C. Liu, Y. M. Liu, L. Yu, Z. Y. Yu, L. Chen, R. Ma, and H. Ye, “Numerical study of an ultra-broadband near-perfect solar absorber in the visible and near-infrared region,”Opt. Lett., Vol. 42, 450–453, 2017.
6. Li, B. X., H. J. Li, L. L. Zeng, S. P. Zhan, Z. H. He, Z. Q. Chen, and H. Xu, “High-sensitivity sensing based on plasmon-induced transparency,” IEEE Photonics J., Vol. 7, 1–7, 2015.
7. Lu, H., X. M. Liu, D. Mao, Y. K. Gong, and G. X. Wang, “Induced transparency in nanoscale plasmonic resonator systems,” Opt. Lett., Vol. 36, 3233–3235, 2011.
8. Nikolajsen, T., K. Leosson, and S. I. Bozhevolnyi, “Surface plasmon polariton based modulators and switches operating at telecom wavelengths,” Appl. Phys. Lett., Vol. 85, 5833–5835, 2004. 9. Wei, Z. C., X. M. Zhang, N. F. Zhong, X. P. Tan, X. P. Li, Y. B. Liu, F. Q. Wang, H. Y. Meng,
10. Li, H. J., X. Zhai, R. Wujiaihemaiti, L. L. Wang, and X. F. Li, “Tunable optical filters and multichannel switches based on MIM plasmonic nanodisk resonators inset a silver bar,” Physica Scripta, Vol. 90, 015604, 2014.
11. Wang, B. and G. P. Wang, “Surface plasmon polariton propagation in nanoscale metal gap waveguides,” Opt. Lett., Vol. 29, 1992–1994, 2004.
12. Yan, X. C., T. Wang, X. Han, S. Y. Xiao, Y. J. Zhu, and Y. B. Wang, “High sensitivity nanoplasmonic sensor based on plasmon-induced transparency in a graphene nanoribbon waveguide coupled with detuned graphene square-nanoring resonators,”Plasmonics, Vol. 12, 1449–1455, 2016. 13. Guo, X. D., H. Hu, X. Zhu, X. X. Yang, and Q. Dai, “Higher order Fano graphene metamaterials
for nanoscale optical sensing,” Nanoscale, Vol. 9, 14998–15004, 2017.
14. Veronis, G. and S. H. Fan, “Bends and splitters in metal-dielectric-metal subwavelength plasmonic waveguides,” Appl. Phys. Lett., Vol. 87, 131102, 2005.
15. Wang, G., W. Zhang, Y. K. Gong, and J. Liang, “Tunable slow light based on plasmon-induced transparency in dual-stub-coupled waveguide,” IEEE Photonics Technol. Lett., Vol. 27, 89–92, 2014.
16. Niu, Y. Y., J. C. Wang, D. D. Liu, Z. D. Hu, T. Sang, and S. M. Gao, “Detuned multiple plasmon-induced transparency with asymmetric gear-shaped ring resonators,” Optik, Vol. 140, 1038–1046, 2017.
17. Chen, H., H. Y. Zhang, M. D. Liu, Y. K. Zhao, S. D. Liu, and Y. P. Zhang, “Tunable multiple plasmon-induced transparency in three-dimensional Dirac semimetal metamaterials,”Opt. Commun., Vol. 423, 57–62, 2018.
18. Huang, Y., C. J. Min, P. Dastmalchi, and G. Veronis, “Slow-light enhanced subwavelength plasmonic waveguide refractive index sensors,”Opt. Express, Vol. 23, 14922–14936, 2015.
19. Cao, G. T., H. J. Li, S. P. Zhan, H. Q. Xu, Z. M. Liu, Z. H. He, and Y. Wang, “Formation and evolution mechanisms of plasmon-induced transparency in MDM waveguide with two stub resonators,”Opt. Express, Vol. 21, 9198–9205, 2013.
20. Liu, X. J., J. Q. Gu, R. Singh, Y. F. Ma, J. Zhu, Z. Tian, M. X. He, J. G. Han, and W. L. Zhang, “Electromagnetically induced transparency in terahertz plasmonic metamaterials via dual excitation pathways of the dark mode,”Appl. Phys. Lett., Vol. 100, 131101, 2012.
21. He, J. L. and S. Yang, “Line shapes in a plasmonic waveguide system based on plasmon-induced transparency and its application in nanosensor,” Opt. Commun., Vol. 381, 163–168, 2016.
22. Noual, A., O. E. Abouti, E. H. El Boudouti, A. Akjouj, Y. Pennec, and B. Djafari-Rouhani, “Plasmonic-induced transparency in a MIM waveguide with two side-coupled cavities,”Appl. Phys. A, Vol. 123, 49, 2017.
23. Wang, J. C., Y. Y. Niu, D. D. Liu, Z. D. Hu, T. Sang, and S. M. Gao, “Tunable plasmon-induced transparency effect in MIM side-coupled isosceles trapezoid cavities system,”Plasmonics, Vol. 13, 609–616, 2018.
24. Liu, L., S. X. Xia, X. Luo, X. Zhai, Y. B. Yu, and L. L. Wang, “Multiple detuned-resonator induced transparencies in MIM plasmonic waveguide,”Opt. Commun., Vol. 418, 27–31, 2018.
25. Ye, J. L., F. Q. Wang, R. S. Liang, Z. C. Wei, H. Y. Meng, J. W. Zhong, and L. H. Jiang, “Plasmon induced transparency in loop-stub resonator-coupled waveguide systems,”Opt. Commun., Vol. 370, 36–42, 2016.
26. Chen, Z., X. K. Song, R. Z. Jiao, G. Y. Duan, L. L. Wang, and L. Yu, “Tunable electromagnetically induced transparency in plasmonic system and its application in nanosensor and spectral splitting,” IEEE Photonics J., Vol. 7, 1–8, 2015.
27. Tang, B. J., J. C. Wang, X. S. Xia, X. Y. Liang, C. Song, and S. N. Qu, “Plasmonic induced transparency and unidirectional control based on the waveguide structure with quadrant ring resonators,”Appl. Phys. Express, Vol. 8, 032202, 2015.
29. Guo, Y. H., L. S. Yan, W. Pan, B. Luo, K. H. Wen, Z. Guo, H. Y. Li, and X. G. Luo, “A plasmonic splitter based on slot resonator,”Opt. Express, Vol. 19, 13831–13838, 2011.
30. Zhang, Q., X. G. Huang, X. S. Lin, J. Tao, and X. P. Jin, “A subwavelength coupler-type MIM optical filter,”Opt. Express, Vol. 17, 7549–7554, 2009.
31. Zhang, Z. D., R. B. Wang, Z. Y. Zhang, J. Tang, W. D. Zhang, C. Y. Xue, and S. B. Yan, “Electromagnetically induced transparency and refractive index sensing for a plasmonic waveguide with a stub coupled ring resonator,” Plasmonics, Vol. 12, 1007–1013, 2017.
32. Li, H. J., L. L. Wang, and X. Zhai, “Plasmonically induced absorption and transparency based on MIM waveguides with concentric nanorings,” IEEE Photonics Technol. Lett., Vol. 28, 1454–1457, 2016.
33. Wen, K. H., Y. H. Hu, L. Chen, J. Y. Zhou, M. He, L. Lei, and Z. M. Meng, “Plasmonic-induced absorption and transparency based on a compact ring-groove joint MIM waveguide structure,” IEEE Photonics J., Vol. 8, 1–8, 2016.
34. Yin, J., J. P. Tian, and R. C. Yang, “Investigation of the transmission properties of a plasmonic MIM waveguide coupled with two ring resonators,” Mater. Res. Express, Vol. 6, 035018, 2019. 35. Xiao, L. P., F. Q. Wang, R. S. Liang, S. W. Zou, and M. Hu, “A high-sensitivity refractive-index
sensor based on plasmonic waveguides asymmetrically coupled with a nanodisk resonator,” Chin. Phys. Lett., Vol. 32, 070701, 2015.
36. Wu, T. S., Y. M. Liu, Z. Y. Yu, H. Ye, Y. W. Peng, C. G. Shu, C. H. Yang, W. Zhang, and H. F. He, “A nanometeric temperature sensor based on plasmonic waveguide with an ethanol-sealed rectangular resonator,”Opt. Commun., Vol. 339, 1–6, 2015.
37. Shen, S. M., Y. L. Liu, W. Q. Liu, Q. L. Tan, J. J. Xiong, and W. D. Zhang, “Tunable electromagnetically induced reflection with a high Q factor in complementary Dirac semimetal metamaterials,” Mater. Res. Express, Vol. 5, 125804, 2018.
38. Lin, Q., Z. Zhai, L. L. Wang, X. Luo, G. D. Liu, J. P. Liu, and S. X. Xia, “A novel design of plasmon-induced absorption sensor,” Appl. Phys. Express, Vol. 9, 062002, 2016.


![Figure 9(c) shows that the dependence of the resonant wavelength of theThe calculated [38], corresponding to dip II, peak I, and dip III are 1261 nm/RIU,](https://thumb-us.123doks.com/thumbv2/123dok_us/1909629.1250280/10.612.120.497.321.590/figure-shows-dependence-resonant-wavelength-thethe-calculated-corresponding.webp)