BIOSAFETY ANALYSIS OF BACILLUS THURINGIENSIS TOXIN USING IMMUNOPATHOLOGICAL APPROACH IN BALB/c MICE
JOSEPHINE A. OPONDO, B. Ed. (Sc.) I56/CE/11159/2007
A THESIS SUBMITTED IN PARTIAL FULFILLMENT OF THE REQUIREMENTS FOR THE AWARD OF THE DEGREE OF MASTER OF
SCIENCE (IMMUNOLOGY) IN THE SCHOOL OF PURE AND APPLIED SCIENCE OF KENYATTA UNIVERSITY
DEDICATION
ACKNOWLEDGEMENTS
Many people and institutions played varying roles in making the preparation of this document a success. I may not be able to mention all of them, but first and foremost, special mention must be made to my supervisors: Prof. Michael Gicheru and Dr. Joshua Muli Mutiso, who kept urging me on and reviewing my work on time and with dedication as was required. My heartfelt gratitude goes to both of them. Secondly I wish to acknowledge Kenyatta University for allowing me to conduct my study in the University.
I am grateful to the Department of Zoological Sciences of Kenyatta University for allowing me to acquire mice from their animal house that enabled me to carry out my research and not to forget to mention the late Professor James O. Ochanda of the Centre for Biotechnology and Bioinformatics, University of Nairobi (CEBIB) for providing me with the Bacillus thuringiensis toxin (KG411) which I used to feed the mice.
TABLE OF CONTENTS
DECLARATION... i
DEDICATION... iii
ACKNOWLEDGEMENTS ... iv
LIST OF TABLES ... viii
LIST OF FIGURES ... ix
LIST OF PLATES ...x
ABBREVIATIONS AND ACRONYMS ... xii
ABSTRACT ...xv
CHAPTER ONE: INTRODUCTION ...1
1.1 Background Information ...1
1.2 Statement of the problem ...3
1.3 Justification for the study ...4
1.4 Research Questions ...5
1.5 Hypotheses ...5
1.6 Objectives ...6
1.6.1 General objective ...6
1.6.2 Specific objectives ..………...………..6
1.7 Significance of the study ...6
CHAPTER TWO: LITERATURE REVIEW ...7
2.1 Genetically modified organisms (GMOs) ...7
2.2 Genetic modification of organisms ...7
2.2.1 Methods of genetic modification of organisms ...8
2.2.1.1 Vector (Viruses) method ...9
2.2.1.2 Plasmid (bacteria) method ...10
2.2.1.3 Genetic modification of organisms using Bacilus thuringiensis (Bt) ...11
2.2.1.4 Growing the GMO...……..…….………...13
2.3 Problems associated with consumption of GMOs ...13
2.5 Future developments ...20
CHAPTER THREE: MATERIALS AND METHODS ...21
3.1 Study area ...21
3.2 Culturing of Bacillus thuringiensis and Production of toxin from Bt toxin ...21
3.3 Bleeding the animals ………...………….…22
3.4 Experimental design ...23
3.5 Preparation of the serum ...24
3.6 Hematology ...24
3.7 Double immunodiffusion for assessment of hypersensitivity ...24
3.8 Protein concentration ...25
3.9 Protein profiles determination in electrophoresis...25
3.10 Preparation and examination of tissues for histopathology ...26
4.0 Data analysis ...26
CHAPTER FOUR: RESULTS ...27
4.1 Body weights of mice fed on Bt toxin ...27
4.2 Weights of the internal organs of mice fed with Bt toxin at different doses ...29
4.3 Differential counts of white blood cells ...30
4.4 Effects of B.t toxin on mice hematology ...32
4.5 Effects of Bt toxin on plasma proteins concentration in mice ...33
4.5.1 Gel electrophoresis of plasma samples from mice fed with BT toxin for 4 weeks ...34
4.6 Histopathologic effects of Bacillus thuringiensis toxin on internal organs in mice ...35
4.6.1 Liver ...36
4.6.2 Spleen ...38
4.6.3 Kidney ...40
4.6.4 Lungs ...42
4.7 Sensitization in mice fed with Bt toxin ...44
4.7.2 Results of Sensitization of mice fed with Bacillus thuringiensis toxin for 60
days ...45
4.7.3 Results of Sensitization of mice fed on Bacillus thuringiensis toxin for 90 days ...46
CHAPTER FIVE ...47
DISCUSSION, CONCLUSIONS AND RECOMMENDATIONS ...47
5.1 Discussion………...………...51
5.1.1 Body weights of mice fed on Bt toxin ...47
5.1.2 Weights of internal organs of mice fed with Bt toxin at different concentrations ...47
5.1.3 Differential counts of white blood cells ...48
5.1.4 Effects of B.t toxin on mice hematology (Complete Blood Count(CBC). ...49
5.1.5 Effects of Bt toxin on plasma proteins in mice ...49
5.1.6 Gel electrophoresis of plasma samples from mice fed with Bt toxin ...50
5.1.7 Histopathological effects of different concentrations of Bt toxin on internal organs of mice ...50
5.1.8 Sensitization in mice fed on Bt toxin ...51
5.2 Conclusions ...51
5.3 Recommendations ...52
LIST OF TABLES
Table 4.1: Means of weights of internal organs of mice fed with Bt toxin at different concentration levels ... 30
LIST OF FIGURES
Figure 4.1: Mean (± SD) weights (g) of mice over four weeks of experimental period. ... 28 Figure 4.2: Variation in body weight of treated animals from the controls ... 29 Figure 4.3: Mean plasma proteins concentrations in mice groups administered with
various doses of Bt toxin. ... 34 Figure 4.4: Gel electrophoresis of plasma proteins from mice administered with Bt
toxin at different doses for 4 weeks. Well 1-molecular marker, 2 and 3-control,4 and 5-10 mg,6 and 7-30mg,8 and 9-50mg. ... 35 Figure 4.5: Double immuno-diffusion slide after 30 days feeding period. ... 44 Figure 4.6: Double immune-diffusion slide after feeding mice with 30mg/kg Bt toxin
for 60 days. ... 45 Figure 4.7: Double immuno-diffusion slide after feeding mice with 30mg/kg Bt
LIST OF PLATES
Plate 4.1: Histological sections of mouse liver. ... 38
Plate 4.2: Histological sections of mice spleen. ... 39
Plate 4.3: Histological section of mice kidney. ... 41
LIST OF APPENDICES
APPENDICES ... 60
APPENDIX 1: Approval of research proposal ... 60
APPENDIX II: Authorization letter... 61
APPENDIX III: Double immuno-diffusion test (description) ... 62
APPENDIX IV: Technique for making a blood smear ... 63
APPENDIX V: White cell count and differential count ... 66
ABBREVIATIONS AND ACRONYMS
Abs Antibodies
Ag Antigen
APS Ammonium Per Sulfate
B.t Bacillus thuringiensis
CBB Coomasie brilliant blue
CBC Complete Blood Count
CRF -1 Commercial Rodent feed-1
DID Double-Immunodiffusion
DNA Deoxyribonucleic Acid
DTH Delayed Type Hypersensitivity EDTA Ethylenediamine tetra acetic acid
EPA Environment Protection Agency
FAO Food and Agriculture Organization
FBC Full Blood Count
FDA Food and Drug Administration
GEFs Genetically Engineered Foods GEF Global Environmental Facility
GIT Gastrointestinal tract
GNA Galanthus Nivalis Agglutinin
GM Genetically modified
GMOs Genetically Modified Organisms
GRA Granulocyte
HB Hemoglobin
HE Hematoxycline and Eosin ICPs Insecticidal Crystal Proteins
IgE Immunoglobulin-E
IPR Institute of Primate Research
KARI Kenya Agricultural Research Institute
KEBS Kenya Bureau of standards
KEPHIS Kenya Plant Health Inspectorate Service
LMOs Living Modified Organisms
LYM Lymphocyte
MCH Mean corpuscular hemoglobin
MCHC Mean corpuscular hemoglobin concentration
MCV Mean Corpuscular Volume
ME Metabolizable Energy
ML Millilitre
MON Monocyte
MPV Mean platelet volume
NB Nitrogen Free Extract
NRC National Research Council
NS Normal saline
OCA Organic Consumer Association
RBC Red blood cells
RDW Red cell distribution width
SDS-PAGE Sodium dodecyl sulfate polyacrylamide gel electrophoresis
SE Standard Error
SEM Standard error of means TEMED Tetramethylethylene diamine
THR Transient hyperemic response
µl Microlitre
ABSTRACT
CHAPTER ONE: INTRODUCTION 1.1 Background Information
Genetic Engineering is an important method of modifying organisms using technologies where the nucleic material of organisms including plants, microorganisms, animals, cellular elements and other biological units are modified to achieve end products that may be difficult to oBtain in a natural process. It can be used to ensure food security because of the pest resistance, high food productivity and resistance to drought traits that it can introduce into the crop (Sears, 2001; Oliveira, 2008; Rickrock, 2010). In the production of genetically modified organisms, genes are inserted into crops such as wheat, rice or corn to increase their food value. Genes can be inserted into animals such as the cattle to increase their milk yield (Oliveira, 2009). Commercial grains are produced in four seed stages: the breeder stage of the seed, the foundation stage, the parent stage of the seed, and finally the commercial stage. Breeders will intensively work with a small number of selected plants, and control carefully, the seeds they produce. Hence, plant breeding companies incur little or no cost at all in producing high quality seeds.
Agricultural production has been boosted by indiscriminate applications of pesticides, mainly from the 1940s to the 1960s (Federici 2005). Unfortunately, this pest control management resulted in harmful outcomes such as the selection of resistant populations of insect pests, compromising the efficiency of control and forcing farmers to use increasingly high doses of pesticides.
programs and integrated production, because they are believed to leave few human side effects and have low impact on natural enemies and the environment (Kleter, Bhula, Bodnaruk, Carazo, Felsot, et al. 2007). In this context, Bacillus thuringiensis(Bt), a gram-positive, rod-shaped, spore-forming bacterium, is the most important biopesticide sold worldwide(OECD), 2007), having been used for over 40 years by organic farmers who spray it as a foliar insecticide.
Bacillus thuringiensis (Bt), is a microbial control agent (MCA) that produces a range of entomopathogenic toxins (Crickmore, 2001). The most prominent feature of Bt is that during sporulation it synthesizes delta –endotoxins or insecticidal crystal proteins (ICPs), which are parasporal crystalline protein inclusions, containing crystal proteins(Cty proteins or Cry toxins ) as their major constituent (Pigott et al., 2008).
amounts can cause digestive issues and long-term health problems. They are difficult to digest and disrupts the bodys routine maintenance of cells.
Genetically Engineered Organisms (GEOs) produced using Bt toxin may be associated with contamination of maternal and fetal blood, DNA transfer from GM crops into humans, and cancer when consumed by humans and other animals. Health problems associated with GM foods engineered with Bt toxins are allergens, or genetic hazards (Bawa and Anilakumar, 2013). Reported adverse effects include Rat tumor, human breast cancer, cells growth via estrogen receptors, glyphosate-linked birth defects, autism, Parkinson’s and Alzheimers, (Seralini and Cellier, 2007),
animals feeds causing severe stomach inflammation and enlarged uteri in pigs, organ damage, gastrointestinal and immune system disorders (Seralini and Mesnage, 2011). Genetically Modified (GM) food regulation is presently based on inadequate and potentially dangerous principles. There is therefore a growing realization, particularly, in medical and nutritional science that the presently available safety testing methods are inadequate and need to be further developed (Domingo, 2011). The objective of the present study was therefore, to determine the safety of Bt toxin using immunopathological approach in mice.
1.2 Statement of the problem
Genetically modified plants were first planted in 1992 in the Peoples Republic of China and in 2010 they were cultivated on 48 million hectares (ha) of land (James, 2010). Bacillus thuringiensis (Bt) modified products may introduce substances including new protein that may trigger adverse reactions including hypersensitivity in people reacting to one or more of the ingredients in these products (Gomez, 2012). It is also likely that the modified organisms using Bacillus thuringiensis (Bt) may interbreed with wild populations of fauna and flora leading to uncontrolled population explosion or creating other animals or plants with undesirable or dangerous traits (Domingo, 2009). Previous research reports have documented that some GMOs can fatally affect the health of rats (Dona, 2013). Furthermore, several studies have shown that Bacillus thuringiensis (Bt) modified soy and corn diet leads to liver and kidney problems in man and other animals (Vendomois, 2009). The safety of genetically modified organisms (GMOs) of Bt origin have been investigated but there have been fewer documented cases involving toxicity or endocrine disruption potential to humans or other animals over the many years of use in Canada and around the world.
1.3 Justification for the study
there are no reports on toxicity or allergenicity (James, 2010), and hence the need to evaluate the safety of Bt. Short gene sequences from Bt have been used to modify plants to express crystal protein normally produced by the Bt. These plants therefore produce a toxin which in turn protects the modified plants from attack by insect pests. Most of these modifdied plants are cultivated as food for animals but sometimes this food will eventually be consumed by humans through the food chain. A recent study (Pusztai, 2012) indicates the feasibility of scientific evaluation of GMO food products for health risks. Available information is scanty on the potential of GM food products causing undesirable effects in humans. These studies have found out that humans are being extensively exposed to Bt during production, application and usage of the treated products, therefore, assessment of the adverse effects of Bt on humans needed to be carried out using experimental murine system. The use of mice for studies of human disease conditions is well established. This study therefore utilized the murine model system to study the effects of Bt.
1.4 Research Questions
i.What is the effect of Bacillus thuringiensis toxin on body Growth rate in mice? ii.What is the pathology of Bacillus thuringiensis toxin on gastrointestinal tract
(GIT), liver, spleen, brain, testis, kidneys, lungs and heart in mice?
iii.What is the effect of Bacillus thuringiensis toxin on mice haemopoetic system?
iv.What is the effect of Bacillus thuringiensis toxin on the murine system?
1.5 Hypotheses
ii.There is no pathology in the liver, spleen, gastrointestinal epithelium, testis, brain, kidney, lungs, and heart in mice fed on Bt toxin.
1.6 Objectives
1.6.1 General objective
To determine the safety of Bacillus thuringiensis toxin using immunopathological approach in BALB/c mice.
1.6.2 Specific objectives
i.To determine the effect of Bacillus thuringiensis toxin on body Growth rate in mice.
ii.To determine the pathology of Bacillus thuringiensis toxin on gastrointestinal tract (GIT), liver, spleen, brain, testis, kidneys, lungs and heart tissues in mice. iii.To determine the effect of Bacillus thuringiensis toxin in mice haemopoetic
system.
iv.To determine the effect of Bacillus thuringiensis toxin on murine system .
1.7 Significance of the study
CHAPTER TWO: LITERATURE REVIEW 2.1 Genetically modified organisms (GMOs)
A genetically modified organism is a process product resulting from extraction of DNA from one species of organisms and artificially inserting the genes into unrelated plant or animal species. The goal of this process is to produce an organism of high quality with quality products. These transgenes may come from plants, animals, humans, viruses, insects or bacteria. This process may be called either Genetic Modification (GM) or Genetic Engineering (GE) (Boyle, 2011).
Scientists have been modifying the genomes of animals and plants using traditional breeding techniques for many years (Anilakumar, 2013). Selection for desired or specific traits has led to production of many different organisms within plant and animal organisms. However, this artificial selection, where organisms exhibiting specific traits are chosen to produce subsequent generations, has only been confined to naturally occurring variations (Philips, 2008). In recent years, however, research in the area of genetic engineering has necessitated precise control over the genetic modifications introduced into an organism’s genome. Currently, it is possible to
transfer DNA from one plant or animal species to unrelated species through genetic technology or engineering and this results in optimizing performance in agriculture or and producing new pharmaceutical products.
2.2 Genetic modification of organisms
plants with the desirable trait (Ledyard, 2013). Another method created by use of advanced technology is where genes expressing the desired trait are mechanically moved or added to a new plant to improve the trait in the plant. Plants created through this technology are called transgenic (Benbrook, 2012). Commonly, this process is used in crops to produce pest resistant plants, which are called Genetically Modified Crops (GM Crops). Due to the natural barrier in living organisms to protect themselves against the new DNA from a different species, genetic technology must be used to force the DNA from one organism into another.
There are four steps followed in biotechnology to create a modified crop variety: (i) DNA extraction which involves extraction of DNA in a laboratory (for example, from Bacillus thuringiensis); (ii) modification of the DNA in the laboratory. In this process the specific DNA sequence which makes up the desired gene is altered so that it will work better once in the target plant (for example, a corn plant); (iii) transferring the new gene into the target plant (for example, a corn plant is transformed with these new modified (for example, Cry1Ab) gene which will enable the modified corn plant to produce insecticidal protection; and (iv) breeding the transgenic plant with a high quality producing plant. The corn modified plant does not contain all of the desired optimal genes hence, this last step in genetic modification occurs in the field where the modified plant (which contains Cry1Ab genes) is crossed with top performing plant lines to create a high-yielding Bt corn variety (Siegel et al., 2008).
2.2.1 Methods of genetic modification of organisms
production and use of genetically modified organisms (GMOs) (Ma et al., 2009). The modification process may use bacteria or virus to transform other organisms. The basic principle in genetic modification is to transfer new DNA with desired quality from one organism to another organism. This may be achieved by packaging the new DNA into a bacteria or virus and inserting these carriers into the organism to be modified.
Although genetic engineering is an important practice in biotechnology, its application in crop production using Bt toxin is very controversial (Ma et al., 2009). Once a desired trait is identified, this is isolated and treated in a laboratory before incorporating it into the target organism before mass breeding of the modified target. Techniques for modification have been improved over time from the transfer of DNA from one organism to another and currently it is now possible to manipulate the nucleic material of the organism to be modified (Boyle, 2011). Genetic engineering is a very important tool in biological research and so far animal models for biomedical research including mice have been produced. Bacteria have also been successfully engineered to produce important products for treating disease conditions such as diabetes and agricultural produce has been increased through this technology (Brookes et al., 2013).
2.2.1.1 Vector (Viruses) method
external DNA penetrates the membrane of a cell for any reason although usually for dominance of other diseases (Gallagher et al., 2012). To modify an organism artificially, the gene may need to be attached to a virus or the DNA may just need to physically be inserted into the nucleus of the target organism with very tiny particles which may be fired using a gene gun. Other ways of modification of organisms may involve natural methods of gene transfer including the ability of Lentiviruses to transfer new genes to animal cells (Beastley et al., 2011).
The most important methods of modification are the vector method. Vectors are usually viruses which are also helpful in genetic engineering. The vector method involves the use of viruses as carriers or vectors which are directly inserted in the host cell. The vector method of Genetic Engineering (GE) is considered superior to the plasmid method because it produces good results in the host (Bartholomaeus et al., 2013). In this method, when the vector is inserted in the host cell, it starts to replicate itself by using the genomic information of the host cell causing an infection. The functions of a virus are blocked when a foreign gene is inserted into them hence the virus can only be able to replicate the gene of interest and then insert it into the host cell. (Brookes et al., 2013).
2.2.1.2 Plasmid (bacteria) method
bacteria take place through this method. The plasmid method is achieved in the following ways: a plasmid, a small piece of the DNA molecule, is used in this method. The plasmid is inserted into a container that is already enriched with the restriction enzymes (Jez et al., 2011).
These enzymes cut the plasmids into small fragments (Mezzomo et al., 2013); using the restriction enzymes, the cut fragments of plasmids are incorporated into the bacteria leading into the production of sticky ends; which allow the complementary segments of the DNA molecules to come together and join with each other making a ring of DNA molecule. In the container, some other enzymes are employed to make those ringed DNA molecules more stable. Following stabilization of the DNA molecules, they are stored in appropriate environment for further processes. Finally, a live culture of bacteria is set and then these well-formed plasmids or DNA molecules are put in these cultures (Hammond et al., 2013). These genes differentiate the plasmid carrying bacteria from non-plasmid bacteria. These plasmid carrying bacteria are utilized in for various purposes such as in drug delivery or other purposes. Through application of this method, oil spills can be cleaned by using such bacteria (Beastley et al., 2011).
2.2.1.3 Genetic modification of organisms using Bacilus thuringiensis (Bt)
(Bravo et al., 2010). Bacillus thuringiensis modified crops are protected particularly against tobacco budworm, European corn borer, Southwestern corn borer, cotton bollworm, the Colorado potato beetle and the pink bollworm (Koch et at., 2012). Other benefits of using Bt include: increased beneficial insects populations; reduction from environmental impacts from pesticides; and low pesticide use in farms leading to reduced exposure of chemicals to farm workers and other non-target organisms. The soil bacterium, Bacillus thuringiensis (Bt), produces an insecticidal protein. This protein is coded for by a certain gene, Cry1Ab (Jez et al., 2011).
which do not share sequence homology with Cry proteins, and also do not compete for similar receptors and some of them kill different target insects than do the Cry proteins (Palma et al., 2012).
2.2.1.4 Growing the GMO
After a genetic trait has been successfully inserted into an organism’s genome, the
genetically changed organism must then be able to grow freely and replicate with its newly engineered genome. It would be important that the genotype of the changed organism is closely monitored to ensure that only genetically modified organisms are propagated. Biotechnology organizations involved in production of engineered organisms invest huge amounts of money to ensure success in the sustained production of the genetically modified organisms. This huge cost may be incurred due to investment in controlled climatic conditions important for sustainability of growth of these modified crops.
2.3 Problems associated with consumption of GMOs
problems, a number of countries, over the past few years have completely banned GMOs and the pesticides that go along with them (Domingo, 2011).
Research from Canada has successfully identified the presence of pesticides associated with GMOs in maternal, fetal and non-pregnant women’s blood. A recent study by the Institute for Responsible Technology has linked GMOs to Gluten disorders that affect millions of Americans. This is a digestive and autoimmune disorder that results in damage to the lining of the small intestine when foods with gluten are eaten. Gluten is a form of protein found in some grains. The authors have related GM foods to five conditions that may either trigger or exacerbate gluten-related disorders such as: intestinal permeability, imbalanced gut bacteria, immune activation and allergic response, impaired digestion and damage to the intestinal wall.
In spite of the fact the genes being introduced into other organisms occur naturally, there are possibilities of unknown consequences because of the altered natural state of an organism through expression of foreign genes. Furthermore, such modifications can alter the organisms’ metabolism, rate of growth and/ or response to external
environmental stimuli. These consequences may influence not only the modified organism itself, but also the environment in which the modified organism is allowed to proliferate. Potential risks to the health of humans include the possibility of hypersensitivity to genetically modified food and transfer of genes resistant to antibiotics, to gut flora (Schroder, 2013).
rapid spread of diseases among both plants and animals (Hammond et al., 2012). However, the possibility of gene transfer horizontally between GMOs and other organisms is considered too low and hence the health risk is quite low. Horizontal transfer of genes occur naturally but at a very low rate and generally cannot be replicated in an optimized laboratory setting without active modification of the target nucleic material to increase susceptibility (Ma et al., 2009). A recent research carried out at the University of Canterbury in new Zealand established that, the double stranded RNA (dsRNA) present in GM wheat was capable of withstanding digestion (even after cooking) and could circulate in the body, where it is diversified into different dsRNAs and “alters expression of genes in the animal” (Shimada and Kim, 2008). The authors reported that the compounds created in this wheat variety, intended to silence genes in the wheat, can match human genes, and upon ingestion, these compounds can enter human beings and potentially silence the genes in the human body.
consumed GM foods, including cell proliferative growth and intestinal immune system disruption. A report of a comprehensive two year research on feeding of Monsanto’s Roundup ready corn, and acceptable normal levels of Roundup in
drinking water to laboratory rats indicated this corn to be highly toxic to health (Hellmich, 2012). Rats fed on this corn died 2-3 times more than those fed on Roundup (control group). The female rats in the corn group developed large mammary tumors and more often than and the control rats. The pituitary gland in these females was the second most disabled organ, and the female sex hormonal balance was modified. The male rats presented with liver congestions, with liver necrosis occurring 2.5-5.5 times more frequently as compared to control rats. These male rats presented four times more large palpable tumors than the control rats, and these tumors occurred as early as up to 60 days earlier.
A study by Mendelsohn (2013) reported that the biopesticides engineered into GM crops (known as Bacillus thuringiensis/Bt or Cry-toxins), can also contribute to haematological abnormalities including anaemia and blood malignancies (blood cancers) such as leukemia. A different study by Carman et al. (2013) investigating the effects of long-term toxicology on pigs administered with GMO Soy and corn, reported a significantly higher stomach inflammation in GM-fed pigs compared to non-GM fed pigs.
Scientists have been concerned about Bt genetic modifications of plants by introducing the Bt Cry proteins in crops. They argue that the modified Cry proteins are not “natural” and that their safety is unknown and hence the need to subject these
Previous studies had reported that the beneficial insects that are involved in preying on crop pests were now exposed to fatal amounts of Bt indicating also that the negative effects may go along the food web affecting more crops and animals that are consumed by humans. The potential harmful effects that may arise in humans following consumption of Bt modified foods therefore need to be evaluated.
2.4 Adverse effects in animals following consumption of GMO Products
Risk assessment defines the likelihood that an adverse effect will be associated with exposure to a substance (Trimbell, 2008). Traditionally risk assessment is carried out to identify a harmful substance; demonstrate dose response relationships, assess the chances of exposure of the harmful substance to humans, and estimate the occurrence of adverse effects under defined situations of human exposure. For risks from food additives, assessment commonly involves the measurement of an acceptable normal daily intake or Reference dose.
While evaluation of genetically engineered food products incorporate some elements of traditional risk assessment, the food products are intended for long term human exposure hence no detectable level of risk is acceptable. Genetically engineered food producers therefore, mainly consider assessment of safety or the certainty that there will be no negative effects expected to occur when the food product is used as intended (Cock burn, 2008; Trimbell, 2010).
standardized method for assessment of safety of GM foods. Regulations by governments in Japan, USA, Canada and most others are guided by the concept of substantial equivalence (Cockburn, 2008). Equivalence is subdivided into four categories (Cockburn, 2010): Phenotypic and agronomic equivalence deals with the morphology and agronomic qualities of the GM food product as compared to the non-GM counterpart; compositional equivalence looks at whether the non-GM product has the same composition of nutrients including macro and micronutrients as compared to the non-GM counterpart; safety equivalence is concerned with the hazard assessment of the inserted DNA and the proteins it expresses while nutritional and feed performance equivalence is about whether the GM product produces equivalent feed efficiency in animals as compared to its non-GM component.
toxicity studies are repeated. The type of specific test used depends on the type of protein being considered (Cockburn 2009).
In addition to direct toxicity evaluation, the potential allergic reaction of the gene product has to be assessed. However, this can be difficult as there are no reliable animal models to predict human food hypersensitivity unless the gene product originates from an established allergenic source. If this is the case, the protein can be assessed in vitro by use of serum samples from individuals who are known to be allergic to the gene donor. This procedure was applied successfully in establishing that a variety of soybean that contained DNA from Brazil nuts caused hypersensitivity reactions in people (Cock burn, 2008). Usually, the product of the gene comes from a source whose allergenic status is unknown and in this particular case, an indirect approach is employed to assess the protein’s potential hypersensitivity reactions using
2.5 Future developments
CHAPTER THREE: MATERIALS AND METHODS 3.1 Study area
The study was partly undertaken at the University of Nairobi’s Chiromo Campus
Laboratories and part of the work was undertaken at the Department of Zoological Sciences of Kenyatta University. Protein concentration and analysis using Nanodrop 2000C/SDS-PAGE and histology tests were carried out at the Institute of Primate Research (IPR), Karen, Kenya. The three laboratories used in the present study are well equipped with facilities and equipment necessary for carrying out biomedical research activities.
3.2 Culturing of Bacillus thuringiensis and Production of Bt toxin
Nutrient broth (NB) was prepared by adding 13 g of nutrient broth powder to one litre of distilled water in a conical flask. The media was mixed thoroughly and distributed into 250 ml conical flasks covered with cotton wool and aluminum foil and autoclaved at 1210C for 15 minutes. It was then allowed to cool in order to be used for culturing and preservation of the oBtained Bt toxins. A loop-full of the pure isolate
Bacillus thuringiensis culture was transferred into the 250 ml flasks containing the
3.3 Bleeding the animals
Blood samples were collected from all mice in the four groups by cardiac puncture as described by Justine and Natalie in their book: methods in immunology, third edition, 1977, pages 20-27. The blood collected from each animal in each group was kept in separate vacutainers and prevented from clotting by use of ethylenediamine-tetraacetic acid (EDTA) and clearly labeled.
All mice were euthenized by making them inhale EDTA briefly and then whole blood samples taken via cardiac puncture. The blood samples for all the 40 animals were used in hematology – carrying out complete blood count (CBC), also known as full blood count (FBC), to determine circulating blood cell levels of the different blood cell types. This was done in an automated blood analyzer/ counter. After this, the samples were later used in white blood cell differential count (blood smear) on slides to be able to determine the absolute values. The samples were finally spinned in a centrifuge to be able to oBtain blood plasma. The separated plasma samples from every mice in every group was stored at -200 C and was later analyzed electrophoretically using slab gels for total protein concentration. The results of the gel electrophoresis were compared to a molecular marker which was run alongside the samples.
conducted as described (Jocelyn et al; 1974, Brown, 1978; Puchtler et al; 1986 and Meloan et al; 1987). The samples were analyzed within two hours of acquisition. Shortly after the blood samples were taken, internal organs from each animal were removed, weighed and preserved in formalin till use in the pathology work as above.
The order of tests was: An automated CBC was performed followed by peripheral blood smear. Tubes were centrifuged at 10000rpm for 5 minutes in a bench top centrifuge after which plasma was withdrawn from the tube and analyzed for clinical chemistry profile. The remaining plasma was assayed for protein analysis. Internal organs were histopathologically analyzed and lastly serum was used to perform double Immunodifussion in agarose gel.
3.4 Experimental design
Ninety days post treatment, all animals were weighed and their weights recorded. Blood samples for hematology and serum preparation were taken through cardiac puncture from each mouse after which all mice were sacrificed for multi-organ evaluation and tissue histopathology analysis. The data oBtained was compared with the controls.
3.5 Preparation of the serum
The freshly drawn blood from the BALB/c mice above was allowed to stand for 3 hours at room temperature for clot formation. The clot was then carefully separated from the wall of the tube with a metal spatula, and the tubes with contents kept in a refrigerator for twenty four hours to permit clot contraction. The serum was then transferred into sterile tubes and centrifuged carefully, removed the serum with a pipette into other clean tubes, the centrifugation of the serum was repeated to rid the serum completely of erythrocytes or Red blood cells. This clear serum was refrigerated at -20ºC till use in double-immunodiffusion (DID).
3.6 Hematology
A complete blood count (CBC) was performed to determine the picture of differential and absolute abundance of all cell types present in the peripheral blood. As a complement to the CBC, peripheral blood smear was performed in parallel. After this, blood samples were used to prepare plasma which was used in the protein analysis in SDS-PAGE.
3.7 Double immunodiffusion for assessment of hypersensitivity
the mice were sacrificed, blood removed by cardiac puncture and serum prepared for sensitivity test by double- immunodiffusion method (DID).
3.8 Protein concentration
Microassay method of protein concentration using Bio-Rad Protein Assay Kit (Bio-Rad Laboratories, Richmond CA) was used to determine protein concentration of the samples. Briefly, BSA standard and the dye reagent were removed from 4OC and allowed to warm to ambient temperature. Twenty microlitres of Phosphate buffer saline (PBS) was added up to the sixth lane in duplicate lanes on a microplate for both the standard and the unknown sample. Serial dilutions of the standard was done by adding 20μl of BSA from the stock standard in lane two and using a multichannel
serial dilutions of 1:2, 1:4:, 1:8, 1:16 and 1:32 prepared. Lane one contained duplicate of undiluted sample. Samples were treated the same way. Twenty microlitres of PBS was put in another duplicate lane and served as blank. Two fifty microlitres of reagent dye diluted 1:5 was added to all the lanes followed by 5 minute incubation at room temperature. An Optical density (OD) was read at 595nm using a microplate reader (Dynex microplate reader, Sussex, US) versus concentration curve was constructed and the concentration of the unknown extrapolated.
3.9 Protein profiles determination in electrophoresis
The proteins were electrophoretically separated by SDS-PAGE on 12.5% gel and the proteins migrated based on their size against a known molecular weight marker as described. The proteins were mixed with the sample buffer at the ratio of 2:1 (20μl sample and 10μl sample buffer) boiled for 5 min and after cooling at room
applied for one hour through Bio-Rad mini protein II (Bio Rad, Hercules, CA). This formed a characteristic pattern of bands of different widths and intensities on the gel.
3.10 Preparation and examination of tissues for histopathology
Complete necropsy was performed and liver, kidney, lungs, heart, testis, spleen and brain were removed and weighed before fixation for histopathology. The specimens were oBtained from each of the organs and fixed in 10% formaldehyde for 24 hours and processed according to the method described by Cunha et al (2017). Briefly the samples were dehydrated in ethanol at increasing concentrations before immersion in xylol and embedding in paraffin wax. Sections were cut using microtome at 4 – 6 µm thick, mounted on microscopic slides and stained with hematoxylin-eosin (H/E) stain. Samples were air dried and examined under a light microscope (Leitz, Germany). Micrographs results of the slides were taken.
4.0 Data analysis
CHAPTER FOUR: RESULTS 4.1 Body weights of mice fed on BT toxin
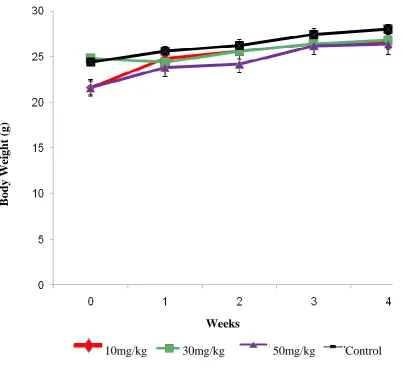
Following toxin administration to mice over a period of four weeks, results indicated that the mice group which was fed on 10mg/kg of Bt toxin had the highest weight gain of 5.0g at the end of the experimental period. Weight gain in the mice group fed on Bt at 30mg/kg gained 2.0g while in the mice group given 50mg/kg the weight gain was 4.8g as measured at the end of the experimental period. Mice in the control group had increased weight gain from a mean of 24.4 ± 0.40g to 28.0 ± 0.55g translating to an increase of 3.6g. Analysis of these weight changes using one way ANOVA did not suggest significant difference across all the groups (P > 0.05; Figure 4.1).
Figure 4.1: Mean (± SD) weights (g) of mice over four weeks of experimental period. 10mg/kg 30mg/kg 50mg/kg Control
Weeks
Body Wei
ght (
0 5 10 15 20 25 30
24.4 25.6 26.2 27.4 28
Wts of control group
W ei gh ts ( g) . Treat A Treat B Treat C
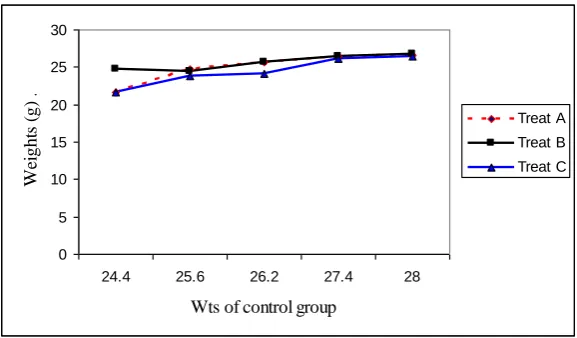
Figure 4.2 Variation in body weight of treated animals from the controls
H1: B.t toxin has no significant effect on body weight of mice. Using ANOVA, the result oBtained from this study showed there was a significant effect on mice body weight (F = 3.81, P = 0.012). The researcher therefore fails to accept the hypothesis.
of 10mg/kg and in the control groups were comparable (P > 0.05) while the weight in the latter group was significantly higher compared to either the spleen weight in the 30mg/kg or 50mg/kg mice group (P < 0.05; Table 4.1).
Table 4.1: Means of weights of internal organs of mice fed with Bt toxin at different concentration levels
Organ
Mice group
A B C Control
Brain 0.44± 0.02a 0.42 ±0.03a 0.41± 0.01a 0.44 ± 0.02a
Testis 0.25± 0.01a 0.23 ±0.02a 0.23 ±0.02a 0.26 ±0.01a
Liver 1.67 ±0.10a 1.70 ± 0.08a 1.67 ±0,14a 1.78 ± 0.08a
Kidney 0.46± 0.01a 0.45± 0.01a 0.48 ±0.02a 0.50 ± 0.06a
Spleen 0.27± 0.02b 0.19± 0.02 a 0.19 ±0.01a 0.28± 0.04a
Lungs 0.28 ±0.03a 0.25± 0.02a 0.25± 0.02a 0.32± 0.03a
Heart 0.14± 0.02a 0.14 ±0.01a 0.14± 0.02a 0.19± 0.03a
Group A: Mice fed with 10mg/kg Bt for a period of 4 weeks; Group B: Mice fed with 30mg/kg Bt for a period of 4 weeks; Group C: Mice fed with 50mg/kg Bt for a period of 4 weeks; Control group: not fed with Bt
4.3 Differential counts of white blood cells
significantly different (P< 0.05), with 30mg/kg, 50mg/kg or the control mice group having significantly higher monocyte percentage as compared to the mice group administered with Bt toxin at a dose of 10mg/kg (P < 0.05). The three mice groups showed comparable levels of monocytes (P > 0.05). The neutrophil proportions were 59.8%, 59.2%, 61% and 58% for 10mg/kg, 30mg/kg, 50mg/kg and the control group respectively. Neutrophil levels difference was only reported between mice groups treated with Bt toxin at doses of 30mg/kg and 50mg/kg with the former having significantly higher neutrophil proportion as compared to the latter (P < 0.05). Comparisons between any other two pairs of the mice groups indicated equal neutrophil proportions (P > 0.05). Other white blood cells including eosinophils (range 6% – 6.6%), basophils (range 0% – 0.6%) or lymphocytes (range 27.6% - 30%) were comparable across the groups in each cell category (Table 4.2).
Table 4.2: Differential counts (%) of white blood cells in mice administered with different doses of Bt toxin
Cell type
Mice group
A B C Control H-Value
P-Value
Neutrophils 59.8±0.58ab 59.2±0.37ab 61.0±0.45b 58.0±0.71a 9.32, P=0.025
Lymphocytes 28.8±0.58a 27.6±0.51a 28.2±0.74a 30.0±0.71a 5.70, P=0.127
Eosinophils 6.6±0.40a 6.0±0.32a 6.8±0.37a 6.2±0.37a 2.61, P=0.455
Monocytes 3.0±0.32b 4.6±0.25a 4.6±0.40a 5.2±0.37a 10.93, P=0.012
Group A: Mice fed with 10mg/kg Bt for a period of 4 weeks; Group B: Mice fed with 30mg/kg Bt for a period of 4 weeks; Group C: Mice fed with 50mg/kg Bt for a period of 4 weeks; Control group: not fed with Bt.
4.4 Effects of B.t toxin on mice hematology
The results of the Complete Blood Count (CBC) showed that there were no significant differences observed in nine out of the twelve parameters examined or analyzed at p ≤ 0.05. statistically significant differences was however observed in complete blood count of white blood cells (wbcs), monocytes and lymphocytes at p ≤
0.05 using Kruskal Wall is test (Table 4.3).
The peripheral blood smear in this test was used to determine RBC and WBC morphology, estimate platelet numbers and distribution and confirm automated leukocyte counts.
Table 4.3 Complete blood counts
A B C Control P-Value
Group A: Mice fed with 10mg/kg Bt for a period of 90 days; Group B: Mice fed with 30mg/kg Bt for a period of 90 days; Group C: Mice fed with 50mg/kg Bt for a period of 90 days; Control group: not fed with Bt.
4.5 Effects of Bt toxin on plasma proteins concentration in mice
Following administration of Bt toxin in groups of mice for 90 days, the mice group administered with the toxin at a dose of 10mg/kg recorded a plasma proteins concentration of 28.03 ± 3.02 mg/ml. Mice groups administered with the Bt toxin in doses of 30mg/kg and 50mg/kg had plasma proteins concentrations of 21 ± 4.67 mg/ml and 15.69 ± 2.26 mg/ml respectively. The control group had a concentration of plasma proteins of 17.96 ± 3.44 mg/ml. Statistical analysis of these protein concentrations using ANOVA indicated that there were significant differences across the different mice groups (P < 0.05).
Figure 4.3: Mean plasma proteins concentrations in mice groups administered with various doses of Bt toxin.
4.5.1 Gel electrophoresis of plasma samples from mice fed with BT toxin for 90 days
The mice in groups fed with Bt at 10mg/kg, 30mg/kg and 50mg/kg showed a
comparable protein profile separation to that of known molecular weight (control; Figure 4.3).
Pl
asm
a protei
ns
co
nce
ntration (mg/ml
)
Figure 4.4: Gel electrophoresis of plasma proteins from mice administered with BT toxin at different doses for 90 days. Lane 1-molecular marker, 2 and 3-control, 4 and 5-10 mg,6 and 7-30mg,8 and 9-50mg.
4.6 Histopathologic effects of Bacillus thuringiensis toxin on internal organs in mice
Microscopic observation of histological sections of the brain, testis, liver, kidney, spleen, lungs, heart and gut from study mice showed that there was no pathological changes on the brain, testis, gut and heart in all the experimental groups when
Molecular We
ight
of P
ro
tein
s
(K
Da
compared with the control. Some pathology was however observed in the liver, spleen, kidney and lungs.
4.6.1 Liver
The liver tissue of mice in the group fed on 10mg/kg and 50mg/kg of Bt toxin showed no liver pathology (Plate 4.1A and 4.1C) and compared well with the control liver tissue (Plate 4.1D). The liver tissue from the mouse in mice group fed on 30mg/kg of Bt toxin showed moderate congestion and widening of sinusoids. It also showed Kupffer cells which are normal liver cells and they proliferate/increase in number during inflammation. These are representatives of macrophages in liver. There were also some dark sports “specked” like a grated nutmeg kernel (the asterisk). The dark
4.6.2 Spleen
4.6.3 Kidney
Plate 4.3: Histological section of mice kidney.A-Kidney tissue section from a mouse fed with 10mg/kg of Bacillus thuringiensis toxin showing mild congestive glomerilitis and increased number of blood vessels and C-Kidney tissue sections from mice fed with 30mg/kg and 50mg/kgofBt toxin respectively showig normal kidney structure,and D-Kidney tissue section from a mouse in control group fed with noBt toxin. Tissue sections stained with hematoxylin and Eosin (H & E) and viewed on compound microscope under x 100 magnification.
C D B
4..4 Lungs
4.7 Sensitization in mice fed with Bt toxin
The results from mice that were fed 30mg/kg of Bt toxin for a period of 30 days, 60 days and 90 days all showed that there was sensitization of the immune system (Figures 4.4-4.6).
4.7.1 Results of sensitization of mice fed with Bacillus thuringiensis toxin for 30 days
Serum from male mouse number 1(M1) and female mouse number 2 (F2) fed on Bt toxin for 30 days were negative on agarose gel and showed no reaction against the Bt toxin indicating that there was no immune sensitization when compared with the control (Figure 4.5).
Figure 4.5: Double immuno-diffusion slide after 30 days feeding period. Anti-sheep: Rabbit anti-sheep reacted with sheep serum acted as positive control, control sample serum was from the mice that were not fed Bacillus thuringiensis toxin, M1 was serum from male mouse 1, F2 serum from female mouse number 2, which were fed 30mg/kg of the toxin, NS is normal saline as a negative control and BT- the wells contained the dilution of the stock Bacillus thuringiensis toxin that the animals were fed on.
B.t B.t B.t
Anti-Sheep Control
sample serum M1
F2 NS
4.7.2 Results of Sensitization of mice fed with Bacillus thuringiensis toxin for 60 days
The results showed two precipitin lines for male mouse number 3 (M3) and two for the female mouse number 4 (F4). These reactions were similar to those formed between the wells which had the positive control samples (Rabbit anti-sheep/Sheep serum). Serum from female mouse number 5(F5) showed no reaction against the Bt toxin. No precipitin lines were formed between the wells that had serum from mice that were not fed Bt toxin (Figure 4.6).
B
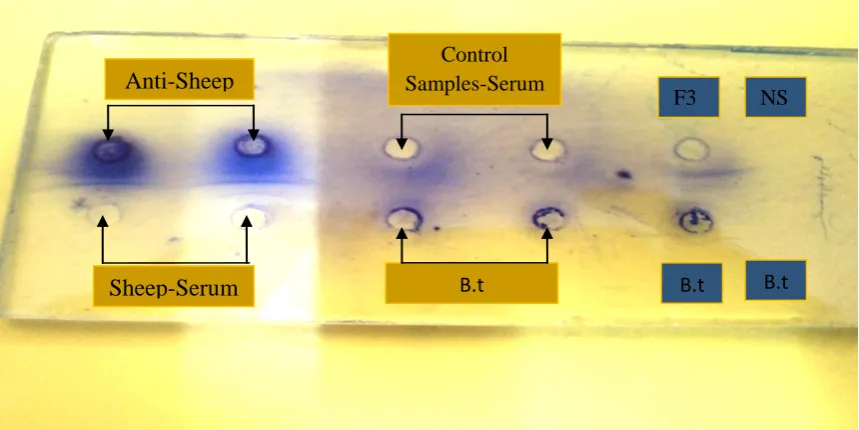
Figure 4.6: Double immune-diffusion slide after feeding mice with 30mg/kg BT toxin for 60 days. Anti-sheep-wells contained rabbit anti-sheep antibodies reacted against sheep serum as positive control, on control sample-serum-wells contained serum from mice that were not fed Bacillus thuringiensis toxin, M3, F4, F5 wells contained serum from male animal 3, female animal 4 and female animal 5 respectively, which were fed 30mg/kg of Bacillus-thuringiensis toxin, NS – well contained normal saline as negative control and BT-wells contained dilutions of the stock Bacillus thuringiensis toxin that the animals were fed on.
Anti-Sheep
Sheep-Serum
Control Samples-Serum
M3 F4 F5 NS
4.7.3 Results of Sensitization of mice fed on Bacillus thuringiensis toxin for 90 days
The results showed the formation of precipitin lines for the well which had serum from the female mouse (F3) which was fed with Bt toxin for 90 days. This was the same as those formed between the wells which had rabbit anti-sheep against sheep serum. No precipitin lines were, however, formed when serum from animals not fed with Bt toxin was reacted with the toxin itself. The same was for the well with normal saline (NS) (Figure 4.7).
Figure 4.7: Double immuno-diffusion slide after feeding mice with 30mg/kg BT toxin for 90 days. Anti-sheep-wells contained rabbit anti-sheep antibodies reacted against sheep serum (opposite wells) as positive controls, control sample serum-wells contained serum from mice that were not fed on Bacillus thuringiensis toxin, F3 - well contained serum from a female mouse number 3 which was fed on 30mg/kg of Bacillus thuringiensi toxin, NS - well contained normal saline as a negative control and -wells contained dilutions of the stock Bacillus thuringiensis toxin which the animals were fed on.
Control Samples-Serum
Anti-Sheep
F3 NS
CHAPTER FIVE
DISCUSSION, CONCLUSIONS AND RECOMMENDATIONS 5.1 Discussion
5.1.1 Body weights of mice fed on Bt toxin
The higher weight gains in the mice and the differences in weight gain were not significant as were observed in all groups including the controls indicating the Bt toxin had no effect on growth and therefore harmless to the animals. These results contradicts those reported by Mohamed et al. (2009) who investigated nutritional impact of GM potato spunta G2 and G3 on rats and established that treated rats became fatter than the control group rats.
5.1.2 Weights of internal organs of mice fed with Bt toxin at different concentrations
engineer crops like Monsanto 810 (MON810) was examined for mammalian toxicity. Mice were observed up to 90 days after dosing; and no treatment –related effects on body weights of organs were observed.
5.1.3 Differential counts of white blood cells
5.1.4 Effects of B.t toxin on mice hematology (Complete Blood Count(CBC). Low count of monocytes in the lowest Bt dose (10mg/1kg) indicate that the toxin may have negative effects on the bone marrow. This low number in monocytes in the blood usually indicates an increased risk for infections. The high court of neutrophils in the highest Bt dose (50mg/kg) also known as neutrophilia, indicates that the toxin may cause inflammation of the organs. Neutrophils play important roles in innate immune system. On sensing signals that an infections present or damage of the tissue has occurred, they are the first cells to migrate to the site and start killing the invading microbes (Mohamed et al, 2009). Monocytes are the type of white blood cells that fight certain infections and help other white blood cells remove dead or damaged tissues, destroy cancer cells and regulate immunity against foreign substances (Mohamed et al, 2009).
5.1.5 Effects of Bt toxin on plasma proteins in mice
5.1.6 Gel electrophoresis of plasma samples from mice fed with Bt toxin
The lack of difference in the way the proteins separated among the three groups indicates that the Bt toxin was first cleared from the animals’ body, hence the same protein band profile compared to the controls. This supports our findings that plasma protein concentration were the same across the groups. These results are in agreement with those recorded by Mohamed et at. (2009) who studied effects of GM potato Spunta on selected serum constituents and found out that there was no significant differences and those recorded by Hashimoto et al. (2011), who studied the safety assessment of transgenic potatoes with soy bean glycin by feeding studies in rats, a study which also revealed no significant differences in the protein bands.
5.1.7 Histopathological effects of different concentrations of Bt toxin on internal organs of mice
bronchiolitis, all suggestive that Bt toxin may cause bronchopneumonia in mammalian consumers. This is supported by observed neutrophilia suggestive of inflammation.
5.1.8 Sensitization in mice fed on Bt toxin
One of the major concerns with GM foods of Bt origin is its potential to increase allergies in the human population. The precipitin lines that formed were an indication that there was antigen-antibody reaction. This confirms that the toxin may sensitize the immune system if consumed by mammals probably producing IgE antibodies. The present results are similar in a number of ways to a surveillance program in which it was shown that exposure of farm workers to Bt pesticide sprays caused them to develop skin sensitization and IgE antibodies to the Bt spore extract, (Pusztai, 2010). However our study did not demonstrate IgE specific response but there was indication of development of antibodies.
5.2 Conclusions
i.The result on body weight gain showed that the animals gained weight normally in all the three treatments and compared well with the control group.
iii.The accumulated toxin effect in the bone marrow is reflected in changes in blood cell parameters in the various study groups. Differential count of white blood cells (neutrophils, eosinophils, basophils, lymphocytes and monocytes) were found to vary slightly. Differential counts of neutrophils in treatment in group C (50mgkg) were significantly higher than the control group. Monocytes counts were significantly lower in treatment A (10mg/kg) than in the control. The study suggests that Bt toxin may affect bone marrow cells.
iv.Protein profile and concentration were similar across the groups, an indication that Bt protein are well degraded in murine system.
v.The study determined anti-Bt antibodies response in mice fed with toxin. This suggests that toxin may induce sensitization of the immune system in mammals with potential development of allergic reactions.
5.3 Recommendations
These preliminary results suggest some form of toxicity in mice induced by Bt toxins. Consequently, the study results suggest the following:
ii)A further study need to be conducted to confirm the observed histopathology changes induced by Bt on multiple organs and to shed more light on the effect on bone marrow;
iii)To ascertain or disapprove what is generally accepted about increased exposure to a protein that it increases the possibility of the protein becoming an allergen, the study suggest further studies to establish if increased Bt toxin exposure induce IgE responses.
REFERENCES
Bartholomaeus A., Steenson L. R. and Sebastian, S.A. (2013). Methods and mechanisms for Genetic manipulation of plants, Animals, and micro-organisms (3rd Ed.) Published online. PP 1-24.
Bawa A. S. and Anilakumar, K. R. (2013). Genetically Modified Foods: Safety, Risks and Public Concerns. Food Science Technology50:1035-1046.
Beastley A., Aubin K., Babbage A.K., Bagguley C.L., Bailey J. and Bethel, G. (2011) vectors, environment and society research 49: 412-415.
Benbrook C. (2012). Impacts of Genetically Engineered crops on Pesticide use in the United States: The first thirteen years. Environmental Science Europe. 24 :1-10
Boyle J. R. (2011). “How to genetically modify a seed, step by step. Popular Science, St. Louis. Pp 1-7.
Bravo A., Gill S.S. and Soberon M (2010) mode of action of Bacillus thuringiensis Cry and Cyt toxins and their potential for insect control. Toxicon 49: 423-435. Bravo A., Gill, S.S. and Soberon, M. (2007). Mode of action of Bacillus thuringiensis Cry and Cyt toxins and their potential for insect control. Toxicon. 49: 423-435. Broderick N.A. Raff K.F. and Handelsman J. (2006). Midgut bacteria required for Bacillus thuringiensis insecticidal activity. National Institute of Science. Proc Nati Acad Sci U.S.A. 10: 103-151.
Brookes G. and Barfoot P. (2013). GM crops: global socio-economic and environmental impacts 1996-2014. Dorohester, UK. Pp 10-31
Carman N. J. (2013). Gene-altered B.t crops threaten public health: Immune responses and skin sensitization to rest in farm workers and presence of B.t in many genetically engineered foods. http://www.organicconsumers.org/ articles/article 23.c7m.
Cookburn A.A., link, G., Barlow S., Flanchowsky G. and Knudsen I. (2008). The food and environmental safety of Bt Crops. 4th edition; 20-25.
Crickmore N. (2008). How Bacillus thuringiensis has evolved specific toxins to colonize the insect world. Trends Genetics 17: 193-199.
de Vendomois J. S., Roullier F., Ceillier D. and Seralini G. E. (2009). A comparison of the effects of Three GM corn varieties on mammalian health.
Dean D. H., You T.H., Rajamohan M. K., Lee J. L., Jenkins M., Audtho, S.J-WU, and Liu X. (1984). Rational design of Cry toxins, P. 112-117. In R. J. Akhurst, C.E. Beard, and P. Hughes (ed.), Biotechnology of Bacillus thuringiensis and its environmental impact. Proceedings of the 4th Pacific Rim Conference. Scribbly Gum publication, Canberra, Australia.
Domingo J. L. and Bordonaba J. G. (2011). A literature review on the safety assessment of genetically modified plants. Environ Inta 37: 734-742.
Domingo J. L. (2009). Toxicity studies of genetically modified plants: a review of the published literature. Critical Reviews in Food Science and Nutrition. 47 (8): 721-733.
Dona A. and Arvanitoyannis I.S. (2013). Health Risks of genetically modified foods. Critical Reviews in Food Science and Nutrition. 49: 164-175.
Earmakova I., Young A.E. and Eenennaam A.L.V. (2008). Prevalence and Impacts of genetically engineered feedstuffs on livestock populations.
Federici B.A. (2005). Insecticidal bacteria: an overwhelming success for invertebrate pathology. Journal of Invertebrate Pathology89: 30-38.
Feitelson J. S., Payne, J. and Kim L. (2009). Bacillus thuringiensis insect and beyond. Biotech 102: 71-275.
Fischhoff D.A., Bowdish K.S., Perlak F.J,, Marrone P.G., McCormick S. M. and Crossland L. (2006). Insect tolerant transgenic tomato plants. Nature biotechnology 5:807-813.
Flachowsky G., Chesson A. and Aulrich K. (2009). Animal nutrition with feeds from genetically modified plants. Aroh Anim Nutr59: 1-40.
Geman N. J. (2006). Gene-altered B.t. crops threaten public health: Immune responses and skin sensitization in farm workers and presence of B.t. in many genetically engineered foods. Lome, Texas. Pp. 4-5.
Gomez-Barbero M., Kathage. J. and Rodrigues-Cerezo, F. (2012). Framework for assessing the socio-economic impacts of Bt maize cultivation (2nd Ed.) European GMO, Economics Bureau. Pp1-48.
Grisolia C.K., Oliveira R, Domingues I, Oliveira-Filho E.C. and Monerat R.G. (2009) Genotoxic evaluation of different delta-endotoxins from Bacillus thuringiensis on Zebra fish adults and development in early life stages. Mutat Res 672: 119-123.
Hammond A., Galizi R., Kyrou K., Alekos S., Simoni A., Sinisralchi C., Katsanos D., Gribble M., Baker D., Marois E., Russel S., Burt A., Windbichler D., Crisanti A. and Nolan T. (2013). A CRISPR-Cas9 gene drive system targeting female reproduction in the malaria mosquito vector Anopheles gambiae. Nature Biotechnology 34: 78-83.
Hammond P.T., Galizi R., Kyrou K. and Alekos S. (2012). A CRISPR-Cas 9 gene drive system targeting female reproduction in the malaria mosquito vector Anopheles gambiae.
Hashimoto W, Momma K., Yoon H. J., Ozawa S., Ohkawa Y. and Ishige T. (2011) Safety assessment of transgenic potatoes with soybean glycinin by feeding studies in rats. Bioscience Biotechnology Biochemistry 63: 1942-1946. Pmid: 10635558.
Helimich R. L. and Helimich K. A. (2012). Use and impact of Bt maize. Nature Education Knowledge; 3(10): 4.
James C. (2011). Global status of commercialized biotech/GM crops. ISAAA Briefs 43: 1-338.
Jez J. M., Bruce Hammond., Kough J. and Corinne H. G. (2011). Toxicological evaluation of proteins introduced into food crops. 5th edition; 40-60.
Jocelyn H. and Geregarious M.D. (1974). Histopathologic techniques JMC Press INC., Quezen City Philliphines. 2nd edition; 10-15.