Copyright © 2002, American Society for Microbiology. All Rights Reserved.
Analysis of
Chlamydia pneumoniae
Growth in Cells by Reverse
Transcription-PCR Targeted to Bacterial Gene Transcripts
Shusaku Haranaga, Hideaki Ikejima, Hiroyuki Yamaguchi, Herman Friedman, and
Yoshimasa Yamamoto*
Department of Medical Microbiology and Immunology, University of South Florida College of Medicine, Tampa, Florida 33612
Received 2 July 2001/Returned for modification 6 November 2001/Accepted 20 November 2001
Chlamydia pneumoniaeis an obligate intracellular bacterium and has a unique development cycle consisting
of an elementary body (EB) and reticular body (RB). EBs survive in extracellular environments as well as infect susceptible host cells. However, EBs display no measurable metabolic activity. In contrast, RBs are metabol-ically active and can replicate in a host cell but are noninfectious. Therefore, analysis ofC. pneumoniaegrowth in infected cells by conventional bacterial culture may not permit sufficient information about growth of the bacteria in cells. In this study, therefore, we examined the usefulness of the reverse transcription (RT)-PCR method for analysis of bacterial transcripts to evaluateC. pneumoniaegrowth in HEp-2 cells because the levels of bacterial gene transcripts are known to show the metabolic activity of bacteria. The transcripts for theC.
pneumoniae hsp60gene and 16S rRNA in the cells were easily detected just after infection, followed by a marked
increase. In contrast,pyk andomcB transcripts slowly increased after a latent period. The hydrocortisone treatment ofC. pneumoniae-infected cells induced an increase of all bacterial transcripts tested compared with the control group. The treatment of the infected cells with the antibiotic minocycline showed a selective inhibition of bacterial gene transcripts, even though the complete inhibition of EB production determined by the bacterial culture assay was evident. These results indicate that the determination of bacterial gene transcripts by RT-PCR might be a powerful method to analyze in detail growth ofC. pneumoniaein host cells, particularly altered bacterial growth caused by agents such as antimicrobials.
Chlamydia pneumoniae, an obligate intracellular bacterium, causes a wide spectrum of respiratory tract infections (10, 11, 14). Current studies indicate that this pathogen is associated with not only respiratory diseases but also chronic inflamma-tory diseases, such as atherosclerosis, endocarditis, asthma, and arthritis (9, 12, 20, 24). Similar to other chlamydia species,
it is known that the infection of cells withC. pneumoniae is
initiated by an environmentally resistant electron-dense form termed the elementary body (EB). The transition from EB to the metabolically active replication cell, called the reticulate body (RB), begins within the first few hours after infection. The RBs multiply by binary fission until the late phase of infection and begin to convert back to EBs (7, 17). In general, the growth of this organism can be monitored by passage of cultures on appropriate freshly prepared cells, such as HEp-2 cells. However, since RB is not infectious, this bacterial culture system reflects only the EB number in infected cells. Although an electron microscopic study could demonstrate the detail of morphological changes of this pathogen, it cannot show viabil-ity or metabolic activviabil-ity of the bacteria. In particular, it can be conjectured that if some agents, such as antibiotics, alter the
development cycle of C. pneumoniae and interfere with the
conversion to EBs but leave viable forms in cells, the presence of such bacteria may not be assessed by ordinary bacterial culture.
Since some structure proteins of EBs and RBs are known to
be different (13, 18), analysis of transcript levels of such protein genes in infected cells by reverse transcription (RT)-PCR may
be a suitable method to assessC. pneumoniaeinfection.
There-fore, in the present study we examined the usefulness of the
detection ofC. pneumoniaetranscripts by RT-PCR specific for
C. pneumoniae16S rRNA and several other genes during the infection in cells.
MATERIALS AND METHODS
Cells.HEp-2 cells were purchased from the American Type Culture Collec-tion, Manassas, Va. The cells were maintained in Dulbecco’s modified Eagle’s medium (Sigma Chemical Co., St. Louis, Mo.) containing 10% fetal calf serum (HyClone Laboratories, Logan, Utah) and antibiotics (gentamicin, 10g/ml; vancomycin, 10 mg/ml; amphotericin B, 1g/ml).
Organisms.C. pneumoniae(AR-39) was obtained from the American Type Culture Collection and propagated in HEp-2 cell cultures (23, 29). Chlamydial EBs were purified by density gradient centrifugation with urographin (Schering Japan, Osaka, Japan) as previously described (4). Purified EBs were suspended in sucrose-phosphate-glutamic acid buffer (0.2 M sucrose, 3.8 mM KH2PO4, 6.7
mM Na2HPO4, 5 mML-glutamic acid [pH 7.4]) and then stored at⫺70°C until
used. Inclusion-forming units (IFU) of the prepared EBs were determined by counting chlamydial inclusions in HEp-2 cell monolayers.
Infection withC. pneumoniae.The HEp-2 cells were dispensed to 6-well or 24-well (with or without glass coverslips) culture plates and incubated for 2 h in 5% CO2at 37°C. The cells were then infected with EBs at a multiplicity of
infection (MOI) of 5 by centrifugation at 900⫻gfor 1 h, washed two times with Hanks’ balanced salt solution, and incubated in the medium at 37°C in 5% CO2
for up to 72 h. Uninfected HEp-2 cells were also prepared as a control culture.
IFU assay.The infected cells were harvested at appropriate time points (6 to 72 h) after infection and then disrupted by sonication (Sonic Dismembrator 60; Fisher Scientific, Pittsburgh, Pa.). The resulting cell lysates were serially diluted and centrifuged on the HEp-2 cell monolayers. After 72 h of cultivation with cycloheximide (1g/ml), the cells were fixed with ethanol and stained with fluorescein isothiocyanate (FITC)-conjugated anti-Chlamydialipopolysaccharide monoclonal antibody (Research Diagnostics Inc., Flanders, N.J.). The chlamyd-ial inclusion bodies were counted under a fluorescence microscope.
* Corresponding author. Mailing address: Department of Medical Microbiology and Immunology, University of South Florida College of Medicine, 12901 Bruce B. Downs Blvd., Tampa, FL 33612. Phone: (813) 974-2332. Fax: (813) 974-4151. E-mail: [email protected].
313
on August 17, 2020 by guest
http://cvi.asm.org/
RNA extraction and RT-PCR.The total RNA was extracted from infected cells using an RNeasy Mini Kit (Qiagen, Valencia, Calif.) according to the manufac-turer’s instructions with the protocol for bacterial cells. The concentration of RNA was quantified by spectrophotometry, and RNA was stored at⫺70°C until used. The extracted RNAs were treated with DNase (DNA-free; Ambion, Aus-tin, Tex.) to eliminate the contaminating DNA. The resulting DNA-free RNAs were confirmed by PCR without RT. The RT of 2g of RNA was performed with avian myeloblastosis virus reverse transcriptase (Promega, Madison, Wis.) with random primers in a commercial reaction mixture (20l; Reverse Tran-scription System; Promega). The resulting cDNAs (2l) were then subjected to PCR with primers specific forC. pneumoniae16S rRNA,hsp60,pyk, andomcB. The primers forpykandomcBwere designed from GenBank cDNA sequences using the Web site program Primer 3 (http://www.path.cam.ac.uk/cgi-bin/ primer3.cgi). The sequences of all primers used in this study are shown in Table 1. As a control, the PCR for human-actin was also performed. The primer sequences for-actin were described previously (31). Each PCR condition was optimized before being applied to samples. The PCR cycle consisted of a 5-min denaturation at 95°C followed by 25 to 40 cycles each of 45 s of denaturation at 94°C; 45 s of annealing at 60°C for-actin, 55°C for 16S-rRNA andomcB, 58°C forhsp60, and 53°C forpyk; and 1 min of extension at 72°C. The PCR products were visualized by electrophoresis with an ethidium bromide-stained 2% agarose gel. The levels of chlamydia mRNA transcript were normalized relative to the
-actin level using densitometry readings. To prevent carryover contamination, an aerosol-resistant tip was used in all steps. Preparation of the PCR mixture was performed in a separate room.
Treatment with HC and minocycline.The effect of the immunomodulatory agent hydrocortisone (HC) and the antimicrobial agent minocycline on the growth ofC. pneumoniaein cells was analyzed by RT-PCR for bacterial mRNAs. The cells were infected withC. pneumoniae(MOI, 5) and then treated with or without HC (0.1 to 10g/ml; Sigma) or minocycline (0.1 to 10g/ml; Sigma). At 24 and 48 h after incubation, the growth ofC. pneumoniaein the cells was assessed by bacterial culture (IFU assay) and RT-PCR.
Statistical analysis.Statistical analysis was performed with Student’sttest.
RESULTS
Analysis ofC. pneumoniaegrowth by RT-PCR.In order to determine the usefulness of bacterial transcript assay
(RT-PCR) for assessment of C. pneumoniae infection in cells,
HEp-2 cells, which are widely utilized for propagation of this pathogen (23, 29), were utilized in this study as a host cell. The growth of bacteria in the cells was assessed by detection of chlamydial inclusions and measurement of infectious progeny by repassage on freshly prepared HEp-2 cells (IFU assay). As
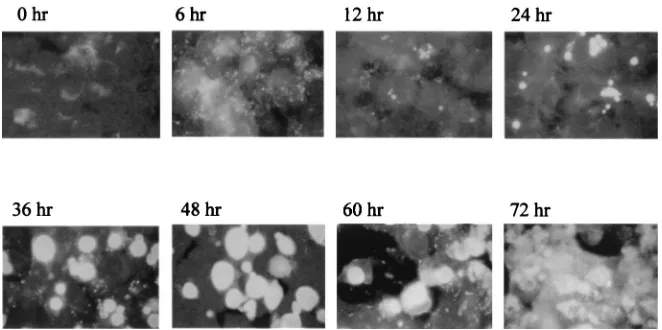
seen in Fig. 1,C. pneumoniae-infected HEp-2 cells showed the
typical apple green when stained with FITC-labeled anti-
Chla-mydiaantibody but small inclusion bodies at 6 h after infection. The size of inclusions was then increased until 60 h after infection. At the late phase of infection, such as 72 h after infection, many ruptured inclusions were observed. These mor-phological observations were well matched to the results of infectious progeny assay (IFU assay) (Fig. 2). That is, the number of infectious progeny (EBs) at the beginning of the infection (zero time) was limited and may reflect the number of initial EBs in infected cells. At 12 h after infection, the formation of infectious progeny was decreased and then un-derwent a marked increase. At 48 h after infection, the number of infectious bacteria in infected cells reached a plateau. The
FIG. 1. Fluorescence micrographs ofC. pneumoniae-infected HEp-2 cells stained with FITC-labeled anti-Chlamydiaantibody. The numbers indicated represent the time after infection. Magnification,⫻1,000.
TABLE 1. Primer sequences used for PCR
Target gene Primer direction Sequence Fragment size (bp)
16S rRNA Sense 5⬘-TGA CAA CTG TAG AAA TAC AGC-3⬘ 463
Antisense 5⬘-CGC CTC TCT CCT ATA AAT-3⬘
hsp60 Sense 5⬘-ACG TCA CGT AGT TAT AGA TAA GAG-3⬘ 507
Antisense 5⬘-AAG TAG CTG GAG AGG TAT CCA CGG-3⬘
pyk Sense 5⬘-TGT GGA TGT GGT TGC TGC AT-3⬘ 411
Antisense 5⬘-GCA GTT TCC CCT GAC AAC AT-3⬘
omcB Sense 5⬘-GGA TCT GCT ATT GCC CGT AA-3⬘ 217
Antisense 5⬘-CAG AAC ATT TGT GTC CAC CG-3⬘
314 HARANAGA ET AL. CLIN. DIAGN. LAB. IMMUNOL.
on August 17, 2020 by guest
http://cvi.asm.org/
reproduction profile of infectious chlamydia organisms during the infection in HEp-2 cells observed in this study was similar
to that found in a previous study in HeLa cells infected withC.
trachomatis(25).
The assessment ofC. pneumoniaegrowth by RT-PCR
spe-cific for four different C. pneumoniae genes—16S rRNA,
hsp60, pyk, andomcB—was performed. Both 16S rRNA and
hsp60transcripts are known to be expressed in both EBs and
RBs (25). pyk, which encodes pyruvate kinase, and omcB,
which encodes the 60-kDa cysteine-rich outer membrane pro-tein, are known to be transcribed during the mid- and the later
developmental cycles, respectively (25). Particularly, omcB
transcripts are recognized to be expressed at a point when RBs
begin to differentiate back to EBs in the case ofC. trachomatis
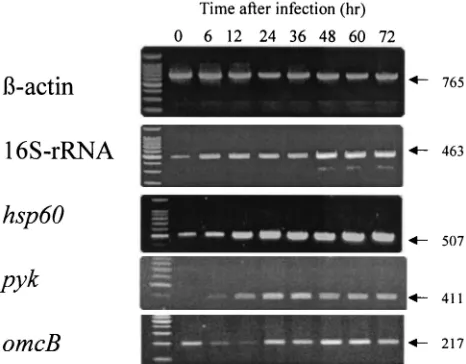
infection in HeLa cells (25). Figure 3 shows the representative RT-PCR result of the RNA isolated from the infected cells at different time points. Although all gene transcripts tested were expressed during the infection, the levels of each transcript depended upon the phase of infection.
In order to quantify the transcription level of the gene, the relative expression levels of each gene to the host cell
house-keeping gene (-actin) expression level were measured. As
shown in Fig. 4, both 16S rRNA andhsp60transcripts were
rapidly expressed at the beginning of infection, followed by a consistent increase until the late phase of infection, such as
72 h after infection. The levels ofpyk gene transcripts were
minimum at the beginning of the infection and relatively low during the midphase of infection, such as 6 and 12 h after infection, but reached a plateau at 24 h after infection. In
contrast,omcBtranscripts were relatively high at the beginning
of infection and decreased during the midphase of infection, followed by a sharp increase at the late phase of infection. The
fluctuation ofomcBtranscripts observed was well matched to
the reproduction profile of infectious EBs assessed by IFU assay.
Alteration of bacterial growth by minocycline and HC. In order to determine the usefulness of the bacterial transcript assay for assessment of altered bacterial growth, infection was modulated by two agents, i.e., the antibiotic minocycline and immunosuppressant HC (30). The HEp-2 cells were infected withC. pneumoniaeand then treated with several concentra-tions of minocycline or HC for 48 h. The altered bacterial growth in HEp-2 cells treated with these agents was then as-sessed by IFU as well as bacterial transcript assays. As shown in Fig. 5, the antibiotic minocycline markedly inhibited the reproduction of infectious EBs at all concentrations tested. In
FIG. 2. One-step growth curve ofC. pneumoniaein HEp-2 cells. The HEp-2 cells were infected with C.pneumoniaeat an MOI of 5 by centrifugation and incubated at 37°C in 5% CO2in the presence of cycloheximide (1g/ml). The number of infectious progeny was determined
by IFU assay on fresh HEp-2 cells. The data presented are representative results of three experiments. The data represent the means⫾standard deviations (error bars) for three cultures.
FIG. 3. Detection ofC. pneumoniaegene transcripts by RT-PCR during infection. RT-PCR analysis was performed for each of the RNAs isolated from infected cells at the indicated time points after infection. The numbers on the right side show the predicted size (in base pairs) of PCR specific products.
on August 17, 2020 by guest
http://cvi.asm.org/
contrast, HC significantly enhanced the reproduction of infec-tious EBs 48 h after infection at concentrations (1.0 and 10.0
g/ml) which can be reached in blood after administration of
100 to 500 mg of HC (22, 28).
The assessment ofC. pneumoniaegrowth by bacterial
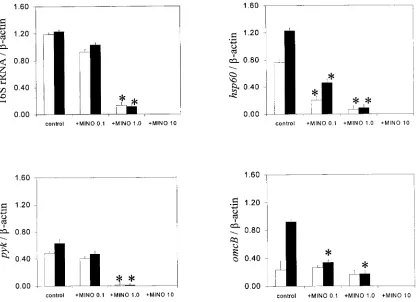
tran-script assay also revealed alteration by these agents. As appar-ent in Fig. 6, the treatmappar-ent of the cells with minocycline in-duced a marked suppression of all bacterial gene transcripts at
the highest concentration of 10g/ml, which is more than 150
times the MIC (0.06g/ml) of minocycline, at both 24 and 48 h
after infection. However, when the concentration of
minocy-cline was reduced to a low level, such as 1.0 or 0.1g/ml, the
suppression profile of bacterial gene transcripts was still
nota-ble. That is, the low concentration (1.0g/ml) of minocycline
selectively inhibited the expression ofC. pneumoniae genes,
such ashsp60andomcB. Particularly, thehsp60gene transcript
was the most sensitive to the minocycline treatment among the
bacterial genes tested. In contrast, both 16S rRNA and pyk
transcripts were not affected by minocycline at the 0.1-g/ml
dose, even though such a concentration showed a marked inhibition of reproduction of infectious EBs (Fig. 5). In the case of HC-treated cells, all bacterial gene transcripts tested were increased at the high HC concentrations, such as 1 and 10
g/ml, at 48 h after infection (Fig. 7). Some bacterial gene
transcripts, such as 16S rRNA and omcB, were significantly
increased at the low concentration (0.1 g/ml) of HC, even
FIG. 4. Relative levels ofC. pneumoniaegene transcripts in infected cells. Total RNA was extracted fromC. pneumoniae-infected cells at the indicated time points after infection and subjected to RT-PCR specific forC. pneumoniae16S-rRNA,hsp60,pyk, andomcB. The PCR products for bacterial genes were semiquantitated and normalized to host cell-actin using densitometry readings. The data are presented as the ratio (mean⫾standard deviation [error bar]) of bacterial gene transcripts to-actin from three experiments. Symbols:E, 16S rRNA;F,hsp60;䊐,pyk; ■,omcB.
FIG. 5. Effect of minocycline versus HC treatment of cells on the reproduction of infectiousC. pneumoniae.The HEp-2 cells were infected with
C. pneumoniaeand then treated with or without the indicated concentrations of minocycline (MINO) or HC. At 24 h (open columns) or 48 h (closed columns) after infection, the infectious progenies in the cell lysates were assessed by IFU assay. The data are presented as the means⫹ standard deviations (error bars) for three experiments. *,P⬍0.05 (significantly different from the control group at the same time point).
316 HARANAGA ET AL. CLIN. DIAGN. LAB. IMMUNOL.
on August 17, 2020 by guest
http://cvi.asm.org/
though such a concentration did not result in any significant increase of reproduction of infectious EBs as determined by IFU assay.
DISCUSSION
The detection of bacterial transcripts as a marker for viable and metabolically active bacteria has been utilized for a wide
variety of bacteria, includingEscherichia coli, (26),Legionella
pneumophila (2), Vibrio cholerae (3), Mycobacterium leprae
(21), andEnterococcus faecalis(5). Because mRNA is turned
over rapidly in living bacterial cells, with most mRNA species having a half-life of only a few minutes (1), the presence of certain bacterial mRNAs can be regarded as a valid and con-vincing criterion for assessing cell viability (3, 21, 26). In this
regard, determination of viable C. pneumoniae by RT-PCR
targeting bacterial mRNAs in clinical specimens has been ex-amined for demonstration of viable and metabolically active bacteria (6, 8).
A recent study by Shaw et al. (25) showed that the
expres-sion ofC. trachomatisgenes during the developmental cycle in
cells may be classified in three groups: genes expressed at the early cycle, which are detected by 2 h after infection during the germination of EBs to RBs; at the midcycle, which occurs between 6 and 12 h after infection and represents transcripts expressed during the growth and multiplication of RBs; and at
the late cycle, which occurs between 12 and 20 h after infection and represents those genes transcribed during the terminal
differentiation of RBs to EBs. Since C. pneumoniae has a
developmental cycle in cells similar to that ofC. trachomatis,
differential bacterial gene expressions during the bacterial growth in infected cells seems likely.
Four C. pneumoniae-specific genes, 16S rRNA,hsp60,pyk,
andomcB, were selected in this study as a possible marker for
each stage of the developmental cycle in cells. Both 16S rRNA andhsp60transcripts have been detected in the early cycle of
C. trachomatis infection, but pyk and omcB transcripts were observed in the midcycle and the late cycle of this pathogen, respectively (25). The detection of these transcripts during the
infection of HEp-2 cells with C. pneumoniae in this study
showed similar results as seen inC. trachomatis-infected HeLa
cells (25), but the present study revealed semiquantitative fluc-tuation of these gene transcripts during the infection. Since detection of bacterial transcripts by RT-PCR only may not provide sufficient information regarding bacterial growth due to heterogenous bacterial growth stages occurring simulta-neously in infected cells, the quantitative assay for transcripts
may be essential for analysis ofC. pneumoniaegrowth in cells.
Both 16S rRNA andhsp60 transcripts were detected in the
early phase of infection and increased rapidly, even though the IFU assay, which detects only infectious EBs, did not show any increase during the early phase of infection, such as 6 to 24 h
FIG. 6. Effect of minocycline (MINO) on the levels of bacterial transcripts in infected cells determined by RT-PCR. The RNAs were extracted from the infected cells treated with or without minocycline at 24 h (open column) or 48 h (closed column) after infection. The RNAs were subjected to RT-PCR specific for bacterial genes or host cell-actin. The data are presented as the ratio (means⫹standard deviations [error bars]) of bacterial gene transcripts to-actin from three experiments. *,P⬍0.05 (significantly different from the group at the same time point).
on August 17, 2020 by guest
http://cvi.asm.org/
after infection. These results indicate that both 16S rRNA and
hsp60 transcripts are expressed in all metabolically active
stages ofC. pneumoniaegrowth, including noninfectious RBs
in infected cells. In contrast, both pyk and omcBtranscripts
were detected at significant levels until the mid- to late phase
of infection. In particular,omcBtranscripts reached a
signifi-cant level only at the late phase of infection, such as 48 h after
infection. This relatively slow increase of omcB transcripts
paralleled the IFU results. Therefore, the expression levels of
omcBmay be a good marker for the presence of EBs. The
omcBencodes the 60 kDa cysteine-rich outer membrane
pro-tein, which is known to be solely expressed in EBs but not in
RBs ofC. trachomatis(19). The results obtained in this study
withC. pneumoniaewere consistent with such previous results ofC. trachomatis-infected cells. The reason for the decline of some bacterial gene transcript levels at the late stage of infec-tion, such as 72 h after infecinfec-tion, is not clear. However, it seems likely that the limited microenvironment for the growth of the bacteria may affect the expression levels of some bacterial genes due to overgrowth.
The analysis ofC. pneumoniaegrowth in HEp-2 cells treated
with the antibiotic minocycline or immunosuppressant HC by the bacterial transcript assay revealed some detail of the al-tered bacterial growth. The minocycline treatment of cells markedly inhibited the production of infectious EBs deter-mined by IFU assay at all concentrations tested. However, the lowest concentration of minocycline tested inhibited only
hsp60andomcBtranscripts at 24 (hsp60) and 48 h (hsp60and
omcB) after infection. The 16S rRNA andpyktranscripts were
not affected by the minocycline treatment at the concentration
of 0.1g/ml, which induced an almost-complete inhibition of
EB production. These results indicate that the low
concentra-tion (0.1g/ml) of minocycline may block the conversion of
RBs to EBs but may not be sufficient to inhibit the
metaboli-cally active form, such as RBs. The inhibition ofhsp60
expres-sion by the low minocycline concentration may be due to, but not only, the result of inhibition of protein synthesis, which is the common antimicrobial mechanism of tetracycline antibiot-ics, including minocycline.
Steroid treatment is widely utilized in clinics as a therapy to treat immunoreactive as well as inflammatory diseases. How-ever, it is known that the steroid treatment may induce sus-ceptibility to a wide variety of infections due to its immuno-suppressive activity (30). Recent studies show that HC
enhances the growth ofC. pneumoniaeas well asC.
trachoma-tisin vitro (15, 16, 27). Furthermore, it has also been
demon-strated that cortisone treatment induces a reactivation of
per-sistentC. pneumoniaein a mouse model (27). In the present
study, the HC treatment induced the enhancement ofC.
pneu-moniae growth in cells demonstrated by both the bacterial transcript assay and bacterial culture (IFU assay). Specifically, treatment with the lowest concentration of HC, such as 0.1
g/ml, enhanced both 16S rRNA andomcBtranscripts, even
though the IFU assay did not show any significant increase of EB numbers at this concentration. These results indicate that
the HC treatment induces the growth ofC. pneumoniae,
in-cluding both RBs and EBs, and furthermore, the bacterial transcript assay using RT-PCR is more sensitive than the IFU
FIG. 7. Effect of HC on the levels of bacterial transcripts in infected cells determined by RT-PCR. See the legend to Fig. 6 for details. The data are presented as the ratio (means⫹standard deviations [error bars]) of bacterial gene transcripts to-actin from three experiments. *,P⬍0.05 (significantly different from the group at the same time point).
318 HARANAGA ET AL. CLIN. DIAGN. LAB. IMMUNOL.
on August 17, 2020 by guest
http://cvi.asm.org/
assay to determine the effect of HC on the growth ofC. pneu-moniae.
Thus, the results in this study indicate that the bacterial transcript assay using RT-PCR may be a powerful tool to
analyze the growth of C. pneumoniae in cells; in particular,
alteredC. pneumoniaegrowth caused by antibiotics or
immu-nomodulatory agents, which may not be assessed sufficiently by the conventional bacterial culture methods such as the IFU assay, is the object.
REFERENCES
1.Alifano, P., C. B. Bruni, and M. S. Carlomagno.1994. Control of mRNA processing and decay in prokaryotes. Genetica94:157–172.
2.Bej, A. K., M. H. Mahbubani, and R. M. Atlas.1991. Detection of viable
Legionella pneumophilain water by polymerase chain reaction and gene probe methods. Appl. Environ. Microbiol.57:597–600.
3.Bej, A. K., W. Y. Ng, S. Morgan, D. D. Jones, and M. H. Mahbubani.1996. Detection of viableVibrio choleraeby reverse-transcriptase polymerase chain reaction (RT-PCR). Mol. Biotechnol.5:1–10.
4.Caldwell, H. D., J. Kromhout, and J. Schachter.1981. Purification and partial characterization of the major outer membrane protein ofChlamydia trachomatis. Infect. Immun.31:1161–1176.
5.del Mar Lleo, M., S. Pierobon, M. C. Tafi, C. Signoretto, and P. Canepari.
2000. mRNA detection by reverse transcription-PCR for monitoring viability over time in anEnterococcus faecalisviable but nonculturable population maintained in a laboratory microcosm. Appl. Environ. Microbiol.66:4564– 4567.
6.Esposito, G., F. Blasi, L. Allegra, R. Chiesa, G. Melissano, R. Cosentini, P. Tarsia, L. Dordoni, C. Cantoni, C. Arosio, and L. Fagetti.1999. Demonstra-tion of viableChlamydia pneumoniaein atherosclerotic plaques of carotid arteries by reverse transcriptase polymerase chain reaction. Ann. Vasc. Surg.
13:421–425.
7.Friis, R. R.1972. Interaction of L cells andChlamydia psittaci: entry of the parasite and host responses to its development. J. Bacteriol.110:706–721. 8.Gerard, H. C., H. R. Schumacher, H. El-Gabalawy, R. Goldbach-Mansky,
and A. P. Hudson.2000.Chlamydia pneumoniae present in the human synovium are viable and metabolically active. Microb. Pathog.29:17–24. 9.Grayston, J. T.1996.Chlamydia pneumoniaeand atherosclerosis. Rev. Med.
Int.17:45S-47S.
10.Grayston, J. T.1989.Chlamydia pneumoniae, strain TWAR. Chest95:664– 669.
11.Grayston, J. T., S. P. Wang, C. C. Kuo, and L. A. Campbell.1989. Current knowledge onChlamydia pneumoniae, strain TWAR, an important cause of pneumonia and other acute respiratory diseases. Eur. J. Clin. Microbiol. Infect. Dis.8:191–202.
12.Hahn, D. L., R. W. Dodge, and R. Golubjatnikov.1991. Association of
Chlamydia pneumoniae(strain TWAR) infection with wheezing, asthmatic bronchitis, and adult-onset asthma. JAMA266:225–230.
13.Hatch, T. P., I. Allan, and J. H. Pearce.1984. Structural and polypeptide
differences between envelopes of infective and reproductive life cycle forms ofChlamydiaspp. J. Bacteriol.157:13–20.
14.Kauppinen, M., and P. Saikku.1995. Pneumonia due toChlamydia pneu-moniae: prevalence, clinical features, diagnosis, and treatment. Clin. Infect. Dis.21(Suppl. 3):S244-S252.
15.Laitinen, K., A. L. Laurila, M. Leinonen, and P. Saikku.1996. Reactivation ofChlamydia pneumoniaeinfection in mice by cortisone treatment. Infect. Immun.64:1488–1490.
16.Malinverni, R., C. C. Kuo, L. A. Campbell, and J. T. Grayston.1995. Reactivation ofChlamydia pneumoniaelung infection in mice by cortisone. J. Infect. Dis.172:593–594.
17.Moulder, J. W.1991. Interaction of chlamydiae and host cells in vitro. Microbiol. Rev.55:143–190.
18.Myers, G. S., R. Grinvalds, S. Booth, S. I. Hutton, M. Binks, D. J. Kemp, and K. S. Sriprakash. 2000. Expression of two novel proteins inChlamydia trachomatisduring natural infection. Microb. Pathog.29:63–72.
19.Newhall, W. J., V.1987. Biosynthesis and disulfide cross-linking of outer membrane components during the growth cycle ofChlamydia trachomatis. Infect. Immun.55:162–168.
20.Norton, R., S. Schepetiuk, and T. W. Kok.1995.Chlamydia pneumoniae
pneumonia with endocarditis. Lancet345:1376–1377.
21.Patel, B. K., D. K. Banerjee, and P. D. Butcher.1993. Determination of
Mycobacterium lepraeviability by polymerase chain reaction amplification of 71-kDa heat-shock protein mRNA. J. Infect. Dis.168:799–800.
22.Peterson, R. E., J. B. Wyngaarden, S. L. Guerra, B. B. Brodie, and J. J. Bunim.1955. The physiological disposition and metabolic rate of hydrocor-tisone in man. J. Clin. Investig.34:1779.
23.Roblin, P. M., W. Dumornay, and M. R. Hammerschlag.1992. Use of HEp-2 cells for improved isolation and passage ofChlamydia pneumoniae. J. Clin. Microbiol.30:1968–1971.
24.Saario, R., and A. Toivanen.1993.Chlamydia pneumoniaeas a cause of reactive arthritis. Br. J. Rheumatol.32:1112.
25.Shaw, E. I., C. A. Dooley, E. R. Fischer, M. A. Scidmore, K. A. Fields, and T. Hackstadt. 2000. Three temporal classes of gene expression during the
Chlamydia trachomatisdevelopmental cycle. Mol. Microbiol.37:913–925. 26.Sheridan, G. E., C. I. Masters, J. A. Shallcross, and B. M. MacKey.1998.
Detection of mRNA by reverse transcription-PCR as an indicator of viability inEscherichia colicells. Appl. Environ. Microbiol.64:1313–1318. 27.Tsumura, N., U. Emre, P. Roblin, and M. R. Hammerschlag.1996. Effect of
hydrocortisone succinate on growth of Chlamydia pneumoniae in vitro. J. Clin. Microbiol.34:2379–2381.
28.Webel, M. L., R. E. Ritts, Jr., H. F. Taswell, J. V. Danadio, Jr., and J. E. Woods.1974. Cellular immunity after intravenous administration of meth-ylprednisolone. J. Lab. Clin. Med.83:383–392.
29.Wong, K. H., S. K. Skelton, and Y. K. Chan.1992. Efficient culture of
Chlamydia pneumoniaewith cell lines derived from the human respiratory tract. J. Clin. Microbiol.30:1625–1630.
30.Yamamoto, Y., and H. Friedman.1996. Steroids and infection, p. 173–194.In
H. Friedman, T. W. Klein, and A. L. Friedman (ed.), Psychoneuroimmunol-ogy, stress, and infection. CRC Press, New York, N.Y.
31.Zhou, L. J., and T. F. Tedder.1995. A distinct pattern of cytokine gene expression by human CD83⫹blood dendritic cells. Blood86:3295–3301.