1071-412X/96/$04.0010
Copyrightq1996, American Society for Microbiology
Alterations in Lymphocyte Phenotype and Function in Children
with Shigellosis Who Develop Complications
TASNIM AZIM,* MOHAMMED S. SARKER, JENA HAMADANI, NARGIS KHANUM,
RAMESH C. HALDER, MOHAMMED A. SALAM,
ANDM. JOHN ALBERT
International Centre for Diarrhoeal Disease Research,
Bangladesh, Dhaka 1000, Bangladesh
Received 5 September 1995/Returned for modification 2 November 1995/Accepted 21 December 1995
This study was designed to see whether alterations occur in peripheral blood mononuclear cell phenotype
and function in children with
Shigella dysenteriae
1 infection with complications (leukemoid reaction and/or
hemolytic-uremic syndrome) and whether there are any alterations prior to the development of complications.
The following groups of children (ages, 12 to 60 months) were compared: children without any infection (
n
5
51), children with uncomplicated shigellosis (
n
5
65), children admitted with complicated shigellosis
(leuke-moid reaction and/or hemolytic-uremic syndrome) (
n
5
29), and children with shigellosis who developed
complications after enrollment (subsequently complicated shigellosis) (
n
5
12). Tests for the peripheral blood
mononuclear cell phenotype (CD3, CD4, CD8, CD16, CD20, and CD25), spontaneous proliferation, and the
proliferative response to phytohemagglutinin, pokeweed mitogen, and the lipopolysaccharide of
S. dysenteriae
1 were performed, as were skin tests for delayed-type hypersensitivity (DTH). Children who subsequently
developed complications differed from other groups of children as follows: (i) the numbers of CD3
1and CD4
1cells were lower than in uninfected children (
P
< 0.05), (ii) the CD4/CD8 ratio was lower than in children with
uncomplicated shigellosis (
P
< 0.05) and in uninfected children (
P
< 0.05), and (iii) the levels of spontaneous
proliferation of peripheral blood mononuclear cells were higher and DTH responses were lower than those in
children with uncomplicated shigellosis (
P
< 0.05 and
P
< 0.017, respectively). Children with complications
differed by having (i) increased numbers of CD3
2CD16
2CD20
2cells (
P
< 0.05) compared with those in other
groups of children and (ii) lower CD4/CD8 ratios (
P
< 0.05), higher levels of spontaneous proliferation (
P
<
0.05), and lower DTH responses (
P
5
0.005) than children with uncomplicated shigellosis. Three to five days
after enrollment, the number of CD4
1cells increased in children who subsequently developed complications
(
P
5
0.025), i.e., when they developed complications and at this time their CD4
1cell number was similar to
that of other groups of children. Thus, lymphocyte phenotype and function are altered prior to the development
of complications in children with shigellosis, and once complications develop, the pattern of alterations
changes. Whether these alterations have a role in precipitating complications or whether they reflect early
events underlying the development of complications remains to be elucidated.
Protection from shigellosis appears to be mediated by
anti-bodies specific to Shigella antigens (5, 6) as well as by
Shigella-specific T cells. The evidence for the involvement of T cells is
provided by patients with AIDS in whom illness with shigellosis
is very severe (2, 10), by the increased numbers of CD4
1and
CD8
1cells in the guts of adults with shigellosis (13), and by the
generation of a Shigella-specific T-cell clone from the
periph-eral blood of a patient with reactive arthritis (21). Infection
with Shigella dysenteriae 1 in children under 5 years of age can
lead to life-threatening complications, such as a leukemoid
reaction (blood leukocyte count of
$
40,000/
m
l, granulocytosis,
and an increase in immature granulocytes) (4) and
hemolytic-uremic syndrome (HUS) (hemolytic anemia,
thrombocytope-nia, and acute renal failure) (12). Although a leukemoid
reac-tion is not serious in itself, its presence is a bad prognostic
indicator (17). The factors precipitating these complications
are not well understood.
Children with leukemoid reactions in shigellosis have been
shown to have more peripheral blood mononuclear cells
(PBMs) that are neither E rosette positive (T cells) nor EAC
rosette positive (B cells) (9). Addition of thymopoietin to these
cells results in an increase in the numbers of E rosette-positive
cells in some of these children, suggesting a block in
matura-tion of T cells (8). However, the overall numbers of T and B
cells are normal in those children. It therefore remains unclear
whether there are alterations in lymphocyte populations in
children with complicated shigellosis (CS), and if there are,
whether those alterations are a consequence of the
complica-tions or whether they predispose the children to the
compli-cations. We therefore designed a study to determine
lympho-cyte phenotype and function in children with shigellosis who
develop leukemoid reactions and/or HUS compared with those
in uninfected children, children with shigellosis in whom these
complications had already developed, and children with
shig-ellosis who never develop them.
MATERIALS AND METHODS
Study population.Children 12 to 60 months of age attending the Clinical Research and Service Centre of the International Centre for Diarrhoeal Disease Research, Bangladesh (ICDDR,B), with acute dysentery (visible blood in stool and presence or absence of fever) were initially enrolled in the study. Stools were examined microscopically and cultured for enteric bacteria (19). Only children who were culture positive for Shigella organisms were included in the study. Informed consent was obtained from the guardian(s) of each child before en-rollment, and the study was approved by the Ethical Review Committee of the ICDDR,B.
Patients were clinically evaluated by their medical history, daily physical ex-* Corresponding author. Mailing address: Laboratory Sciences
Di-vision, ICDDR,B, GPO Box 128, Dhaka 1000, Bangladesh. Phone: 880 2 600171. Fax: 880 2 883116 or 880 2 886050. Electronic mail address: tasnim%[email protected].
191
on August 17, 2020 by guest
http://cvi.asm.org/
amination, and laboratory investigations which included determination of he-matocrit; total and differential counts of leukocytes (WBCs), platelets, and frag-mented erythrocytes (RBCs); and serum electrolyte and creatinine concentrations. All patients were treated with pivmecillinam or ciprofloxacin. Some children received additional antibiotics because of the presence of concomitant infections, such as respiratory tract infection, middle ear infection, or septicemia. Children matched for age and without any infection attending the Nutritional Follow-Up Unit of ICDDR,B were also enrolled. Of the 157 children who were enrolled in the study, 106 had S. dysenteriae 1 infection and 51 were children with no infection (NI) at the time of enrollment. Children with S. dysenteriae 1 infection were divided into three groups: those who had HUS or leukemoid reactions upon enrollment (complicated shigellosis [CS]; n529), those who developed leuke-moid reactions and/or HUS following enrollment (subsequently complicated shigellosis [SCS]; n512), and those who had no such complications (uncom-plicated shigellosis [US]; n565). In children with SCS, complications developed from 1 to 6 days after enrollment (mean, 2.8 days). As the number of PBMs varied among the children, not all assays could be done for all children.
Venous blood (5 ml) was collected aseptically in sterile, heparinized Vacu-tainer tubes (Becton Dickinson, Rutherford, N.J.). Blood was collected from patients upon enrollment and 3 to 5 days later, except from those who had received blood transfusions or were transferred to other hospitals in the interim period. A single sample of blood was collected from each uninfected child.
PBM separation.Fresh blood was separated on Ficoll-Hypaque (Pharmacia, Uppsala, Sweden) by centrifugation at 5003g for 25 min. PBMs which formed a band at the interface were collected, washed, and counted.
Phenotypes of PBMs.Phenotyping of PBMs was done by indirect immunoflu-orescence for CD3, CD4, CD8, CD16, CD20, CD25, and leukocyte common antigen (CD45) by using the monoclonal antibodies UCHT1 (anti-CD3), QS4120 CD4), UCHT4 CD8), HNK1 CD16), and 2D1 (anti-CD45) (gifts of P. C. L. Beverley, Tumor Immunology Group, Imperial Cancer Research Fund, London, United Kingdom); B1 (Coulter Immunology, Hialeah, Fla.) (anti-CD20); and anti-CD25 (interleukin 2R) (Dakopatts, Glostrup, Den-mark). B1 and anti-CD25 were used at dilutions of 1:5 in minimal essential medium with 2% fetal bovine serum (FBS) (GIBCO, Grand Island, N.Y.); the other monoclonal antibodies were not diluted. A positive control monoclonal antibody (2DI) and a negative control of medium alone (minimal essential medium plus 2% FBS) were used in all assays. Briefly, 33105
PBMs were incubated with each monoclonal antibody for 30 min at 48C, washed three times, and then incubated with fluorescein isothiocyanate-conjugated goat anti-mouse immunoglobulin (Dakopatts) at a dilution of 1:40 in minimal essential medium with 2% FBS for 30 min at 48C. The cells were then washed three times and fixed by using phosphate-buffered saline (10 mM, pH 7.2) with 2% FBS and 1% formaldehyde. The cells were analyzed within 3 days of being fixed by using a UV microscope (BH-2; Olympus) with a 403objective; at least 100 cells were counted.
Proliferation assays.The proliferative response of PBMs was assessed with resting cells, for which spontaneous DNA synthesis was measured, and with cells stimulated with mitogens or antigens for several days. In all cases, PBMs were cultured at 53105/ml of RPMI 1640 (GIBCO) supplemented with 10% FBS, 2 mM glutamine (Flow Laboratories, Rickmansworth, Herts, United Kingdom), 50 IU of penicillin (Flow), and 50mg of streptomycin (Flow) per ml in 96-well U-bottomed microtiter plates (Flow) and incubated in a humidified atmosphere containing 5% CO2. All cultures were done in triplicate.
For spontaneous DNA synthesis, PBMs were incubated with 1mCi of [3 H]thy-midine (Amersham International, Aylesbury, United Kingdom) per well of a microtiter plate (Flow) for 3 h. The cells were then harvested onto glass fiber filter strips with a cell harvester (Automash 2000; Dynatech, Billingshurst, Sus-sex, United Kingdom). The amount of [3H]thymidine incorporated was deter-mined as counts per minute by liquid scintillation counting in a beta counter (Beckman Instruments Inc., Fullerton, Calif.).
For the proliferative response to mitogens and antigens, PBMs were cultured with medium alone, phytohemagglutinin (PHA) (Wellcome Diagnostics) at 1.25 mg/ml, pokeweed mitogen (PWM; Sigma) at 10mg/ml, and the lipopolysaccha-ride (LPS) of S. dysenteriae 1 (18). The LPS of S. dysenteriae 1 was used at concentrations of 160 to 5mg/ml at doubling dilutions in subsets of children from all four study groups. As no proliferation was observed with LPS at any of the concentrations used, a single concentration of 10mg/ml was used in all experi-ments. Cells were incubated for 3 days with PHA and for 5 days with other stimulants. At the end of the incubation, the cells were pulsed with [3
H]thymi-dine at 1mCi per well for 6 h; they were then harvested onto glass fiber filter strips and counted in a beta counter. Results were expressed as net proliferation, which was the difference between the mean counts per minute of cells with stimulants and those without stimulants.
DTH responses.Delayed-type hypersensitivity (DTH) responses were mea-sured by skin tests with the Multitest CMI kit (Pasteur Me´rieux, Lyon, France), whereby seven antigens and a glycerine control solution were introduced into the skin of the paravertebral area of the back of each child and the induration was measured at the end of 48 h. An induration of 2 mm or more was considered a positive response. The antigens present in the kit included tetanus (550,000 Me´rieux units per ml), diphtheria (1,100,000 Me´rieux units per ml), streptococ-cus (group C) (2,000 Me´rieux units per ml), tuberculin (300,000 IU/ml), Candida
TABLE 1. Clinical characteristics of children upon enrollment a Study group Age, mo Wt for age, % of the NCHS b median No. (%) Male Duration of diarrhea before enroll-ment, days Stool frequency/ 24 h No. (%) with: Total WBC count/ m l of blood % Lympho- cytes Total no. of lymphocytes/ m l of blood . 20
WBCs/HPF instool
c
.
20
RBCs/HPF instool
d NI 33.9 6 15.8 69.7 6 10.9 24.0 (47.1) NA e NR f 1.0 (1.9) 0 11,992 6 3,467 55.7 6 11.7 6,607 6 2,257 US 32.1 6 13.5 65.6 6 11.7 35.0 (53.8) 8.0 6 5.2 24.3 6 16.0 57.0 (93.4) 43.0 (69.4) 17,852 6 7,859 41.9 6 16.7 6,944 6 2,720 SCS 31.1 6 15.5 73.3 6 8.8 7.0 (58.3) 5.7 6 1.8 27.2 6 21.2 7.0 (58.3) 5.0 (41.7) 25,393 6 7,943 22.4 6 13.5 6,175 6 4,370 CS 26.9 6 11.6 (NS g) 69.7 6 11.9 (NS) 18.0 (62.1) (NS) 8.2 6 4.1 (NS) 23.0 6 15.2 (NS) 19.0 (67.9) 7.0 (25.0) 43,567 6 19,150 28.1 6 14.4 10,475 6 5,576 (P , 0.001) (P 5 0.002) (P , 0.001) (P , 0.001) (P 5 0.005) aAll values are means 6 SDs unless otherwise stated. The Kruskal-Wallis or chi-square test was used to determine the dif ferences in results for $ 3 groups of children; the dif ferences are in parentheses. bNCHS, National Center for Health Statistics. cWBC counts of . 20 per HPF are considered indicative of inflammation. dRBC counts of . 20 per HPF are considered indicative of inflammation. eNA, not applicable. fNR, not relevant. gNS, not significant.
on August 17, 2020 by guest
http://cvi.asm.org/
albicans (2,000 Me´rieux units per ml), Trichophyton mentagrophytes (150 Me´rieux units per ml), and Proteus mirabilis (150 Me´rieux units per ml) antigens.
Statistical analyses.For continuous, nonparametric data, the Mann-Whitney U test was used for comparison of two groups and the Kruskal-Wallis test was used for comparison of three or more groups. When significant differences were recorded with the Kruskal-Wallis test, the Dunn test was used to assess the significance of differences between any two groups. For comparisons between proportions, the chi-square statistic was used. Differences of paired samples from the two study periods were assessed by the Wilcoxon matched-pair signed-rank test (for continuous variables) and the McNemar test (for categorical variables). Multiple-regression analysis was carried out to see the effects of nutritional status, sex, concomitant infection, and duration of diarrhea on lymphocyte phe-notype and function. Differences were considered significant when the P value was#0.05. Data analyses were carried out with the Statistical Package for Social Sciences (version 6.0 for Windows; SPSS Inc., Chicago, Ill.) and SigmaStat (version 1.0 for Windows; Jandel Scientific, San Rafael, Calif.).
RESULTS
Study groups.
Table 1 shows the clinical characteristics of
the children upon enrollment. Children of all four groups were
comparable for age, nutritional status (as determined by
weight for age as a percentage of the National Center for
Health Statistics median), and sex. The three groups of
chil-dren with shigellosis had similar durations of diarrhea before
enrollment and similar stool frequencies in 24 h upon
enroll-ment. Total WBC counts (10
3/
m
l of blood) were higher in
children with shigellosis (whether US, SCS, or CS) than in
children with NI (P
,
0.05 for all comparisons). The
percent-age of lymphocytes was lower in children with shigellosis (US,
SCS, or CS) than in children with NI (P
,
0.05 for all three).
Children with CS had more WBCs than those with US (P
,
0.05), a lower percentage of lymphocytes than children with
US (P
,
0.05), but higher numbers of lymphocytes than all
other groups of children (P
,
0.05 for all three). Lymphocyte
numbers were similar in children with NI, US, and SCS (Table
1). The numbers of children with
.
20 WBCs per high-powered
microscopic field (HPF) and
.
20 RBCs per HPF of stool were
greater among children with shigellosis (whether US, SCS, or
CS) than among children with NI (P
,
0.001 and P
5
0.002,
respectively) (Table 1).
Phenotypes of PBMs.
Upon enrollment, the four groups of
children had significantly different numbers of CD3
1and
FIG. 1. Lymphocyte phenotype, upon enrollment, in children with NI (N), US (U), CS (C), and SCS (SC). Values are medians, and error bars represent SDs. Comparisons between the four study groups were done by the Kruskal-Wallis test; when the differences were significant by this test, this test was followed by the Dunn test for comparison of any two groups. P values are shown only for significant differences.
on August 17, 2020 by guest
http://cvi.asm.org/
CD4
1cells (P
5
0.043 and 0.010, respectively) (Fig. 1). The
numbers of CD3
1and CD4
1cells were both lower in children
with SCS than in those with NI (P
,
0.05); they were similar to
those of other groups of children (Fig. 1). The numbers of
CD8
1, CD16
1, CD20
1, and CD25
1cells were similar in all
four groups of children. The CD4/CD8 ratio was significantly
lower in children with SCS (median, 1.0; standard deviation
[SD], 0.4) and CS (median, 1.1; SD, 1.1) than in children with
US (median, 1.6; SD, 0.9) or NI (median, 1.8; SD, 1.0) (P
,
0.05 for all comparisons). The ratios were similar in children
with SCS and CS and children with US and NI. Children with
CS had more cells that were negative for CD3, CD16, or CD20
than children in the other three groups (P
,
0.05 for all
comparisons) (Fig. 1).
Comparison of paired samples between the day of
enroll-ment (day 0) and 3 to 5 days later (Table 2) showed that the
numbers of CD3
1and CD4
1cells increased in children with
SCS (P
5
0.017 and 0.025, respectively). Although the CD8
1cell numbers also increased, the difference was not statistically
significant. The phenotype was unchanged between the two
study periods in children with US and CS (Table 2). The
CD4/CD8 ratios were unchanged between the day of
enroll-ment and 3 to 5 days later in all four groups of children (data
not shown). There were not enough paired samples for
com-parison of CD16
1and CD3
2CD16
2CD20
2cells between the
two study periods in children with SCS and CS.
Spontaneous DNA synthesis.
DNA synthesis by
unstimu-lated PBMs of children with shigellosis, whether US, CS, or
SCS, upon enrollment was higher than that by PBMs of
chil-dren with NI (P
,
0.05) (Table 3). The level of proliferation
was higher in children with SCS and CS than in those with US
(P
,
0.05 for both comparisons), and the levels were similar in
children with SCS and CS.
Three to five days after enrollment (Table 2), spontaneous
DNA synthesis by PBMs in children with US and CS declined
significantly from the day of enrollment (P
5
0.001 and 0.011,
respectively). It remained unchanged in children with SCS.
Proliferation of PBMs in response to stimulants.
Upon
en-rollment, the levels of net proliferation of PBMs in response to
PHA and PWM were similar in all four groups of children
(Table 3). No stimulation with the LPS of S. dysenteriae 1 was
observed in any of the groups of children (data not shown).
Three to five days after enrollment, the PHA responses were
similar to that upon enrollment for all four groups of children
(Table 2). With PWM (Table 2), there was a decline in net
proliferation between the two study periods in children with
US (P
5
0.011); there were not enough paired samples for
comparison in children with CS or SCS.
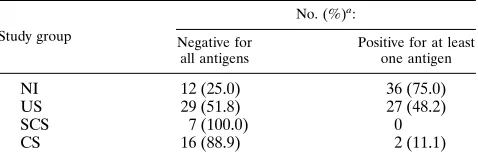
DTH responses.
Skin test results for DTH upon enrollment
were significantly lower in children with shigellosis (whether
US, CS, or SCS) than in those with NI (Table 4). Responses in
children with CS and SCS were diminished compared with the
responses of children with US (P
5
0.005 and 0.017,
respec-tively). However, children with CS and SCS had similar
re-sponses. Three to five days after enrollment, DTH responses
were unchanged in children with US and CS (data not shown).
There were not enough paired samples for comparison
be-tween the two study periods in children with SCS.
Effects of clinical parameters on lymphocyte phenotype and
function.
Multiple-regression analyses showed that PBM
phe-notype and function were not affected by sex, nutritional status,
concomitant infections, or duration of diarrhea before
enroll-ment.
TABLE 2. Alterations in lymphocyte phenotype and proliferation in paired samples from children with shigellosis a Study group Study day No. of cells positive for: Amt of DNA spontaneously synthesized, cpm Amt of proliferation bwith: CD3 CD4 CD8 CD16 CD20 CD3 2 CD16 2 CD20 2 PHA PWM US 0 c 3,777 6 1,709 2,673 6 1,293 1,604 6 1,062 691 6 557 1,013 6 993 1,439 6 1,139 2,394 6 3,739 30,931 6 20,785 9,166 6 18,727 3–5 d 3,691 6 1,732 (n 5 39; NS e) 2,520 6 1,444 (n 5 43; NS) 1,391 6 865 (n 5 43; NS) 571 6 488 (n 5 24; NS) 1,016 6 629 (n 5 40; NS) 549 6 926 (n 5 21; NS) 1,469 6 2,833 (n 5 53; P 5 0.001) 19,426 6 24,848 (n 5 45; NS) 7,217 6 7,441 (n 5 35; P 5 0.011) SCS 0 2,444 6 1,313 1,295 6 1,098 1,313 6 1,022 NE f 586 6 696 NE 12,714 6 5,972 27,734 6 51,580 NE 3–5 5,083 6 2,482 (n 5 8; P 5 0.017) 2,841 6 2,192 (n 5 8; P 5 0.025) 2,144 6 1,576 (n 5 8; NS) 1,342 6 449 (n 5 8; NS) 6,963 6 3,328 (n 5 6; NS) 62,776 6 36,418 (n 5 7; NS) CS 0 4,759 6 1,562 2,929 6 1,547 2,379 6 2,041 NE NE NE 12,096 6 671 48,340 6 46,984 NE 3–5 3,900 6 1,378 (n 5 9; NS) 2,699 6 1,872 (n 5 9; NS) 1,699 6 1,129 (n 5 9; NS) 3,648 6 4,970 (n 5 13; P 5 0.011) 23,226 6 46,456 (n 5 10; NS) aSamples taken on the day of enrollment were paired with samples taken 3 to 5 days later. The values are medians 6 SDs. bProliferation of PBMs; results are net counts per minute. cDay of enrollment. dThree to five days after enrollment. Wilcoxon matched-pair signed-rank test was used to determine the dif ferences in the results for the children. The dif ferences are in parentheses, after the numbers of children. eNS, not significant. fNE, not enough sample.on August 17, 2020 by guest
http://cvi.asm.org/
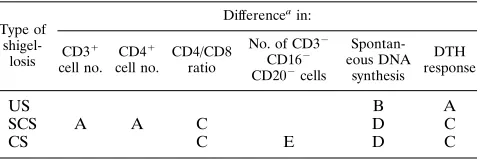
DISCUSSION
Several alterations in lymphocyte phenotype and function in
children with S. dysenteriae 1 infection were identified in this
study; these alterations are summarized in Table 5. Alterations
in children with SCS and CS can be seen as a continuum, but
those in children with US cannot, as those children do not
develop complications. Alterations seen in children with US—
increased spontaneous proliferation of resting cells and
de-creased DTH responses—are magnified in children with SCS
and CS. Additionally, in SCS, the numbers of CD3
1and CD4
1cells and the CD4/CD8 ratio are decreased, whereas in CS, CD4
1cell numbers are unchanged but the CD4/CD8 ratio is decreased
and the numbers of CD3
2CD16
2CD20
2cells are increased.
Thus, alterations in lymphocyte phenotype and function do occur
prior to the development of complications and a change in the
pattern of alterations occurs as children progress from SCS to CS.
The possible causes for these alterations are discussed below.
Lower numbers of CD3
1and CD4
1cells with lowering of
the CD4/CD8 ratio found in the circulation of children with
SCS could be due to (i) loss through the inflamed gut, (ii)
maturation block in the thymus (8), and (iii) migration to local
sites of inflammation. Shigellosis is a protein-losing
enteropa-thy in which stool RBCs have been shown to correlate with
stool
a
1 antitrypsin (an indicator of loss of protein from the
gut) (3). In children with SCS the numbers of stool RBCS and
stool WBCs and stool frequency (all indicators of gut
inflam-mation) were higher than in children with NI, and therefore it
is possible that lowered CD3
1and CD4
1cell numbers are due
to leakage through the inflamed mucosa. However, these
in-dicators of gut inflammation are also elevated in children with
US, but the numbers of CD3
1and CD4
1cells were not
low-ered in this group of children. Therefore, loss through the
inflamed mucosa is unlikely to be the only factor responsible
for the lowered cell numbers. The second possibility of
matu-ration block of T cells in the thymus appears to be unlikely, as
both CD3
1and CD4
1cell numbers increased significantly 3 to
5 days after enrollment in children with SCS; CD8
1cells also
increased in number, although the increase was not statistically
significant. In children with CS, the numbers of T cells and
their subsets were not decreased; however, the numbers of
CD3
2CD16
2CD20
2cells were increased. Jackson and
Za-man (8) also found increased numbers of cells which were E
negative and EAC negative, which they suggested was due to a
block in thymic maturation because upon addition of
thymo-poietin, the cells became E positive. However, this could also
be a stress response. The source of the CD3
2CD16
2CD20
2cells in our study is not clear. It is possible that these are
immature or stem cells which have poured out into the
circu-lation as overall lymphocyte numbers increased. The third
pos-sibility of migration to local sites, i.e., to the gut, therefore
remains the most likely explanation, and similar migration has
been shown to occur in acute appendicitis (16). However, it is
unclear why a selective migration of CD3
1and CD4
1cells
should take place, although this has also been shown to occur
in other conditions such as appendicitis (16) and intestinal
lymphangiectasia (20). Further analyses of subsets of CD4
1cells (naive and memory cells) would shed more light on the
nature of cells that are lost from the circulation, by either
leakage through the gut or migration to local sites.
This study also shows that a decreased CD4/CD8 ratio may
differentiate children with SCS from those with US.
Alter-ations in CD4/CD8 ratios reflect changes in either or both of
the CD4 and CD8 T-cell subsets. In children with SCS,
creased CD4/CD8 ratios on enrollment are due to the
de-creased number of CD4
1cells in the circulation. Three to five
days after enrollment, i.e., once complications develop, the
CD4/CD8 ratio was still lower despite an increased CD4
1cell
number. However, there was also a rise in the CD8
1cell
number, although that was not statistically significant.
Simi-larly, the lower CD4/CD8 ratio in children with CS could be
due to greater numbers of CD8
1cells (Fig. 1), although the
difference in numbers compared with those in other groups of
children was not statistically significant.
Increased spontaneous DNA synthesis reflects an increased
state of activation of circulating cells in vivo and also occurs in
other infections (1). Children with SCS and CS had more
preactivated PBMs than those with US. In vivo activation may
be due to circulating bacterial components, such as LPS, or
products of infection, such as cytokines. Children with HUS
associated with S. dysenteriae 1 infection have higher
concen-trations of endotoxin in serum than children with US (11).
Although the LPS of S. dysenteriae 1 did not induce
prolifera-tion of PBMs in this study, an earlier study showed modest
proliferation by the lipid-free O-antigenic polysaccharide of S.
dysenteriae 1 (14). In adults with US, the levels of both Th1 and
Th2 cytokines are elevated (15), and in children with CS,
con-centrations of interleukin 6 and tumor necrosis factor alpha in
serum are higher than in those with US (7). It is possible that
with complications, the levels of other cytokines, causing
T-and B-cell activation, are also elevated.
TABLE 3. Proliferation of PBMs spontaneously and in response to stimulants upon enrollmenta
Study group Amt of DNA spontaneously synthesized, cpm
Net cpm of DNA synthesized in response to:
PHA (1.25mg/ml) PWM (10mg/ml)
NI 7766885 (n551) 21,260621,086 (n541) 4,54869,885 (n531)
US 2,71063,804 (n565) 30,862622,820 (n562) 7,992616,106 (n551)
SCS 12,714620,351 (n512) 25,635646,498 (n510) 12,207613,135 (n510)
CS 8,69467,824 (n529; P,0.001) 33,604637,879 (n528; NS) 10,071611,980 (n519; NSb)
aValues are medians6SDs. The Kruskal-Wallis test was used to determine the differences in results for the four groups of children; the differences are at the bottom of each column.
bNS, not significant.
TABLE 4. DTH responses upon enrollment
Study group
No. (%)a:
Negative for all antigens
Positive for at least one antigen
NI 12 (25.0) 36 (75.0)
US 29 (51.8) 27 (48.2)
SCS 7 (100.0) 0
CS 16 (88.9) 2 (11.1)
a
P values obtained by using the chi-square statistic: for children with NI and US, 0.006; for children with US and CS, 0.005; for children with US and SCS, 0.017; and for children with CS and SCS, not significant.
on August 17, 2020 by guest
http://cvi.asm.org/
Lowered DTH responses were observed in all groups of
children but were more marked in children with shigellosis.
Uninfected children were nutritionally similar to children with
shigellosis i.e., they were malnourished, which may be the
reason for the anergy observed. In children with shigellosis
(US, SCS, or CS), lowered DTH responses paralleled
in-creased resting DNA synthesis by PBMs. The in vivo
preacti-vated state of lymphocytes may be a reason for lowered DTH
responses in those children.
In summary, alterations in PBM phenotype and function
prior to the development of leukemoid reactions and HUS are
identifiable in children with S. dysenteriae 1 infection. These
alterations may have a role in precipitating complications, or
they may reflect events that are already underway in the
de-velopment of complications.
ACKNOWLEDGMENTS
This research was supported by United States Agency for Internation-al Development under grant DPE-5986-A-1009-00 and the ICDDR,B. The ICDDR,B is supported by the aid agencies of the governments of Australia, Bangladesh, Belgium, Canada, China, Denmark, Germany, Japan, The Netherlands, Norway, the Republic of Korea, Saudi Ara-bia, Sri Lanka, Sweden, Switzerland, Thailand, the United Kingdom, and the United States; international organizations, including the Arab Gulf Fund, Asian Development Bank, European Union, the United Nations Children’s Fund, the United Nations Development Pro-gramme, the United Nations Population Fund, and the World Health Organization; private foundations, including the Aga Khan Founda-tion, Child Health FoundaFounda-tion, Ford FoundaFounda-tion, Population Council, Rockefeller Foundation, and Sasakawa Foundation; and private orga-nizations, including American Express Bank, Bayer AG, CARE, Fam-ily Health International, Helen Keller International, Johns Hopkins University, Macro International, New England Medical Centre, Proc-ter Gamble, RAND Corporation, SANDOZ, the Swiss Red Cross, the University of Alabama at Birmingham, the University of Iowa, and others. We thank Manzurul Haque for secretarial assistance and Soma De for help with data entry.
REFERENCES
1. Arneborn, P., and G. Biberfeld. 1983. T-lymphocyte subpopulations in rela-tion to immunosuppression in measles and varicella. Infect. Immun. 39:29–37.
2. Baskin, D. H., J. D. Lax, and D. Barenberg. 1987. Shigella bacteremia in patients with the acquired immune deficiency syndrome. Am. J. Gastroen-terol. 82:338–341.
3. Bennish, M. L., M. A. Salam, and M. A. Wahed. 1993. Enteric protein loss during shigellosis. Am. J. Gastroenterol. 88:53–54.
4. Butler, T., M. R. Islam, and P. K. Bardhan. 1984. The leukemoid reaction in shigellosis. Am. J. Dis. Child. 138:162–165.
5. Cohen, D., M. S. Green, C. Block, R. Slepon, and Y. Lerman. 1992. Natural immunity to shigellosis in two groups with different previous risks of expo-sure to Shigella is only partly expressed by serum antibodies to lipopolysac-charide. J. Infect. Dis. 165:785–787.
6. Cohen, D., M. S. Green, C. Block, R. Slepon, and I. Ofek. 1991. Prospective study of the association between serum antibodies to lipopolysaccharide O antigen and the attack rate of shigellosis. J. Clin. Microbiol. 29:386–389. 7. De Silva, D. G. H., L. N. Mendis, N. Sheron, G. J. Alexander, D. C. A. Candy,
H. Chart, and B. Rowe.1993. Concentrations of interleukin 6 and tumour necrosis factor in serum and stools of children with Shigella dysenteriae 1 infection. Gut 34:194–198.
8. Jackson, T. M., and S. N. Zaman. 1979. Enhanced T-cell rosette formation in shigellosis by the in vitro use of thymopoietin. Trans. R. Soc. Trop. Med. Hyg. 73:677–679.
9. Jackson, T. M., S. N. Zaman, and A. M. Khan. 1979. Subpopulations of peripheral lymphocytes from patients with Shigella bacillary dysentery with associated leucocytosis. Trans. R. Soc. Trop. Med. Hyg. 73:656–660. 10. KristJa´nsson, M., B. Viner, and J. N. Maslow.1994. Polymicrobial and
recurrent bacteremia with Shigella in a patient with AIDS. Scand. J. Infect. Dis. 26:411–416.
11. Marchant, A., M. L. Bennish, M. A. Salam, W. A. Khan, A. M. Khan, M. J.
Struelens, J. Griffiths, and G. T. Keusch.1991. Endotoxemia during shigel-losis: relationship in hemolytic-uremic syndrome (HUS) and leukemoid re-action, abstr. 11, p. 100. In Program and Abstracts of the 31st Interscience Conference on Antimicrobial Agents and Chemotherapy. American Society for Microbiology, Washington, D.C.
12. Rahman, M. M., A. K. M. J. Alam, M. R. Islam, W. B. Greenough III, and
J. Lindenbaum.1975. Shiga bacillus dysentery associated with marked leu-kocytosis and erythrocyte fragmentation. Johns Hopkins Med. J. 136:65– 70.
13. Raqib, R., F. Reinholt, P. K. Bardhan, A. Karnell, and A. A. Lindberg. 1994. Immunopathological patterns in the colonic mucosa of patients with shigel-losis: expression of HLA-DR antigens and T-lymphocyte subsets. APMIS
120:13–24.
14. Raqib, R., S. Tzipori, M. Islam, and A. A. Lindberg. 1993. Immune responses to Shigella dysenteriae 1 and Shigella flexneri lipopolysaccharide and polysac-charide antigens in Bangladeshi patients with shigellosis. Serodiagn. Immu-nother. Infect. Dis. 1:37–45.
15. Raqib, R., B. Wretlind, J. Andersson, and A. A. Lindberg. 1995. Cytokine secretion in acute shigellosis is correlated to disease activity and directed more to stool than to plasma. J. Infect. Dis. 171:376–384.
16. Soo, K. S., C. A. Michie, S. R. Baker, J. H. Wyllie, and P. C. L. Beverley. 1995. Selective recruitment of lymphocyte subsets to the inflamed appendix. Clin. Exp. Immunol. 100:133–138.
17. Walters, M. D. S., I. U. Matthei, R. Kay, M. J. Dillon, and T. M. Barratt. 1989. The polymorphonuclear leucocyte count in childhood hemolytic ure-mic syndrome. Pediatr. Nephrol. 3:130–134.
18. Westphal, O., and K. Jann. 1965. Bacterial LPS: extraction with phenol water and further applications of the procedures. Methods Carbohydr. Chem. 5:83–91.
19. World Health Organization. 1987. Manual for laboratory investigations of acute enteric infections, p. 9–20. World Health Organization, Geneva. 20. Yamamoto, H., T. Tsutsui, M. Mayumi, and S. Kasakura. 1989.
Immuno-deficiency associated with selective loss of helper/inducer T cells and hypo-gammaglobulinemia in a child with intestinal lymphangiectasia. Clin. Exp. Immunol. 75:196–200.
21. Zwillich, S. H., A. D. Duby, and P. E. Lipsky. 1989. T-lymphocyte clones responsive to Shigella flexneri. J. Clin. Microbiol. 27:417–421.
TABLE 5. Summary of alterations in lymphocyte phenotype and function in children with shigellosis upon enrollment
Type of
shigel-losis
Differenceain:
CD31 cell no.
CD41 cell no.
CD4/CD8 ratio
No. of CD32 CD162 CD202cells
Spontan-eous DNA
synthesis DTH response
US B A
SCS A A C D C
CS C E D C
aA and B, significant decrease and increase, respectively, compared with result for children with NI. C and D, significant decrease and increase, respectively, compared with result for children with US or NI; E, significant increase com-pared with result for children with SCS or US.