© 2016, IJCSMC All Rights Reserved 140 Available Online at www.ijcsmc.com
International Journal of Computer Science and Mobile Computing
A Monthly Journal of Computer Science and Information Technology
ISSN 2320–088X
IMPACT FACTOR: 5.258
IJCSMC, Vol. 5, Issue. 9, September 2016, pg.140 – 149
Scientometric Analysis: International
Journal of Skin Therapy Letter
Priya Ashok Suradkar
Research Student, Dr. Babasaheb Ambedkar Marathwada University, Aurangabad E-Mail: [email protected]
Abstract: The study presents the trends in scientometric analysis: international journal of skin therapy letter with a sample of 416 articles during the period 2010--2014. Co-authored highest articles, Findings of the analysis revealed that the majority of the publications are contributed by multiple authors; Canada is highest contributed articles.
Keywords: Scientometric Analysis, Scientometric, Bibliometric, citation analysis, skin therapy latter.
I. Introduction
© 2016, IJCSMC All Rights Reserved 141
nascent discipline of scientometrics include: (1970), Nalimov and Mulchnko (1969 a) and Nalimov et al. (1971).
Application of mathematical and statistical methods of scientific literature (Derek De Solla, 2000); this enables to evaluate the size of scientific production on the assumption that the essence of scientific activity is the assumption the production of knowledge (Garfield, 2000).
The paper consists of five main parts: introduction, literature review, research design, results and discussions, and conclusions.
II. Definition
A. Bibliometrics
The terms bibliometrics consist of two words namely ‘Biblio’ and ‘Metrics’, biblio means book and metrics means simply measurement.
Bibliometric is the quantitative treatment of the properties of recorded as bibliometric is the study of use of document and pattern of publication in which mathematical and statistical method have been applied (Fair Thom, 1970).
B. Scientometrics:-
A complex of quantitative mathematical and statistical methods used to investigate such aspects as research staff, and to define evolutionary & prospectus of science (Bonitz, 1999). Scientometrics is a very recent term .It is often used synonymously with the term bibliometrics.
C. Scientometric analysis:-
The main currency for an academician is his reputation just as that for the politician is the politician is the power the commands and that for the business person is the wealth he has accumulated (Becher, 1989).
D. E- Journals :-
According to, a journal , academic in nature which is published using the world wide web, such a journal usually uses internet technology refereeing of papers. Many e- journals pride themselves on rapid refereeing and consequent repaid publication. ( Gupta, 1998)
E. Skin Therapy letter:-
© 2016, IJCSMC All Rights Reserved 142
III. Review of Literature
Scientometric is complex of quantitative method which is used to investigate the process of science. According to Kademani and et al. (2005) the key scientometric concepts include: if scientist is renowned personality in this field these specializations will naturally attracts more number of collaborators. Mahapatra and Kaul (1992); Singh (2007); Balasubramanian and Bhaskar, (1984); Kogamuramath, (2001); Kumar, (1984); James, (2008), Deshpande (1997); indicates that the use of analysis of chronological distribution show that older documents are less cited than newer ones. Haridasan, (2007), indicated that the citing half life (median citation age) shows how for back in time one must go to account for the age one half of the bibliographic references published in a journal in a particular year.
Le Minor, (1991), complied an inventory a list of article that subservient to the appearance of the original article refers to as cite article this method has been used expensively in the legal profession and is particularly applicable to scientific literature. Wilson, (2001) analyzed. It is useful to establish a list of journals mostly cited by the author. Ojedokun and Owolabi, (2003); indicates that the year wise distributions of citation use an idea about scattering and. expansion of the subject or discipline. Marklein (1997) carried out a study in the specific period how many book and periodicals are articles or articles are distributed in a specific period. Lehnus (1973); analyzed Authors enrich a subject by their contributions citation analysis studies identify the familiar and prominent in the field. Brace (1999); indicates that the highly cited journals are listed as ‘core journals’ of a specific subject. The core journals are considered as ‘central set of journals, which most clearly reflects the conceptual essence of the research being reported in the discipline. Mahapatra (1985); carried out study in Further, if the number of articles in a subject doubles during a given period then the difference between the logarithms of numbers at the beginning and at the end of this period must be the logarithm of the number 2.
IV. Objectives of the Studies
The main objective of the present studies is
1. To find out distribution of contributions volume wise 2. To examine the authorship pattern of the contribution 3. Find out the contributions institutions wise.
4. To indicate volume-wise geographical distribution of contribution 5. To find out the type of publication cited volume wise
© 2016, IJCSMC All Rights Reserved 143
V. Analysis and Result
The present study is based on 5 volumes, 28 issued of the E- journal Skin Therapy letter during 2010-2014. The present study is based on overall 2570 citations appended to 418 articles.
1. Distribution of contributions (volume wise) .
The distribution of contributions is shown in table No.1 Table No.1
Distribution of Contributions
Year Vol .No No. of Issue No. of Contributions Percentage
2010 18 6 94 22.43%
2011 19 6 85 20.28%
2012 20 6 96 22.91%
2013 21 6 66 15.75%
2014 22 4 78 18.6%
Total 28 419 100
Fig No. 1Distribution of Contributions
Table No.1 and Figure No.1 the distribution of contribution volume- wise, table no.1 depicts that out of 419 contributions, 94 (22.43%) contributions were contributed in 2010, 85 (20.28%) of them were contributed in 2011, however 96 (22.91%) of them were published in the year 2012, and 66 (15.75%) of them were published in the year 2013, and the rest of 78 (18.6%) contribution were contributed in the year 2014. It is inferred from the table no.1 of distribution of contributions from 2010-2014 that the level of the percentage of distribution has decreased. A notable attribute of the study is that the year 2012. Shows the maximum number of contributions.
0 20 40 60 80 100
2010 2011 2012 2013 2014
94 85 96
© 2016, IJCSMC All Rights Reserved 144
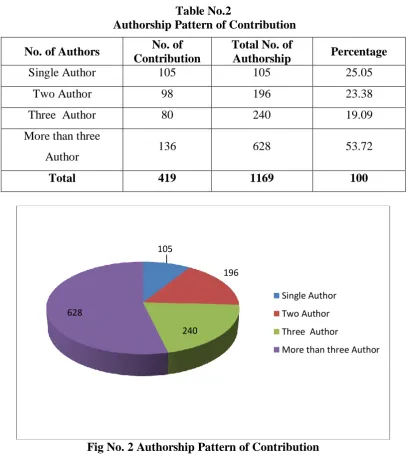
2. Authorship Pattern of Contribution
Table No.2
Authorship Pattern of Contribution
No. of Authors No. of Contribution
Total No. of
Authorship Percentage
Single Author 105 105 25.05
Two Author 98 196 23.38
Three Author 80 240 19.09
More than three
Author 136 628 53.72
Total 419 1169 100
Fig No. 2 Authorship Pattern of Contribution
Table No.2 Fig No 2, displays the authorship pattern of contributions out of total 419 contributions, single author has contributed 105(25.05%) percent of the total articles.98(23.38%) percent of the contributions were published with two author articles, a three author has contributed 80(19.09%) percent of the total articles, 136(53.72%) percent of the contributions were published with more than three authors. A significant note of the study is that the majority of the articles are contributed by co- author.
3. Contribution ( Institution –wise)
Contribution is displayed in the table no.3. 105
196
240 628
Single Author
Two Author
Three Author
© 2016, IJCSMC All Rights Reserved 145
Table No.3
Institution wise contribution
Vol. No. Year University Institution College Not
Mention Total
18 2010 89 90 81 41 301
19 2011 75 66 56 35 232
20 2012 69 53 61 29 218
21 2013 55 50 42 33 176
22 2014 90 69 50 22 242
Total 378 328 290 173 1169
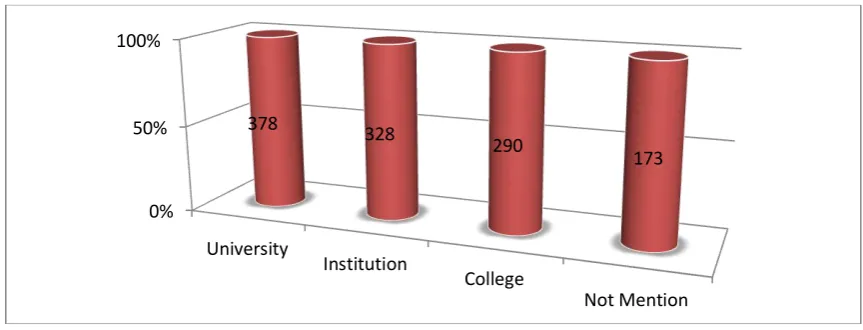
Table No.3 depicts the geographical distribution of contributions, University wise at the national level followed by institutions and colleges. It is inferred from the above table that university – wise contribution maximum is no is 231 contribution were 228 contribution and Institution contribution was 184 contribution.
4. Geographical distribution of contributions in International level
The geographical distribution of contribution International level is show in Table No.4. Table No.4
Geographical distribution of contribution in International level
Sr. No Name of Country No. of Contribution Percentage
1 USA 80 19.09
2 UK 76 18.13
3 Japan 42 10.02
0% 50% 100%
University
Institution
College
Not Mention
378 328
290
© 2016, IJCSMC All Rights Reserved 146
4 Canada 128 30.54
5 Spain 27 6.44
6 China 8 1.90
7 Russia 5 1.19
8 India 13 3.10
9 Newzealand 1 0.23
10 Quarter 2 0.48
11 Norwey 4 0.95
12 Pakistan 2 0.48
13 Malaysia 3 0.71
14 South Africa 1 0.23
15 Kenya 2 0.48
16 Korea 2 0.48
17 Zambia 1 0.23
18 Not mentioned 22 5.25
Table No.4 shows the Geographical distribution of Contributions At international level. Table No.4 indicates that the majority of the Contributions where contributed by Canada 128(30.54%) were as the minimum number of contribution.
5. Types of publications cited (volume wise)
The types of publication cited volume –wise is displayed in the table no.5 Table No.5
Type of publication cited (Volume –wise)
Vol. No. Books Journals Others Total
18 161 205 96 462
19 254 336 125 715
20 193 246 121 560
21 121 251 96 468
22 98 176 91 365
Total 827 1214 529 2570
© 2016, IJCSMC All Rights Reserved 147
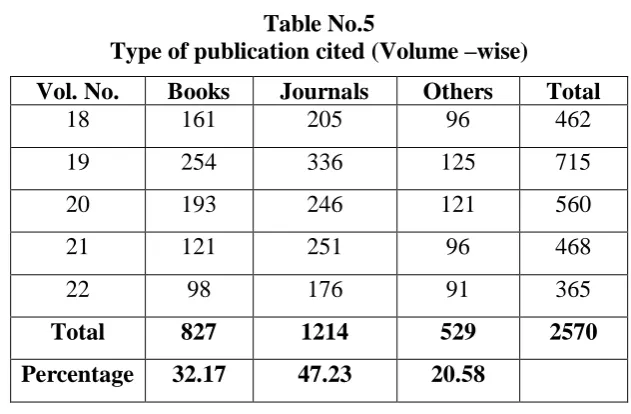
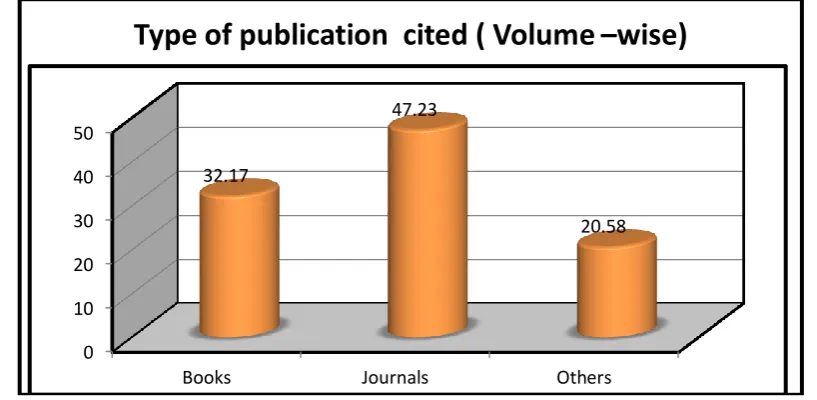
Table No.5 displays that twenty eight issue of five volumes of the electronic journals contained 2570 citations, Based on analysis it was found that Health science profession all journals articles is followed by 1214 (47.23%). This is due to the fact that journals are the premier vehicle of nascent information dissemination. This is followed by books 529 (20.58%) citation. The remaining 529 (20.58%) citations are from other sources, which include conference proceeding theses and dissertations personal notes etc.
6. Average Citation per contribution in each volume
The average citation per contribution in each volume in showed table no.6 Table No.6
Average Citation per contribution in each volume
Year No. of Contribution No. of Citation Average
2010 94 462 4.91%
2011 85 715 8.41%
2012 96 560 5.83%
2013 66 468 7.09%
2014 78 365 4.67%
Total 419 2570 6.13%
0 10 20 30 40 50
Books Journals Others
32.17
47.23
© 2016, IJCSMC All Rights Reserved 148
It can be observed for average citation per contribution in each Year. 2010. (8.91%) contributed 85 contributions of which highest numbers of citation appeared in Year. 2014 78(4.67%) contribution of which minimum number of citation appeared in Year 2014.
VI. Conclusion
1. The number of articles published is highest in the year 2012 with 96 articles.
2. A significant note of the study is that the majority of the articles are contributed by authors.
3. It is referred from the above that university contributions maximum in number is 378 contributions. 4. The majority of the Contributions where contributed by Canada 128(30.54%) were as the minimum
number of contribution.
5. The number of highest in journals articles is followed by 1214 (47.23%).
6. 78(4.67%) contribution of which minimum number of citation appeared in Year 2014
References
[1]. A. Andres, (2009). Measuring academic research: how to undertake a bibliometric study. Library science. (pp.17).
Cambridge: chandos publishing.
[2]. Arora, jagdish. And pawan, usha. (1995). Collaborative research and authorship patterns in immunology: correlation
between multiple authorship and citedness. Iaslic bulletin, 40 (2), 73-85.
[3]. Cronin, Blaise. Shaw, Debora And Barre, Kathryn La. (2003). A cast of thousands: coauthorship and subauthorship
collaboration in the 20th century as manifested in the scholarly journal literature of psychology and philosophy, jasist, 54
(9):855–871.
[4]. A. Davarpanah, and M. R. S. Aslekia, (2008). Scientometric analysis of international lis journals: productivity &
characteristics. Scientometrics, 77 (1), 21-39.
[5]. Farahat, Hashem. (2002). Authorship patterns in agricultural sciences in egypt. Scientometrics, 55 (2), 157-170.
[6]. B. M. Gupta, and S. M. Dhawan, (2003). India’s collaboration with people’s republic of china in science and technology: a
scientometric analysis of coauthored papers during 1994-1999. Scientometrics, 57 (1), 59-74.
4.91%
8.41% 5.83%
7.09%
4.67%
© 2016, IJCSMC All Rights Reserved 149
[7]. Lee, Jin Ha., Jones, M. Cameron. and Downie, J. Stephen. (2009). An analysis of ismir proceedings: patterns of authorship.
Topic, and citation. Presented at 10th international society for music information retrieval conference 2009.
[8]. O’neill, G patrick. (1998). Authorship patterns in theory based versus research based journals. scientometrics,
41 (3), 291-298.
[9]. D.T. Kalbande, (2013). Collection of Prof. S Seetharama Information Centre: A Bibliometric Study. In: e-Library Science
Research Journal, Vol. 1 No 3. (Jan, 2013). Pp. 1-8. ISSN No: 2319-8435.
[10]. Santosh M Shelke, Kalbande,D.T & Khaparde,V.S. (2013). Online Information Review Journal of Information Science: A Scientometric Study. In: International Journal of Emerging Trends in Library and Information Society, Vol. 1 No 2. Pp. 113-124. ISSN No: 2320-5040.
[11]. K. Pillai, and G. Sudhier. (2007). Authorship patterns in physics literature: an informetric study on citations in doctoral
theses of the indian institute of science. Annals of library and information studies, 54, 90-94.