ISOZYME POLYMORPHISMS IN DROSOPHZLA ANANASSAE:
GENETIC DIVERSITY AMONG ISLAND POPULATIONS IN THE SOUTH PACIFIC1
F. M. JOHNSON
Department of Genetics, North Carolina State Uniuersity, Raleigh, North Carolina 27607 Received January 29, 1971
URING the past five years numerous collections of
D.
ananassae were made Dfrom various islands in the South Pacific and the flies were analyzed for the presence of enzyme polymorphisms. Preliminary results of this work have been published (JOHNSON et al., 1966; STONE et aZ., 1968; STONE, KOJIMA and JOHN- SON 1969; JOHNSON, KOJIMA and WHEELER 1969), but the most extensive data have nDt. The present paper is an integration of published data and results not previously reported. The total now permits a comprehensive description and comparison of the levels of genic polymorphism that exist within and among island populations ofD.
ananassae. The picture that emerges may be typical for specie; comprised of numerous isolated to semi-isolated populations in diverse environments.MATERIALS A N D M E T H O D S
D. ananassae Doleschall is found mainly in the tropic and subtropic regions of the world where it is frequently the most abundant Drosophila species (STONE et al. 1957). The species exists as geographically separated populations among which differences i n pigmentation, chromo- somal inversion frequencies (FUTCH 1966), and mating behavior (SPIETH 1966) are known.
D. ananassae is found in association with fruits and vegetables and may gain passage in the
shipping of produce. Thus, in spite of the differences among populations, some interbreeding is likely. At least one reproductively isolated ananassae-like form (an undescribed species) has evolved that now coexists with D. anamssae in a few localities (FUTCH 1966). Ananassae-like flies are recognizable by color differences and cytological irregularities, and in the present study care was taken not to include these in the analysis. Both morphological and cytological examina- tions were performed on most of the collections to insure proper identification.
Collection localities included sites in Samoa, Fiji, Hawaii, Ponape, Yap, Palau, Guam, Majuro Atoll, and the Philippines. Collection numbers, localities, and dates are given in the tables of data which follow. Flies were generally obtained by sweeping over fallen fermenting fruit, and numerous investigators were involved in the labor. More detailed information regarding the collections may be obtained from earlier papers and from the collection records of the University of Texas Genetics Foundation, Austin, Texas.
Electrophoretic analysis was performed on wild-caught flies and on offspring from wild females that were isolated after capture. Methods have been published, e.g., JOHNSON et d.
(1969). Genetic variation i n seven different enzymes was analyzed-an esterase (EST-C), a peptidase (LAP), a n acid phosphatase (ACPH), an alkaline phosphatase (APH), an alcohol
lThis research was supported in part by USPHS research grants GM 11609, GM 15769, and GM 11546 and contract number AT-(40-1)-3980 with the United States Atomic Energy Commission. Paper number 3472 of the Journal Series of the North Carolina Experiment Station, Rale.gh, North Carolina.
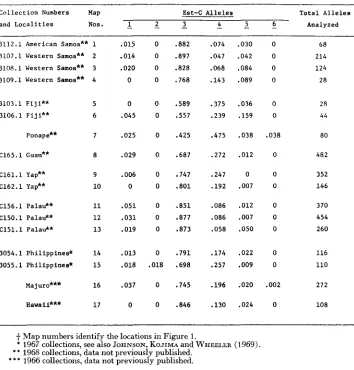
78 F. M. J O H N S O N TABLE 1
Frequencies of Est-C alleles in collectiod from island populations of Drosophila ananassae
Collection Numbers Map Est-C Alleles Total Alleles
and Localities Nos.
-
1 -2 . -3 - 4 -5 -6 Analyzed3112.1 American Samoa** 1 3107.1 Western Samoa** 3108.1 Western Samoa**
3109.1 Western Samoa**
3103.1 Fiji** 3106.1 Fiji**
Ponape**
C165.1 Guam**
C161.1 Yap** C162.1 Yap**
C156.1 Palau** C150.1 Palau** C151.1 Palau**
3054.1 Philippines* 3055.1 Philippinesf
Majuro*** Hawaii*** 2 3 4 5 6 7 8 9 10 11 12 13 14 15 16 17 ,015 .014 .020 0 0 .045 .025 .029 .006 0 .051 .031 .019 .013
. O M
.037 0 0 0 0 0 0 0 0 0 0 0 0 0 0 0 .018 0 0 .882 .897
. 8 2 8
.768 .589 .557 .425 .687 ,747 .a01 .a51 .a77 .873 .791 .698 .745 .a46 .074 .047 .068 .143 .375 .239 .475 .272 .247 .192 .086 .086 .058 .174 .257 .196 .130 .030 .042 ,084 .089 ,036 .159 .038 .012 0 .007 .012 .007 .os0 .022 .009 .020 .024
0 68
0 214
0 124
0 28
0 2 A
0 44
.038 80
0 482
0 352
0 146
0 370
0 454
0 260
0 116
0 110
.002 272
0 108
t
Map numbers identify the locations in Figure 1.* 1967 collections, see also JOHNSON, KOJIMA and WHEELER (1969). * * 1968 collections, data not previously published.
* * * 1966 collections, data not previously published.
dehydrogenase (ADH), an octanol dehydrogenase (ODH), and an "-dependent malate dehydrogenase (MDH-D). The loci controlling the variability are named according to the activity of the enzymes, i.e., Est-C, Lap, Acph, Aph, Adh, Odh, and Mdh-D, respectively. The observed electrophoretic patterns and previous inheritance studies indicate that the variation is
controlled by multiple alleles a t autosomal structural loci. The enzymes and the controlling alleles are numerically designated according to electrophoretic mobility, e.g., Est-CI, Est-CP, Est-C3, etc. control in decreasing order of mobility, respectively, the allelic esterases. Allelic frequencies given in the tables are based on the total alleles in a given sample. For wild-caught flies, the total alleles is twice the number of individuals analyzed. Where the flies analyzed were obtained from isolated-female lines, the total alleles is four times the number of lines, even though for most collections more than four flies per line were examined.
RESULTS
POLYMORPHISMS I N ISLAND DROSOPHILA 79
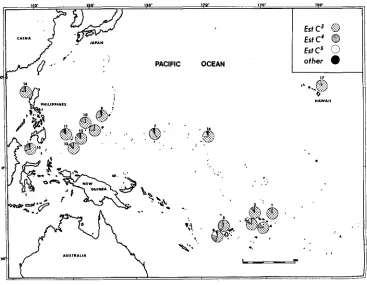
most populations. Frequencies of occurrence of the various allelic forms in the populations sampled comprise the main raw data. Past investigation has revealed that the ratios of isozyme phenotypes (genotypes) agree closely with Hardy- Weinberg expectation for those enzymes that can be examined in the wild-caught adults (JOHNSON, KOJIMA and WHEELER 1969), and additional unpublished analyses have been consistent. Tables 1 and 2 list the frequencies of Est-C and Acph alleles, and Figures 1 and 2 show these data pictorially. More population samples were analyzed for these two loci than the others. Time was not available to analyze every sample for all possible enzyme loci; Est-C and Acph were tech- nically the simplest, the most economical, and gave particularly good electro- phoretic patterns. At both the Est-C and Acph loci there are two alleles of gener- ally high frequency (major alleles) that occur in all population samples (Est-C3 and Est-C4; and Acph2 and Acph3). Inspection of the tables and figures reveals considerable variation in the frequencies of these alleles, but the variation is not random. Uniformity in allelic frequencies typically occurs among localities that are geogiaphically near one another, i.e., collections from one island or a group of nearby islands tend not to vary as much as those from more distant islands. The following are all similar among themselves in allelic frequencies: the
110' 110' 170. 170.
C Y l N A
PACIFIC OCEAN
.
. . .-
EstC3
0
Est
c'
EstC'c>
other. . . . .
I ' I
; .. ,
-
I.80 F. M. J O H N S O N
PACIFIC OCEAN
Acph*
0
Acph'
0
other
0
"
.
;.. .
: 4 ,
.
.,
*.
-
MAWAll
. ..
.
..
I '
'
-
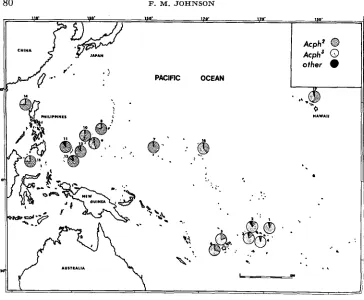
'*FIGURE 2.-Map of the Pacific shaving the locations from which D. ammssae were collected and analyzed for Acph, and the frequencies of Acph alleles determined for each of these collections.
Samoan Islands, represented by four collections (from three different islands) ; the Palau Islands, represented by three collections (from three different islands) ; and the Philippine Islands, represented by two collections (from two different islands). Fiji and Yap are each represented by two collections (from one island) and both show similarity within islands.
Wide variation in allelic frequencies occurs, however, among localities that are outside of close proximity with one another and without connecting land or closely spaced islands. For example, the Samoan and Fijian Islands are separated by only a few hundred miles of open water, but they are very different in regard to frequencies of Est-C alleles. On the other hand, the two localities in the Philip- pines are separated by approximately the same distance (but much land and numerous islands lie between them), and allelic frequencies tend to be similar. Some very distant and isolated localities, though, also show similarity (Est-C in Palau and Samoa for instance), but these appear to be chance agreements in a background of diversity. In general, the single collections from isolated points (Ponape, Guam, Majuro, and Hawaii) show frequencies that are without obvi- ous relationship to distance of separation.
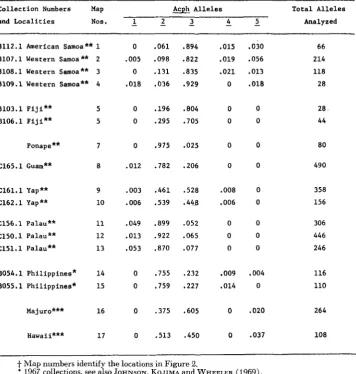
POLYMORPHISMS I N ISLAND DROSOPHILA
TABLE 2
Frequencies of Acph alleles in collectio4 from island populations of D. ananassae 81
Collection Numbers Map 3 Alleles Total Alleles
and Localities Nos. - 1 -2 -3 - 4 -5 Analyzed
3112.1 American Samoa** 1 3107.1 Western Samoa** 2 3108.1 Western Samoa** 3 3109.1 Western Samoa** 4
3103.1 Fiji** 3106.1 Fiji**
Ponape**
C165.1 Guam**
C161.1 Yap** C162.1 Yap**
C156.1 Palau** C150.1 Palau** C151.1 Palau**
3054.1 Philippines* 3055.1 Philippines"
Majuro*** Hawaii*** 5 5 7 8 9 10 11 12 13 14 15 16 17
0 ,061 ,894 .005 .098 .822
0 .131 .835 .018 .036 .929
0 ,196 .804 0 .295 .705
0 .975 .025
.012 .782 .206
.003 .461 .528 .006 .539 .443
.049 .899 .052 .013 .922 .065 .053 .870 .077
0 .755 .232 0 ,759 .227
0 .375 .605
0 .513 .450
.015 .019 .021 0 0 0 0 0 .008 .006 0 0 0 .009 .014 0 0 .030 .056 .013 .018 0 0 0 0 0 0 0 0 0 .004 0
* 020
.037 66 214 118 28 28 44 80 490 358 156 306 446 246 116 110 264 108
t
Map numbers identify the locations in Figure 2.* 1967 collections, see also JOHNSON, KOJIMA and WHEELER (1969). * * 196s collections, data not previously published.
* * * 1966 collections, data not previously published.
ability that occurs for the Est-C alleles. That is, collection localities from the same island or island group show similar allelic frequencies; but among islands that are more distant and isolated, there are numerous, apparently random, frequency differences. The amount of variation among some of the distant localities is quite different from that observed for Est-C. For example, the Samoan and Palau Is- lands are alike for Est-C allele frequencies but different in regard to frequencies of Acph alleles.
a2 F. M. J O H N S O N
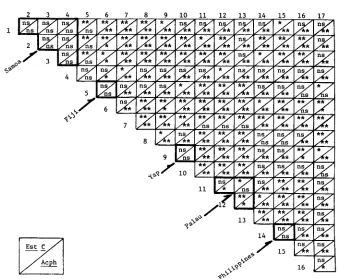
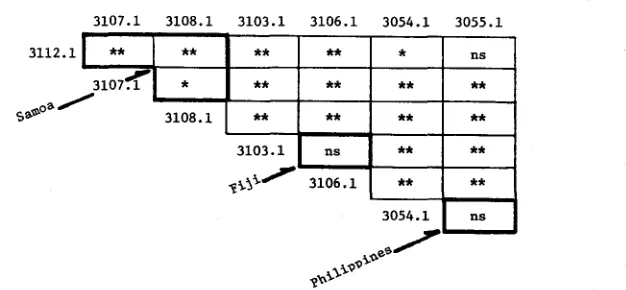
FIGURE 3.-Results of chi-square tests performed on numbers of alleles observed in the different allelic classes for the Est-C and Acph loci in the various localities sampled. Each locality is compared with every other locality, individually. Within-island and island group comparisons (Samoa, Fiji, Yap, Palau, and the Philippines) are denoted by the heavy outline. The numbers identify the collection localities by Map Number, cf. Figures 1 and 2. (n.s. = P
>
0.05. * = 0.05>
P>
0.01. ** = P<
0.01.)alleles (for each different class of allele) that were observed for each collection. The results of these tests for the Est-C and Acph alleles are summarized in Figure 3, and they verify what was suggested by inspection of the tables. Within islands and island groups, there are few statistically significant differences; while between more distant localities, there are many. For the Est-C alleles within Samoa, Fiji, Yap, Palau, and the Philippines, only two out of 12 chi-square tests were found to be significant; and also for the Acph alleles within the same islands, only two were significant. Chi-square comparisons involving more distant localities were found to be quite the opposite: for the Est-C alleles, 76 out of 124 tests were found to be significant; and for the Acph alleles, 11 1 out of 124 comparisons showed significant differences. The distribution of significant us.
P O L Y M O R P H I S M S I N ISLAND D R O S O P H I L A
TABLE 3
83
Frequencies of Lap alleles in collections+ from island populations of D. ananassae
Collection Numbers Map Alleles Total Alleles
and Localities Nos.
-
2 - 4 -6 - 8 Analyzed3112.1 American Samoa** 1 .073 ,884 .012 .030 82
3107.1 Western Samoa** 2 .043 .890 .035 .033 231
3108.1 Western Samoa** 3 .046 .813 .038 .lo3 131
3109.1 Western Samoa** 4 .056 .852 0 .093 27
3103.1 Fiji** 5 0 .963 0 .037 27
3106.1 Fiji
**
6 .057 .943 0 0 44Panape** 7 .090 .847 .049 .014 72
C165.1 Guam** 8 .029 .935 .036 0 417
C161.1 Yap** 9 .lo9 .814 .064 ,013 234
C162.1 Yap** 10 .121 ,840 .039 0 128
C156.1 Palau** 11 .025 .801 .113 .061 221
C150.1 Palau** 12 .060 ,827 .086 .027 298
C151.1 Palau** 13 .016 ,886 .073 .026 254
3054.1 Philippines* 14 .121 .793 .086 0 116
3055.1 Philippines* 15 .030 .857 .lo8 -005 185
j- Map numbers identify the locations in Figure 4.
* 1967 collections, see also JOHNSON, KOJIMA and WHEELER (1969).
* * 1968 collections, data not previously published.
to the diversity among populations, but allows for the presence of comparable levels of genetic flexibility in all. The involvement of low-frequency alleles is not clear. Some may occur only in certain localities and provide rare and unique genotypes, or it may be that occurrence is merely a function of chance and sample size.
84 F. M. J O H N S O N
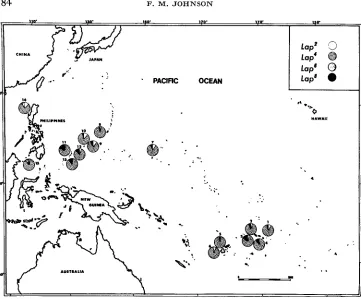
.
PACIFIC OCEANFIGURE 4.-Map of the Pacific showing the locations from which D. ananassae were collected and analyzed for Lap, and the frequencies of L a p alleles determined for each of these collections.
ences in Lap alleles than for Est-C and Acph, the same kind of pattern is evident. There is a higher percentage of nonsignificant chi-squares for within-island and island group comparisons than for those between geographically more distant sites. The Lap locus thus provides additional genotypic diversity among popu- lations.
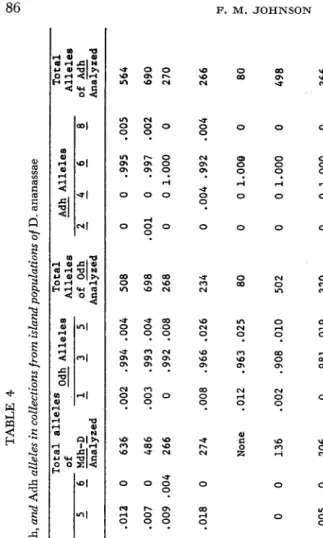
I n contrast to the above three loci, three other loci (Mdh-D, Odh, and Adh) do not show any genetic differentiation among the population samples. Table 4 summarizes these data. At all three loci there is primarily only one allele that occurs with appreciable frequency. Although other alleles also occur. they are typically in very low frequency. For Adh, the allele of highest average frequency ( A d h 6 ) appears to have reached fixation (or near fixation) in several populations, but the Mdh-D and Odh loci apparently have low-frequency alleles maintained in all or most populations. Chi-square tests show only a very small number of significant differences among collections. These are probably not meaningful.
POLYMORPHISMS IN ISLAND DROSOPHILA 85
ns ns ns ns
2 ns ns ns
/
’ 3 ns ns
9
9
ns ns ns ns ns
*
ns * ns*
ns ns
**
*
*
*
ns ns**
*ns ns
**
**
**
ns**
**
**
**
involve localities within an island group. Thus A p h appears to be extremely variable among populations and is probably the most sensitive indicator of genetic diversity.
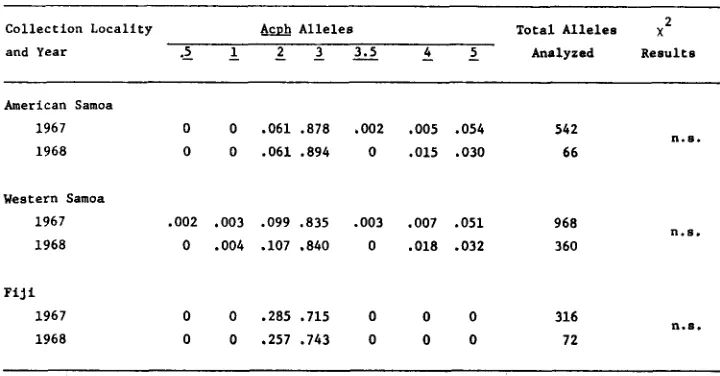
Although similarity in allelic frequencies among localities in geographic proximity is a n indication of stability, a major concern relating to the apparent differentiation of populations is the constancy of patterns in allelic frequencies over time. If significant changes in frequencies occur often, the general pattern of differentiation presented may be illusory. Several localities have been sampled fairly extensively on two separate occasions, once in 1967 and again in 1968. The collections for both years have been analyzed for a number of enzyme loci,
CO a TABLE 4 Frequencies of Mdh-D, Odh, and Adh alleles in collections from island populations of D. ananassae Total Alleles Adh Alleles Total alleles Odh Alleles Total
-
Alleles--
Mdh-D Alleles of-
Collection Numbers and Locality 1 1.5 3 4 2 5 E-2-
1 3 2 of= 2 3 5 of& Analyzed Analyzed Analyzed ABE American Samoa** .008 C Western Samoa** .003 D Western Samoa** 0 F Fiji** .020 Ponape**
C165.1 Guam**
.007 C161.1 Ya$* .OlO C162.1 Ya$* .029 C156.1 Palau**
.005 C150.1 Palau**
.005 C151.1 Palau**
0 3054.1 Philippines*
.004 3055.1 Philippines*
0.
o
.WOo
.oiao
0 .988 .002 .007 0 0 .987 0 .009 .004 .002 .960 0 .018 0 0 .993 0 0 0 0 .985 0 .005 0 0 .971 0 0 0 0 .990 0 .005 0 0 .995 0 0 0 0 1.000 0 0 0 O .979 O -017 0 0 .989 0 .005 .006636 486 266 274 None 136 206 70 200 214 26 116 184
.002 .994 .004 .003 .993 .004 0 .992 .008 .008 .966 .026 .012 .963 .025 .002 .908 .010 0 .981 .019 0 .988 .012 0 .997 .003 0 .995 .005 .008 .984 .008 .010 .980 .010 .018 .941 .041
508 698 268 234 80 502 320 154 328 426 222 96 112
0 0 .995 .005 564 .001 0 .997 .002 690 0 0 1.000 0 270 0 .004 .992 .004 266 0 0 1.008 0 80
4
i?
z
2
P O L Y M O R P H I S M S I N I S L A N D D R O S O P H I L A
TABLE 5
87
Frequencies of Aph alleles in collections from island populations of D. ananassae
Collection Numbers &A Alleles Total Alleles
and Localities
-
- 5-
1 -2 -3 - 4 - 5 -6 Analyzed3112.1 American Samoa** ,007 ,138 .238 .290 .270 ,013 0 76 3107.1 Western Samoa** 0 :056 .036 .272 .636 0 0 124 3108.1 Western Samoa** 0 .173 .047 .154 .626 0 0 126
3103.1 F i j i * * 0 .382 .049 .451 .118 0 0 50
3106.1 F i j i * * 0 .612 0 .275 .112 0 0 40
3054.1 Philippines* .015 .247 .320 .126 .262 .015 .015 102 3055.1 Philippines* 0 .192 .262 .269 .252 .015 0 64
* 1967 collections, see also JOHNSON, KOJIMA and WHEELER (1969). * * 1968 collections, data not previously published.
of chi-square tests comparing the yearly differences are given in Tables 6, 7, 8, and 9. These data show that there is little year-to-year variation in allelic fre- quencies. Only two of the comparisons were found to be significant and they were significant only at the 5 % level. Thus it seems that the total frequency data are a true reflection of the genetic diversity among populations.
Assuming that the loci studied are representative of the genome, race develop- ment in
D.
ananassae is apparently the result of allelic frequency differences and few, if any, race-specific genes. I n addition to those enzymes scored for variation, several uniform isozyme bands were observed. No unique enzyme forms have been found in any of the collections.3107.1 3108.1 3103.1 3106.1 3054.1 3055.1
88 F. M. J O H N S O N
TABLE 6
Frequencies of Est-C alleles in collections of D. ananassae in different years in Samoa and Fiji and results of chi-square comparisons between years
2
Collection Locality Est-C Alleles Total Alleles x
and Year . 5 1 2 3
-
4 2 2 Analyzed ResultsAmerican Samoa
1967 0 .007 .002 .862 .087 .040 .002 564 n . 8 .
1968 0 ;015 0 ,882 .074 .030 0 60
Western Samoa
p c . 0 5
1967 .OOl .014 0 .909 .044 .032 0 956
1968 0 .015 0 .a50 .067 .067 0 366
F l j I
n . s .
1967 0 .026 0 .519 .338 .lo2 .015 266
1968 0 ,028 0 .569 .292 .111 0 72
n.s. = not significant.
DISCUSSION
Although the chi-square comparisons demonstrate the occurrence of genetic diversity, they do not lead to a measurement of the degree of diversity. From a n evolutionary point of view it would be interesting to know if some of the popu-
TABLE 7
Frequencies of Acph alleles in collections of D. ananassae made in different years
in Samoa and Fiji and results of chi-square comparisons between years 2
A a h Alleles Total Alleles x
Collection Locality
and Year . > 1 2 2 3 . 5 k z Analyzed Results
American Samoa
n.s.
1967 0 0 .061 .a78 .002 ,005 .054 542
1968 0 0 .061 .894 0 .015 .030 66
Western Samoa
1967 ,002 ,003 .099 .835 .003 .007 .051 968 1968 0 .004 .lo7 .840 0 .018 .032 360
n . s .
F i j i
n . 8 .
1967 0 0 .285 ,715 0 0 0 316
POLYMORPHISMS I N ISLAND DROSOPHILA
TABLE 8
Frequencies of Lap alleles in collectiosns of D. ananassae made in different years in Samoa and Fiji and results of chi-square comprisons between years
89
2
Collection Locality
a
Alleles Total Alleles xand Year - 2
-
4-
6 - 8 Analyzed Result6American Samoa
1967 .063 * 879 .033 .025 598 n.s.
1968 .073 .884 .012 .030 82
Western Samoa 1967 1968
F i j i 1967 1968
.060 .873 .026 .041 722
,045 .861 .033 .060 388
n.8.
n.s.
.093 .a45 .042 .020 296
.035 .951 .014 0 70
lations tend to be more divergent than others and if divergence can be related to such factors as the amount of isolation, population size, ecological variation, etc. One quantitative measure of genetic diversity is the coefficient of genetic simi- larity of SOKAL and SNEATH ( 1 963) ; compare also its use in SELANDER, HUNT and
YANG
(1969). Using this measurement, all possible pairs of collections areTABLE 9
Frequencies of Aph alleles in collections of D. ananassae m d e in different years in Samoa and Fiji and results of chi-square comparisons between years
2
Collection Locality &A Alleles Total Alleles x
and Year - 5 1 2
-
3 5 5 Analyzed ResultsAmerican Samoa
1967 o
. u s
.242 ,287 .298 .om 2881968 .007 .138 ,283 ,290 .270 .013 76
n.8.
Western Samoa 1967 1968
p <.OS .003 .094 .048 .317 .536 .002 323
0 .115 .042 .212 .631 0 252
F i j i
n.s.
1967 ,009 .472 .068 .274 .177 0 214
90 F. M. J O H N S O N
TABLE 10
Coefficients of genetic similarity within and between populations of D. ananassae
Philip-
Samoa Fiji Ponape Guam Yap Palau pines Majuro Hawaii
Samoa .sl.z .59/.69 .251.45 .42/ .57 ~ 7 1 . 6 4 . 4 3 l . 56 .45/. 57 .601- . 5 8 / -
Fij i . .52/.g .321.52 .41/.59 . 5 0 l . b 1 .401.55 . 4 3 1 . 5 6 -521- .491-
Ponape X -591.68 .471.57 .641.70 ,581.65 .391- .471- Guam X .541.63 . 6 7 1 . 7 3 . 6 0 / . 6 8 .49/- .561-
Yap .El .E ~ 8 1 . 6 4 .56/. 62 .551- .sal-
Palau .rs/.E ,681.71 s521- ,621-
Philippines .61/.E .XI- .50/-
Majuro X .56/-
Hawaii x
The first value in each cell of the matrix was determined from the E s t 4 and Acph loci, and the second from the Est-C, Acph, and Lap loci. To shorten the calculations, low-frequency alleles were not considered. The cells marked by an X indicate that no intrapopulational comparison was possible.
compared for the Est-C, Acph, and Lap loci in Table 10. For comparisons involv- ing localities within which more than one collection was obtained, unweighted average allelic frequencies were used in determining the coefficients. Coefficients of similarity within island groups are unweighted averages of all pairwise determinations. As expected from the chi-square tests, the table shows generally higher values (more genetic similarity) within island groups and a wide range of mostly lower values for comparisons between island groups.
Inspection of the table does not reveal many pairs of populations that are obviously more or less divergent than the others. An attempt was made, there- fore, to rank the populations according to divergence by averaging all coefficients between one locality and all other localities, individually, for each locality listed
P O L Y M O R P H I S M S IN I S L A N D DROSOPHILA 91
TABLE 11
Average coeficients of genetic similarity between populations listed and all other populations for the Est-C and Acph loci ( A ) and the Est-C, Acph, and Lap loci ( B )
A B
Palau .57 Guam .65
Philippines .55 P a l m .65
Hawaii .55 Philippines .63
Guam .54 Yap .62
Yap .54 Ponape .59
Majuro .52 F i j i .59
Samoa .49 Samoa .58
Fiji .46
Ponape .46
Another interpretation could be that migration has a negligible effect and that the relationships in coefficients are entirely coincidental to other determining factors. Also, genetic similarity based on a small number of loci may be a biased and nontypical picture. Regardless, differentiation is extensive and, if migration has no effect, then perhaps the simplest explanation of the observed population patterns is that they are purely a n expression of adaptation of various genotypes to different ecological situations. According to this hypothesis, a n array of differ- ent niches exists within all localities, different genotypes vary in their ability to utilize the niches, and there are quantitative and/or qualitative differences among localities in occurrence of the niches. Then within geographically related localities, genotypic patterns are similar because the array of niches is similar, and distant localities are different because the ecology vanes. However, since a large amount of environmental heterogeneity exists even within one island, it is reasonable to hypothesize, in addition, that migration had an appreciable role in reducing heterogeneity among population samples obtained from geographically related localities, i.e., the same island or group of islands. I t would then be the array of niches within the entire island group that determines the allelic fre- quencies. That migration may also produce moderating effects on genetic differ- ences among different island groups, however, is more problematic, since the degree of variation is so much greater between island groups than it is within them.
92 F. M. J O H N S O N
upon physiological properties of the polypeptides and only weakly on variation i n the environment” was involved. They ruled against selection (adaptation) for different genotypes in different localities because of this similarity in allelic fre- quencies. Their hypothesis is contingent upon restricted gene flow (migration) and relatively small population size which they believe to exist. Although differ- ent loci in different organisms might be subjected to quite different means of selection, it would appear that some confirmation of the above hypothesis of environmentally insensitive loci should be found in the island data where there are no connecting land masses to make migration suspect. At least one would expect to confirm the hypothesis using more widely separated
D.
pseudoobscurapopulations. There is, however, absence of the predicted similarity among the isolated island populations, and PRAKASH, LEWONTIN and HUBBY (1969) them- selves have shown that a South American population of
D.
pseudoobscura, quite clearly isolated from North American populations, is also genetically different. Thus, some shadow of suspicion is cast on the hypothesis.PRAKASH, LEWONTIN and HUBBY (1969) tend to believe that the South Ameri- can population is, however, a n exception. They rescue their hypothesis by assum- ing that the South American populations originated fairly recently from a small number of North American founders and that this then placed the enzyme loci in a restricted, atypical genetic background. Accordingly, the changed allelic frequencies and a reduction in heterozygosity were the results. Both results could be solely or largely a matter of an adaptive response to a foreign environment, however.
Founder effect and the genetic background are important considerations, nevertheless, and one can apply the reasoning of PRAKASH, LEWONTIN and HUBBY (1969) to account for all the interlocality heterogeneity of
D.
ananassaePOLYMORPHISMS I N ISLAND DROSOPHILA 93
There is, finally, the possibility that true functional neutrality exists among the alleles at some loci. According to sound theoretical considerations, KIMURA and CROW (1964) have shown that it is possible to explain the degree of poly- morphism observed in natural populations as a function of mutation rates and effective population sizes with little or no involvement of selection. PRAKASH, LEWONTIN and HUBBY (1969) discount the applicability of this hypothesis (although they have some supporting data) in favor of their selective mechan- ism. They reject neutrality chiefly because low-frequency alleles are present fairly consistently in their three North American populations. On the same basis one can reject the neutrality hypothesis for the enzyme loci in the South Pacific. There is, however, a more compelling argument in addition. According to neu- trality theory, heterozygosity should decrease with decreasing population size. One can observe in Table 12 that each of the three polymorphic loci varies con- siderably in heterozygosity among the populations. Most important, though, many localities show extreme variation in heterozygosity among loci. For ex- ample, Ponape, a small and isolated island, is the most polymorphic of all locali- ties for Est-C, but the least polymorphic at the Acph locus. There is little regular change in heterozygosity among islands as would be expected to result from vari- ation in effective population size according to neutrality theory. Consistent occur- rence of low-frequency alleles within a continental area is easily explained away by migration, but one is hard pressed to explain the observed variation in hetero- zygosity among loci in different localities by means of variations in population sizes and migration rates. Besides this lack of regularity of change of heterozy- gosity among localities, some of the islands of smaller land areas (which quite reasonably might be supposed to support populations of smaller effective size), e.g., Guam, Ponape, and Majuro Atoll, show no evidence of reduced heterozy-
TABLE 12
Estimated average frequencies of heterozygotes for Est-C, Acph, and Lap, and
for the three loci combined, in populationst of D. ananassae
--
Est-C &@!*
TotalPonape .59 Hawaii .53 Philippines .30 Yap .39
F i j i .56 Yap .51 Yap "30 Philippines .36
Guan .45 Hajuro .49 Paleu .28 F i j i .34
Hajuro .40 Philippines .37 Ponape .27 Guan .31
Philippines .39 F i j i .37 Samoa .25 Ponape .30
Yap .35 G u m .35 Guam -12 Smoa .25
Samoa .27 Samoa .23 F i j i
.
09 Palau .23Kawaii .26 P a l m
.
19Palau .24 Ponape .05
94 F. M. J O H N S O N
gosity. Neutrality is clearly an unacceptable hypothesis according to these con- siderations.
A previous study (JOHNSON et al. 1969) revealed significant correlation be- tween genetic and environmental variation among population samples of an ant species collected over a continuous land area in Texas. This was interpreted as a reflection of adaptation to a gradually changing environment over the sampling area. The differences in allelic frequencies between some of the more distant lo- calities were of the order observed among island groups for the
D.
ananassaepopulations. Little migration among ant populations, as among Pacific island groups, is thought to occur. Correlation between genetic and environmental vari- ation is not apparent in the island data, and previously suggested clinal changes in allelic frequencies (STONE, KOJIMA and JOHNSON 1969) have been obscured by the additional data. The lack of correlation, however, does not contradict adaptive involvement of the enzyme loci. The islands generally do not vary in any systematic way with regard to environmental factors; rather, they show irregular diversity in geography, climate, and biota. The abrupt changes in allelic frequencies are thus consistent with adaptation in view of the type of environ- mental heterogeneity present.
The actual adaptive values of the isozyme genotypes are unknown, but they are presumably not greatly different from one another on the average since the number of genotypes is so large. Considering that only a small proportion of probably many polymorphic loci have been detected, the number of genotypes is indeed great. Mechanisms of maintenance could be overdominance and homo- zygote superiority, both dependent on habitat, but adaptive values cannot be greatly different from one another in most environments or most genetic back- grounds. Since some form of environmental adaptation is supported by the data, it must be that either adaptive values vary considerably only among a few en- vironments or that there are slight differences among many environments. It is not reasonable to think that an opportunistic species like
D.
ananassae produces more than a small proportion of largely ill-adapted genotypes, as it must if adap- tive values vary greatly among many habitats. Multiple peaks for adaptive geno- types might exist in some habitats, and chromosomal inversions likely contribute to minimize the production of many poorly adapted genotypes. Functional neu- trality for some isozyme polymorphisms is also still a possibility, if the enzyme variations are maintained by close genetic linkage to other unknown polymorphic loci.Most of this work was carried out while the author was a Research Associate of the Genetics Foundation, University of Texas at Austin. The professional and technical aid of the many people in and associated with the Foundation made this work possible. At North Carolina State Uni- versity, Dr. H. E. SCHAFFER and Mrs D. CUTHBERTSON provided assistance with the statistical analysis.
SUMMARY
P O L Y M O R P H I S M S I N ISLAND D R O S O P H I L A
95
Drosophila ananassae. Four loci showed moderate to high levels of polymorphism. For the polymorphic loci, allelic frequencies in geographically distant localities tended to be more different than those from localities situated near one another. The frequency differences among localities are consistent with adaptiveness of the polymorphisms to variations in the environment. Three loci showed low levels of variability and no appreciable differences among localities.
L I T E R A T U R E C I T E D
FUTCH, D. G., 1966
JOHNSON, F. M., C. G. KANAPI, R. H. RICHARDSON, M. R. WHEELER and W. S. STONE, 1966 A study of speciation in South Pacific populations of Drosophila ananassae.
Univ. Texas Publ. 6615: 79-120.
An
analysis of polymorphisms among isozyme loci in dark and light Drosophila amnassae
strains from American and Western Samoa. Proc. Natl. Acad. Sci. U.S. 56: 119-125. Isozyme variation in Drosophila island populations. 11: An analysis of Drosophila ananassae populations in the Samoan, Fijian, and Philippine Islands. Univ. Texas Publ. 6918: 187-205.
Isozyme genotype- environment relationships in natural populations of the harvester ant, Pogonomyrmex barbatus, from Texas. Biochem. Genetics 3 : 429-460.
The number of alleles that can be maintained in a finite population. Genetics 4 9 : 725-738.
A molecular approach to the study of
genic heterozygosity in natural populations. IV: Patterns of genic variation in central, marginal, and isolated populations of Drosophila pseudmbscura. Genetics 61 : 841-858.
Protein polymorphism and genic hetero- zygosity in two European subspecies of the house mouse. Evolution 23: 379-390.
Principles of Numerical Taxonomy. W. H. Freeman, San Francisco.
Mating behavior of D. ananmsae and ananassae-like flies from the Pacific. Univ. Texas Publ. 6615: 133-145.
Enzyme polymorphisms in animal popu- lations. Japan. J. Genetics 44 (Suppl. 1): 166171.
Genetic variation in natural island populations of members of the Drosophila nasuta and Drosophila amnassae
subgroups. Proc. Natl. Acad. Sci. U.S. 59: 102-109.
STONE, W. S., M. R. WHEELER, W. P. SPENCER, F. D. WILSON, J. T. NEUENSCHWANDER, T. G. GREGG, R. L. SEECOF and C. L. WARD, 1957 Genetic studies of irradiated natural p o p - lations of Drosophila. Univ. Texas Publ. 5721 : 260-316.
JOHNSON. F. M., K. KOJIMA and M. R. WHEELER, 1969
JOHNSON, F. M., H. E. SCHAFFER, J. E. GILLASPY and E. S . ROCKWOOD, 1969
KIMURL M. and J. F. CROW, 1964
PRAKASH, S., R. C. LEWONTIN and J. L. HUBBY, 1969
SmANnm, R. K., W. G. HUNT and S. Y. YANG, 1969
SOKAL, R. R. and P. H. A. SNEATH, 1963
SPIETH, H. T., 1966
STONE, W. S., K. KOJIMA and F. M. JOHNSON, 1969