ABSTRACT
THORNTON, TIMOTHY ROBERT. Understanding How Learner Outcomes Could be Affected through the Implementation of Augmented Reality in an Introductory Engineering Graphics Course. (Under the direction of Dr. Matthew Lammi and Dr. Aaron Clark).
The study was designed to investigate the implementation of augmented reality in an
introductory engineering graphics course. The study was driven by three research questions
that examined how augmented reality influenced student motivation, enhanced the learning
experience, and/or affected the spatial visualization ability of students.
The sample used in the study consisted of 50 (N = 50) students from two different sections of an introductory engineering graphics course at North Carolina State University.
The augmented reality intervention was conducted over six sessions that occurred on a
weekly basis. Students were required to complete a weekly assignment with the assistance of
augmented reality.
To measure the effectiveness of the augmented reality system used in the study
multiple data collection methods were incorporated. This consisted of two different
measurements: MSLQ, PSVT-R, and questions used in the approach of basic interpretive
methodology on the student experience with augmented reality. Both the MSLQ and
PSVT-R used a pre- and post-test format, while the seven-questions were administered at the
conclusion of the study.
The results from the two instruments and student questions were mixed. A paired
t-test was used to measure the mean scores of the MSLQ and PSVT-R. The results of the
reality. The basic interpretive questions highlighted several benefits associated with the
inclusion of augmented reality. The responses indicated that augmented reality was beneficial
in aiding visualization ability, allowing students to obtain additional perspectives through
© Copyright 2014 by Timothy R. Thornton
Understanding how Learner Outcomes Could be Affected through the Implementation of Augmented Reality in an Introductory Engineering Graphics Course
by
Timothy R. Thornton
A dissertation submitted to the Graduate Faculty of North Carolina State University
in partial fulfillment of the requirements for the degree of
Doctor of Education
Technology Education
Raleigh, North Carolina
2014
APPROVED BY:
_______________________________ ______________________________
Dr. Matthew Lammi Dr. Aaron Clark
Committee Co-Chair Committee Co-Chair
BIOGRAPHY
Timothy Robert Thornton was born in Danville, IL on August 12, 1975. He spent his
early years in Danville before moving to Charleston, SC during his sophomore year of high
school. After graduating from Middleton High School, Timothy attended several schools and
proceeded to move around the country. He finally settled down and graduated from Guilford
College with a degree in Business Administration. Upon completion, he moved to Florida
where he spent the next couple of years. After living in Florida, he returned to North Carolina
and received his Master’s in the Art of Teaching in Business and Information Technology
from East Carolina University. He then took a position teaching business at Monroe High in
Monroe, NC. Timothy remained in Monroe for one year before again returning to school. He
applied and was accepted to the Technology Education Program at North Carolina State
University. During his time in the program, he served as a teaching assistant within the
ACKNOWLEDGMENTS
I would like to thank all of my committee members for their contributions towards
my dissertation. Dr. Matthew Lammi, my co-chair, for all of his assistance and guidance
through the sometimes tedious process. Dr. Aaron Clark, my co-chair, for initially guiding
me through the dissertation process and working with me to find a topic. Thank you to Dr.
Joe Busby for his positive support and assistance along the way. Thank you to Dr. James
Smith for allowing me to obtain my minor in Business/Marketing Education and providing
insight when necessary. I would also like to thank Dr. Walt Kelly for allowing me to
conduct research in his courses and assisting me throughout the study and Erik Ward for
assisting me in the process.
I would like to thank my family for their support. First, I would like to thank my wife
for all of the sacrifices she has made to allow me to pursue my dream. I was fortunate to have
her by my side throughout my time at North Carolina State University. Next, I am grateful to
my parents for standing behind me when I struggled to find my path in life. I am also
grateful for my in-laws, who kept me focused throughout my dissertation and provided
direction when needed. Finally, thank you to my brother for taking the journey with me.
I am grateful to all of those who have assisted me along my journey. These people
TABLE OF CONTENTS
LIST OF TABLES ... vi
LIST OF FIGURES ... vii
CHAPTER ONE: INTRODUCTION ...1
Background ...1
Engineering Graphics ...2
Augmented Reality ...3
Motivation ...4
Methodology ...5
Data Analysis ...10
Statement of the Problem ...10
Significance of the Study ...11
Research Questions ...11
Hypothesis ...12
Null Hypothesis ...12
Limitations ...13
Assumptions ...13
Definitions ...14
Chapter Summary ...16
CHAPTER TWO: LITERATURE REVIEW ...17
Mixed Reality ...17
Virtual Reality in Education ...18
Similarities Between Virtual Reality and Augmented Reality ...19
Reasoning for Selecting Augmented Reality ...19
Augmented Reality in Education ...20
Research Studies ...21
Methodology Strategies Utilized ...24
Implications Obtained From Studies ...27
Manipulation ...31
Engagement and experimentation ...32
Mixed Reality in Graphic Communication Courses ...34
Spatial Visualization in Engineering Graphics ...36
Technology in Engineering Graphic Courses ...38
Motivation ...45
Data Collection Methods ...50
Motivated Strategies for Learning Questionnaire ...50
Purdue Spatial Visualization Test – for Rotations ...56
Student Questions ...60
Chapter Summary ...64
CHAPTER THREE: RESEARCH DESIGN AND METHODOLOGY ...67
Rationale for the Design of the Study ...68
Implementation ...68
Augmented Reality System ...71
Augmented Reality Implementation ...73
Study Design ...74
Data Collection Methods ...77
Pre- and Post-test Design ...78
Participants Involved in the Study ... 80
Demographics ...81
Procedures ...81
Data Collection Methods ...96
MSLQ Survey ...96
PSVT-R Test ...96
Student Questions ...98
Data Collection ...99
Data Analysis ...100
Chapter Summary ...101
CHAPTER FOUR: FINDINGS ...103
Demographic Data ...103
Subject Gender and Academic Levels ...103
Academic Majors in Study ...105
Data Analysis ...105
Research Question #1 ...106
Research Question #2 ...111
Correlation ...114
Research Question #3 ...115
Chapter Summary ...127
CHAPTER FIVE: FINDINGS, CONCLUSIONS, AND IMPLICATIONS ...128
Research Questions ...128
Analysis of Research Questions and Hypothesis ...129
Research Question #1 ...129
Research Question #2 ...132
Research Question #3 ...135
Implications ...138
Future Research ...141
Conclusion ...146
REFERENCES ...150
APPENDICES ...178
Appendix A: STUDENT SURVEY ...179
Appendix B: STUDENT SURVEY RESPONSES ...182
LIST OF TABLES
Table 1 Cronbach’s Alpha for MSLQ Motivation Subscales (Pintrich et al., 1993) ...56
Table 2 Research Timeline ...82
Table 3 Augmented Reality Assignment Schedule ...87
Table 4 Gender and Academic Level of Subjects in Study Sample ...104
Table 5 Academic Majors in Study ...105
Table 6 Comparison of Scores for MSLQ Subscales by Test ...107
Table 7 Paired Sample Tests for MSLQ Subscales and Overall Summary ...110
Table 8 Results of the PSVT-R ...112
Table 9 Paired Samples Test for PSVT-R ...113
Table 10 Frequency Comparison between Pre-post Scores on the PSVT-R ...113
LIST OF FIGURES
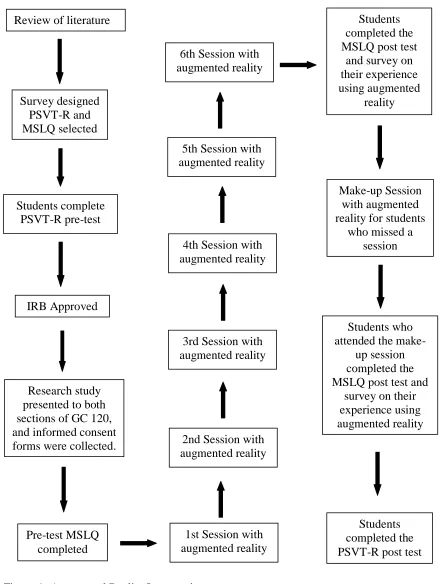
Figure 1. Augmented Reality Intervention ...9
Figure 2. Mixed Reality Spectrum ...18
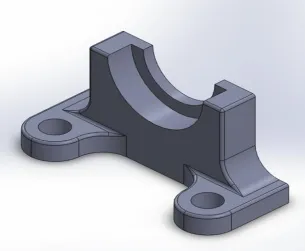
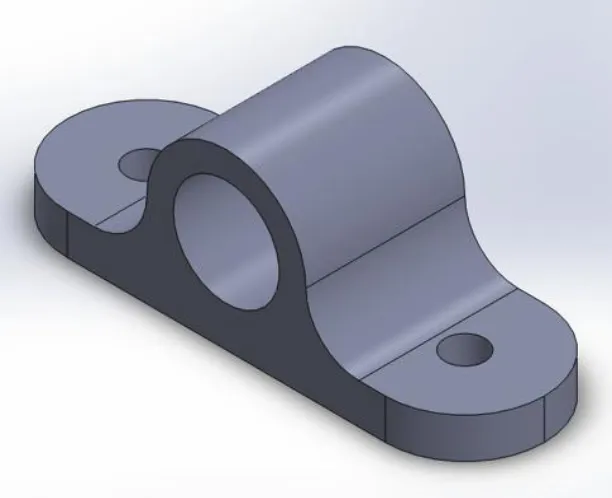
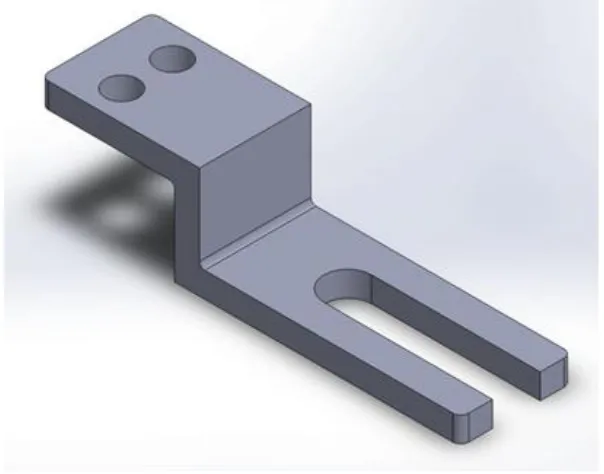
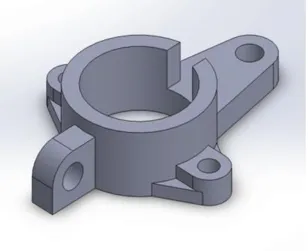
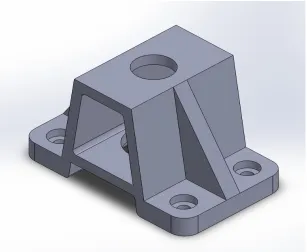
Figure 3. Assignment 1 ...88
Figure 4. Assignment 2a ...89
Figure 5. Assignment 2b ...90
Figure 6. Assignment 3 ...91
Figure 7. Assignment 4 ...92
Figure 8. Assignment 5 ...93
Figure 9. Assignment 6 ...94
Figure 10. Assignment Make-up Assignment ...95
Figure 11. Sample PSVT-R Question ...98
CHAPTER ONE: INTRODUCTION
The purpose of this study was to investigate how the inclusion of augmented reality in
an introductory engineering graphics course influenced motivation, affected the spatial
visualization ability of students, or enhanced the learning experience. Ronald T. Azuma, a
leader within the field of augmented reality, defined augmented reality as allowing “the user
to see the real world, with virtual objects superimposed upon or composited with the real
world” (1997, p. 355). Augmented reality allows the user to take an active role in the
learning process, which can be important since new methods of instruction should involve
active exploration, construction, and learning of the material (Fosnot, 2005). Because of its
potential capabilities, various teachers and researchers have begun experimenting with the
use of augmented reality to improve instruction (Liarokapis & Anderson, 2010).
Background
The study was designed and built upon previous research surrounding the use of
augmented reality in engineering graphics courses. The intention was to investigate the
effectiveness of augmented reality as a supplemental learning tool in an introductory
engineering graphics course. The study investigated the impact of augmented reality from
three different perspectives. For one, the study was designed to determine how augmented
reality affected the motivational attitudes of students. Additionally, the study examined the
role of augmented reality as a tool to improve spatial visualization skills of students. Finally,
the study investigated how students were able to manipulate, experiment, and engage with
Engineering Graphics
Engineering Graphics courses allow students to acquire, develop, and utilize highly
defined spatial skills. The spatial skills developed in these courses continued to be refined
and serve as a foundation for student success. These spatial skills are important in
engineering and can be improved through appropriate activity (Olkun, 2003). An important
spatial skill utilized in engineering graphics courses is visualization ability (Alias, Black, &
Gray, 2002; Miller, 1999; Sorby & Baartmans, 2000). Spatial visualization skills allow users
to mentally create and manipulate images. McGee (1979, p. 893) defines spatial visualization
as “the ability to mentally manipulate, rotate, twist, or invert a pictorially presented stimuli.”
Students are to continually develop their visualization skills if they are to reach their
capabilities and understand core competencies. A student’s spatial visualization skills should
improve with purposeful experience as he/she is exposed to more complex problems
(Gorska, Sorby, & Leopold, 2009; Bertoline, Wiebe, Hartman, & Ross, 2011). Students who
struggle to grasp visual concepts may possibly struggle within the course and are prone to
failure or withdrawal. The use of augmented reality as a visual aid could offset this by
allowing students to manipulate their models and achieve a greater visual understanding of
the object being modeled.
The field of engineering graphics education is continuously focusing on new methods
to improve learner outcomes. There is a constant need to research and develop new methods
for delivering instruction and with it a need to improve learner outcomes within engineering
graphics. This may be in part accomplished through the integration of technology as a
in what is being taught is also paramount to a student’s motivation in a course, like a
fundamentals of engineering graphics” (Clark, Ernst & Scales, 2009, p. 9).
Augmented Reality
Augmented reality operates by augmenting the landscape with digital information that
allows the user to gain additional information about their surroundings, or through the
enhancement of an object (Billinghurst, Kato & Poupyrev, 2001). Augmented reality
enhances an individual’s physical environment through a collaboration of the virtual and real
environments (Azuma, 1997). The viewer is given the ability to merge their physical
environment into a pre-designed virtual environment (Barfield & Caudell, 2001). Augmented
reality allows users to turn models into three-dimensional objects that become interactive,
creating a more authentic learning experience with the real world environment serving as the
baseline and backdrop to which virtual information is supplemented (Goldiez, Livingston,
Dawson, Brown, Hancock, Baillot, & Julier, 2004).
There are several components that comprise an augmented reality system. Paramount
is a high processing computer (Adams, 2004). The computer must be able to process
information very quickly due to the fact that streaming content is constantly changing and
there must be a confluent alignment between the virtual objects and the real world (Azuma,
1997). Through technical innovation, processors capable of running augmented reality
software can now be found on personal computers, iPads, and smart phones. The system also
requires a viewing device such as a webcam, camera, or head mounted display, as well as a
world objects or environments when the viewing device interacts with the marker (Poonsri,
2011).
Evidence has indicated that augmented reality is a useful tool in education (Sumadio
& Rambli, 2010). In education, the use of augmented reality software allows students to take
an active role in the learning process. Accordingly, students are engrossed and motivated to
learn new skills to solve problems (Norman & Spohrer, 1996). Studies have indicated that
augmented reality can be a motivational factor in increasing interest and curiosity, leading to
improved academic performance (Campos, Pessanha, & Jorge, 2011; Yusoff, Zaman, &
Ahmad, 2011; Shea, Mitchell, Johnston, & Dede, 2009). Augmented reality has the potential
to become a pedagogical tool that is motivational for students as it enhances the learning
experience and allows for experimentation, manipulation, and engagement.
Motivation
Motivation is an important component in the learning process. A student who is
motivated will be engaged in the learning process and obtain more from the educational
experience, whereas an unmotivated student will gain little from a course and the learning
experience will be minimal (Ames, 2003; Sull, 2007). In order for a student to be motivated,
they have to have a vested interest in the subject. Students need to feel that the work is
meaningful, and there needs to be a conceptual understanding of the content (Seifert, 2004).
A conceptual understanding is important in engineering graphics where students are required
to conceptualize a model and then recreate it using computer aided design (CAD). Based on
affect the motivation of students in an introductory engineering course (Allison & Hodges,
2000; Di Serio, Ibáñez, & Kloos, 2012; Lee, Wong, & Fung, 2010).
Methodology
This study was conducted at North Carolina State University in the spring of 2013.
There were a total of 50 students who participated in the study. The participants were
required to complete six assignments with the assistance of augmented reality. The
augmented reality software used for the study was Augment®. The software was used in conjunction with an iPad and an augmented reality marker. The effectiveness of augmented
reality was examined via multiple data collection instruments and basic interpretive method
that consisted of seven questions.
The participants were students drawn from two separate sections of the same graphic
communications course. The two sections were an introductory course titled Graphic
Communications 120 Foundations of Graphics (GC 120). In general, an introductory engineering course consists primarily of first year engineering students (Crown, 2001). This
is often their first exposure to engineering graphics at the university level and serves as a
foundational course. Each section that participated in the study contained approximately 60
students, was taught by the same instructor, followed the same syllabus, and had identical
requirements. The researcher used a design study in which all participants who took part in
the study received the treatment of augmented reality.
The augmented reality software, Augmentedev®, was introduced during the initial presentation of the study to both course sections. The researcher highlighted the basic
Throughout the first session, the researcher individually guided each student through a
tutorial and modeled how to effectively use the software. The augmented reality software
was used with six different assignments for a total of six 90-minute sessions. Each of the six
assignments was designed to increase in complexity and difficulty and reinforce previously
learned engineering principles.
The data collection methods used in this study incorporated three different
assessments. All participants were required to complete the Motivated Strategies for Learning Questionnaire (MSLQ) and Purdue Spatial Visualization Test for Rotations
(PSVT-R) in a pre- and post-test format, as well as a basic interpretive approach on the
effectiveness of augmented reality. The pre-test for the PSVT-R was given two weeks prior
to the start of the treatment and the pre-test MSLQ was given during the first day of the
treatment. The MSLQ post-test was administered during the last treatment session, and the
PSVT-R post-test was administered three weeks later. All participants completed the
questions during the last treatment session, which consisted of seven-questions regarding the
participant’s experience using augmented reality.
The MSLQ is a self-reported instrument containing 81 questions within two sections
containing 15 subscales. The MSLQ was chosen for this study because it was designed to
measure a student’s motivation in a college classroom (Pintrich, Smith, Garcia, &
Mckeachie, 1993). The instrument is designed to assess participants’ motivational orientation
and use of cognitive learning strategies (Pintrich et al., 1993; Salisbury-Glennon & Stevens,
1999). The two sections contained within the instrument are motivation orientation and
three components: Value, expectancy, and affect. The value component consists of three
subscales including: Intrinsic goal orientation, extrinsic goal orientation, and task value. The
expectancy component contains two subscales, which are control of learning beliefs and
self-efficacy for learning and performance. The affect component only includes one subscale,
which is test anxiety (Pintrich, Smith, Garcia, & Mckeachie, 1991).
The learning strategies section contained a total of 50 questions and three scales:
Cognitive strategies, meta-cognitive strategies, and resource management (Credé & Phillips,
2011). The cognitive scale addressed strategies students use to process information from
lectures and texts and includes four subscales (Pintrich et al., 1993). The meta-cognitive scale
addressed strategies student use to control and regulate their cognition and includes one
subscale (Pintrich et al., 1993). The resource management scale addressed how students
manage other resources not associated with cognition and includes four subscales (Pintrich et
al., 1993).
For the purpose of this study only the motivation orientation component was utilized.
Within the 31-question motivation orientation section the affective component was omitted.
This component was omitted because it assesses test anxiety, which was not addressed in this
study. The entire learning strategies section was also excluded because it was not relevant to
the research.
The PSVT is a spatial ability test developed by Roland Guay (Guay, 1980). The
PSVT was used in this study because of its effective ability to measure spatial visualization
skills (Branoff, 2009). The PSVT consists of three sections: Developments, rotations, and
According to Ault and John (2010) the majority of graphic researchers only use the object
rotations portion of the PSVT. The PSVT-R is a spatial ability test that provides students
with an object and then rotates this object and asks the student to select the correct rotation
(Guay, 1980). The instrument is designed to evaluate the student’s ability to visually
comprehend the rotation of the object. The instrument includes 30 multiple choice questions
consisting of 13 symmetrical and 17 nonsymmetrical figures of 3-D objects all of which are
displayed in a 2-D isometric format (Maeda & Yoon, 2011).
The basic interpretive approach consisted of seven questions. The questions were
designed to analyze the effect of augmented reality on learner outcomes. The questions were
administered at the conclusion of the study and allowed the participants to provide feedback
on their exposure to augmented reality. The questions were tailored to address issues
surrounding the use of augmented reality as a motivational tool that allows for
experimentation, manipulation, and engagement. The questions also gauged the student’s
Students who attended the
make-up session completed the MSLQ post test and
survey on their experience using augmented reality
Make-up Session with augmented reality for students
who missed a session Students completed the MSLQ post test
and survey on their experience using augmented
reality 6th Session with
augmented reality
5th Session with augmented reality
2nd Session with augmented reality
3rd Session with augmented reality
4th Session with augmented reality
Students completed the PSVT-R post test 1st Session with
augmented reality Pre-test MSLQ
completed Research study presented to both sections of GC 120, and informed consent forms were collected.
IRB Approved Students complete
PSVT-R pre-test Review of literature
Survey designed PSVT-R and MSLQ selected
Data Analysis
After completing the administration of all tests utilized in the study, the data was
collected and analyzed. The cumulative results of the pre- and post-test MSLQ were analyzed
using descriptive analysis and a paired t-test (Salisbury-Glennon & Stevens, 1999).
Additionally, there were five subscales of the MSLQ examined: intrinsic goal orientation,
extrinsic goal orientation, task value,control of learning beliefs and self-efficacy for learning
and performance. A paired t-test was also used to analyze and compare the results from pre-
and post-test PSVT-R (Medina, Gerson, & Sorby,1998). A Pearson correlation was included
to determine if there was a relationship between the test scores on the MSLQ and
post-test scores on the PSVT-R (Ernst & Clark, 2012). Finally, the responses of the questions
were gathered and coded thematically. The students’ responses were sorted by key words and
then the keywords were grouped together into categories. After coding and reviewing the
responses multiple times, trends and themes were noted. These trends and themes were
measured against existing literature and theory.
Statement of the Problem
The problem this study addressed was how augmented reality influenced learner
motivation and outcomes in an introductory engineering graphics course. One of the
purposes of this study was to determine if the inclusion of augmented reality as a pedagogical
tool to model objects in an engineering graphics course affected motivation, spatial
Significance of the Study
The significance of the study is that learner outcomes and motivation have the
potential to be enhanced through the implementation of augmented reality in an introductory
engineering graphics course. As augmented reality is a relatively new technology there has
been little research conducted on the application of augmented reality in engineering graphics
communications education (Liarokapis & Anderson, 2010; Shelton & Hedley, 2002).
Augmented reality is a technology that has the potential to provide multiple uses in the
classroom, as well as affect the motivational attitudes of students (Dunleavy, Dede, &
Mitchell, 2009). Through augmented reality, learners are provided with an interactive
three-dimensional model allowing for a greater manipulation, experimentation, and engagement of
objects by creating an additional augmented point of view and perspective.
Research Questions
1. Will the implementation of augmented reality affect the motivational attitude of
students in an introductory engineering graphics course as measured by the
MSLQ? If so, how?
2. Will the implementation of augmented reality improve the spatial visualization
skills of students in an introductory engineering graphics course as measured by
the PSVT-R? If so, how?
3. What are the students learning experiences with augmented reality?
a. How does the use of augmented reality promote experimentation including:
b. How does the use of augmented reality allow the student to manipulate the
models by providing the following: multiple viewing perspectives, rotation,
and scalability?
c. How does augmented reality engage students through: active participation,
kinesthetic learning, and inquiry?
Hypothesis
Learner outcomes will be positively affected through the implementation of
augmented reality as a supplemental tool that allows for experimentation, manipulation, and
engagement in an introductory engineering graphics course. The focus of this study is an
understanding of the impact that augmented reality can have in an engineering graphics
classroom at the postsecondary level. The two null hypotheses have been developed
concerning the use of augmented reality in a graphics communication course at North
Carolina State University.
Null Hypothesis
1. The implementation of augmented reality will not have a statistically significant
effect on the motivational attitudes of students in an introductory engineering
graphics course as measured by the MSLQ.
2. The implementation of augmented reality will not have a statistically significant
improvement on the spatial visualization skills of students in an introductory
Limitations
The following limitations were identified for the study:
1. Participants in the study were students in Graphic Communications 120 at
North Carolina State University and were not selected randomly.
2. Students enrolled in GC 120 at North Carolina State University are not a
representative sample of engineering students in the United States.
3. The study was limited to undergraduate students taking a Foundation of
Engineering Graphics course at North Carolina State University during the
spring of 2013.
4. Augmentedev® software was the only augmented reality application that was
used for the experiment.
5. The Augmentedev® software used in the study was free and did not include all
of the features of the paid version.
6. The augmented reality software was only used on iPads.
Assumptions
There are several assumptions that are taken into account for the purpose of the
research
1. The participants were actively engaged.
2. The instructor taught both sections similarly.
3. Each of the classes received the same amount of time to work on each task
4. The Purdue Spatial Visualization Test for Rotations (PSVT-R) is a valid
measurement of a student’s visualization skills.
5. The Motivated Strategies for Learning Questionnaire (MSLQ) is a valid
measurement of a student’s motivational attitude.
6. Participants of the study had little experience with augmented reality.
7. Students only used augmented reality during the weekly laboratory period.
8. The use of augmented reality only occurred during six class periods.
9. The instructor did not use augmented reality during other instruction times.
10. Only the researcher modeled augmented reality.
11. Only the researcher worked with students during the process.
12. The capabilities of the augmented reality software Augmentedev® have
limitations.
13. Augmented reality was not designed to improve computer aided design
techniques.
Definitions
Augmented Reality (AR): Computer application that allows users to view the real world with a superimposed virtual image layered over top (Azuma, 1997).
Augment®: An augmented reality application created by Augmentedev®, a company located in France, that specializes in the development of Virtual and Augmented Reality
applications. The software is a mobile application allows a simple way of integrating digital
content in real world through the visualization of three-dimensional products through a
Engineering graphics: “A communications method used by engineers and other technical professionals during the process of finding solutions to technical problems.
Engineering graphics are produced according to certain standards and conventions so that
they can be read and accurately interpreted by anyone who has learned those standards and
convictions” (Bertoline et al., 2011).
Graphic communications: The visual communication of information through the use of graphic elements such as words, drawings, photography, or a combination of theses (Prust,
2003).
Introductory Engineering Graphics Course: “Introductory course providing orientation to language of graphics for students majoring in any field. Designed to help
develop ability to use Computer-Aided Design (CAD) within the context of a concurrent
design process to understand how everyday objects are designed, analyzed and created.
Emphasis placed on decision-making processes involved with creating geometry and
development of modeling strategies that incorporate intentions of designer” (North Carolina
State University, 2012).
Motivational Strategies Learning Questionnaire (MSLQ): The MSLQ is an 81-question Likert-type instrument that is designed to assess participants’ motivational
orientation and use of cognitive learning strategies (Salisbury-Glennon & Stevens, 1999).
Technology integration: The incorporation of technology resources and technology-based practices into the daily routines, work, and management of schools (Technology in
Schools Task Force, 2002).
Chapter Summary
The goal of the study was to understand how learner motivation, affective traits, and
instructional outcomes could be affected through the implementation of augmented reality in
an introductory engineering graphics course. The study was conducted in two introductory
engineering graphics sections during the spring semester in 2013. The augmented reality
software, Augmentedev®, was used to model objects throughout the semester in six different assignments that increased in complexity for a total of six weeks. The MSLQ, PSVT-R, and
seven questions on the students’ experience using augmented reality were the three methods
of data collection used to determine the impacts of augmented reality. The MSLQ was used
to determine if the inclusion of augmented reality affected the motivational attitudes of
students, the PSVT-R was used to determine whether or not augmented reality improved
visualization skills, while the structured questions delved into the student experience of
CHAPTER TWO: LITERATURE REVIEW
The purpose of the study was to investigate how learner outcomes could be affected
through the implementation of augmented reality in an introductory engineering graphics
course. The role of mixed reality within education was presented in the review of literature.
Mixed reality includes both augmented and virtual reality. The role of augmented reality
within education was further examined through the identification of relevant research studies,
prior methodologies, and the implications from the collection of these studies. In addition,
the role of mixed reality and other technologies within graphic communication education
were detailed. This included analyzing the use of new technologies in graphic
communications, their effect on spatial visualization, and resulting impact on student
motivation. The identification of multiple motivational strategies that connect the use of
augmented reality to improved learner outcomes in an engineering graphic course was then
detailed. The chapter concludes with a description of both the MSLQ and PSVT-R and by
providing the rationale for the use of each of the instruments in this study.
Mixed Reality
Mixed reality is defined as the merging of real and virtual worlds to create new
environments in which users can interact with virtual objects in real environments (Milgram
and Kishino, 1994) (Figure 2). The origins of mixed reality can be traced back to the rise of
computers and the Sensorama machine developed by Morton Heilig in 1962 (Strickland, 2007). This mechanical simulator recreated visual, audio, and sensory affects leading to the
Figure 2. Mixed Reality Spectrum (Milgram, Takemura, Utsumi, Kishino, 1995)
Virtual Reality in Education
The technological predecessor of augmented reality is virtual reality. Studies have
linked the use of virtual reality to increased motivation (Allison and Hodges, 2010; Lee et al.,
2010; Virvou, Katsionis, & Manos 2005), improved training (Sowndararajan, Wang, &
Bowman, 2008), and assistance in analyzing simple and complex problems (Roussou, Oliver,
& Slater, 2006). Augmented reality separated from the realm of virtual reality in the early
1990s, but they still share several of the same technologies. Figure 2 provides a visual
explanation of augmented reality in relation to the realm of mixed reality. Augmented reality
is a blend of real and virtual environments, with the real environment on one end of the
spectrum and virtual environment on the opposite end. In a virtual reality system the user is
completely immersed in a computer-created environment and there is no interaction with the
real world (Goldiez et al., 2004). The virtual world is then viewed through glasses or a head
perform tasks. The creation of augmented reality comes from the blending of virtual
information onto a real environment.
Similarities Between Virtual Reality and Augmented Reality
There are several similarities between augmented reality and virtual reality systems.
According to Kaufmann (2003) both augmented reality and virtual reality can be effectively
used in the classroom; however, additional research is necessary to determine how best to
implement these technologies. Due to the similarities between the two technologies, many of
the research findings on virtual reality are applicable to augmented reality and to the present
study. From a technical standpoint, both systems incorporate virtual imagery, require a
powerful computer for processing and graphics, and require a viewing device. Each system
uses a viewing device to immerse the user into a digital world where the user is able to
interact with the environment. These characteristics allow both technologies to be interactive
and immersive while providing information sensitivity (Yuen & Johnson, 2011).
Reasoning for Selecting Augmented Reality
Although virtual and augmented reality shares several of the same characteristics,
several differences exist as well. These differences coupled with limitations associated with
implementing virtual reality in the classroom provide the rationale for selecting augmented
reality as opposed to virtual reality for the present study (Pantelidis, 2010).
The major difference between the two systems is that in a virtual reality system the
entire environment is virtually created with no real world interaction (Goldiez et al., 2004).
The student becomes isolated from the outside world and is encompassed in a controlled
encompasses both real and virtual worlds (Biocca, Owen, Tang, & Bohil, 2006). The
seamless integration of real and virtual worlds allows students to work in the real world
while interacting with virtual objects.
Kaufmann and Schmalstieg (2002) noted that there has been no progress made on a
universal virtual reality system for educational purposes. There are several limitations to the
use of virtual reality in the classroom. In order to create effective virtual reality; the user’s
entire environment must be virtual. If the virtual environment is not fully immersive the
authenticity of the exercise can be hampered. Virtual reality software needs to be detailed
and immersive which takes a great deal of time and effort to be fully encompassed in a
virtual environment (Allison & Hodges, 2000). As a result, a virtual reality system can be
expensive to develop and implement (Pantelidis, 2010; Waller & Knapp, 1998). On the
contrary, augmented reality does not require an immersive environment and has a lower cost
of implementation (Goldiez et al., 2004). The only cost associated with the augmented reality
system used in this study was the iPads. The iPads used in the study were provided by the
media center at North Carolina State University. While the augmented reality software and
makers were downloaded for free from Augmentedev®. Since augmented reality combines
real and virtual environments there is not a need to completely develop a world in which to
use augmented reality. This makes the use of augmented reality more time efficient and cost
effective.
Augmented Reality in Education
Augmented reality has begun to capture the attention of educational researchers
reality within the field of education has been limited, but has been increasing in the past few
years (Klinker, Ahlers, Breen, Chevalier, Crampton, Greer, Koller, Kramer, Rose, Tuceryan,
& Whitaker, et al., 1997). The research that has been conducted crosses multiple content
areas, with disciplines ranging from engineering to science. The implementation strategies
for augmented reality have also varied greatly. Through these studies, researchers are
beginning to identify potential uses of augmented reality and design effective instruction that
incorporates this technology (Dunleavy et al., 2009; Fehrig, 2006).
Research Studies
Numerous studies have been conducted to examine the use of augmented reality in
education. Their primary focuses have been on motivation, spatial ability, and learning
experiences. These studies have been conducted across multiple content areas with varying
grade levels. Each of these studies detailed in the review of literature have advanced the field
of augmented reality and provided the blueprints for this study.
Several studies analyzed the influence of an augmented reality system on student
motivation in the learning process. These studies examined the effect through various
methods of implementation. Studies by Campos, Pessanha, and Jorge (2011) and Frietas and
Campos (2008) evaluated the effectiveness of an augmented reality game to enhance
learning. Larsen, Buchholz, Brosda, and Bogner (2011) examined the pedagogical
effectiveness of an augmented reality system in a science course to better understand
concepts. Di Serio et al. (2012) compared an augmented reality system to a traditional
presentation. Finally Allison and Hodges (2000) and Lee et al. (2010) looked at how a virtual
Multiple studies have explored the potential of augmented reality to positively affect
spatial visualization skills. Both Martín-gutiérrez, Saorín, Contero, and Alcañiz (2010) and
Medicherla, Chang, and Morreale (2010) explored the potential of augmented reality to
improve the visualization skills of mechanical engineering students. Huffman and Miller
(2012) attempted to determine if augmented reality blocks could be used as a visualization
tool.
Two foundational studies on the use of augmented reality to improve spatial
visualization ability were conducted by Kaufmann and Schmalstieg (2002) and Shelton and
Hedley (2002). These studies provided the initial blueprint for the inclusion of augmented
reality in the classroom while also promoting the potential benefits of augmented reality.
Both of these studies were instrumental in the development of self-designed augmented
reality software. Both analyzed the potential of augmented reality to influence the spatial
ability of students. Kaufmann and Schmalstieg (2002) created an augmented reality system
that required students to use spatial skills to solve problems. The study by Shelton and
Hedley (2002) examined the teaching of complex spatial concepts and content through the
use of augmented reality.
The use of augmented reality to impact student learning through manipulation,
experimentation, and engagement has been evaluated in several studies. Initially, studies
focused on the use of manipulation to allow users to analyze objects from multiple viewing
perspectives, virtually rotate objects, and use scalability to zoom in and out to examine
specific features. This led to studies on experimentation and engagement. A study by Núñez,
system can have on the learning experience through manipulation, experimentation, and
engagement.
The ability of augmented reality to assist in the learning process through
manipulation was examined in several studies. Studies by Chen, Chi, Hung, and Kang
(2011a) and Kaufmann and Schmalstieg (2003) used augmented reality to assist with 2-D
and 3-D objects and software. Both Sin and Zaman (2010) and Woods, Billinghurst, Looser,
Aldridge, Brown, Garrie, and Nelles (2004) had participants manipulate and interact with
virtual models. Allen, Regenbrecht, and Abbot (2011) examined how the ability of
augmented reality to rotate objects affected learning. Finally, Chen (2006) conducted a study
to understand how students interacted with augmented reality.
Multiple studies have examined the effectiveness of augmented reality in enhancing
the learning process through experimentation and engagement. Within these studies,
participants were able to use augmented reality as a visual tool to examine, compare, and
explore educational content. A study conducted by Salmi, Kaasinen, and Kallunki (2012)
provided a kinesthetic learning experience for the participants by allowing them to interact
physically and mentally with learning scenarios. This approach was shared by Kerawalla,
Luckin, Seljeflot, and Woolard (2006) who explored the potential for augmented reality on
inquiry based learning, and Banu (2012) who used an augmented reality system to create
interactive simulations to foster learning. Gelenbe, Hussain, and Kaptan (2005) used
augmented reality as an experimental tool to ask “what if” questions by allowing students to
view objects from multiple perspectives and then compare and evaluate results in order to
et al. (2008) researched how augmented reality can affect student engagement. Dunleavy et
al. (2008) highlighted the effectiveness of a mobile augmented reality system in a school
setting to engage learners through the provision of active learning while Núñez et al. (2008)
analyzed student engagement through the inclusion of augmented reality to solve problems.
The effect of augmented reality in assisting student learning by reducing the time
spent on tasks was examined in various studies by (Balcisoy, Kallmann, Fua & Thalmann,
2000; Biocca et al., 2006; Henderson & Feiner, 2009). Each of the studies incorporated
augmented reality in a different fashion. Balcisoy et al. (2000) incorporated an augmented
reality system into manufacturing, Biocca et al. (2006) into a guidance system, and
Henderson and Feiner (2009) in maintenance.
Methodology Strategies Utilized
The methodologies used in the studies analyzed in the review of literature varied
greatly. The combination of methodologies did not reveal a clear design plan for the
development of this study, but it did present several different possibilities. The studies
reviewed implemented augmented reality in several different content areas, including
multiple participants, with great variance in sample size, and incorporated several different
measures of assessment.
The compilation of studies revealed four educational content areas in which
augmented reality has been researched. The first content area examined was engineering
(Borrero & Márquez, 2011; Chen, Feng, Mo, Cheng, Guo, and Huang, 2011b; Huffman &
Miller, 2012; Martín-gutiérrez et al., 2010;). Another major content area was mathematics
descriptive geometry. Several studies explored the use of augmented reality in science.
(Frietas & Campos, 2008; Kerawalla et al., 2006; Larsen et al., 2011; Medicherla et al., 2010)
used augmented reality to teach science topics, Sin and Zaman (2010) experimented in
astronomy, and (Y. Chen, 2006; Núñez et al., 2008; Shelton & Headley, 2002) examined
chemistry. Studies by Di Serio et al. (2012) and Haley-Hermiz et al. (2012) examined the
role of augmented reality in visual arts. Finally, Salmi et al. (2012) and Woods et al. (2004)
used an augmented reality system to exhibit different museum artifacts.
The studies examined in the review of literature encompassed an extensive range of
grade levels and included both students and teachers. The range in grade level went from
kindergarten through college. Campos et al. (2011) worked with kindergarten students as
participants, while Frietas and Campos (2008) used second graders as the subjects in their
study. (Dunleavy et al., 2009; Di Serio et al., 2012; Kerawalla et al., 2006; Medicherla et al.,
2010) conducted their study on middle school students and Santan-Mancill, Garc’a-Ruiz,
Acosta-Diaz, & Juárez (2012) conducted research in a high school setting. (Chen et al.,
2011b; Haley-Hermiz, Connelly, Gasper, Scalone, Sceusa, & Staehler, 2012; Huffman &
Miller 2012; Martín-gutiérrez et al.; 2010; Núñez et al., 2008) all examined college students
in conducting their research. Finally, studies conducted by (Borrero & Márquez, 2011;
Larsen et al., 2011; Medicherla et al., 2010) used a combination of students and teachers as
participants.
The sample sizes within the studies varied greatly. There were multiple studies that
included small sample sizes of less than 30. The study conducted by Alves and Sánchez
Matcha and Rambli (2011) only had six participants. Additional studies had sample sizes of
greater than thirty. The study conducted by Shelton and Headley (2002) contained 34
subjects, while both Frietas and Campos (2008) and Di Serio et al. (2012) had subject counts
in the 60s. Salmi et al. (2012) had a total of 292 participants.
Throughout the numerous studies conducted, several different assessment strategies
have been incorporated. (Chen et al., 2011a; Di Serio et al., 2012; Martín-gutiérrez et al.,
2010; Sin & Zaman 2010; Sumadio & Rambli, 2010) used a combination of a mixed methods
approach. In their mixed methods approach both Martín-gutiérrez et al. (2010) and Sin and
Zaman (2010) incorporated a post-test questionnaire on usability. (Borrero & Márquez, 2011;
Salmi et al., 2012; Shelton & Headley, 2002) used quantitative research methods. Qualitative
methods were implemented by (Kaufmann & Schmalstieg, 2002; Larsen et al., 2011; Matcha
& Rambli, 2011; Núñez et al., 2008; Woods et al., 2004). Studies by (Campos et al., 2011; C.
Chen, 2006; Frietas & Campos, 2008; Martín-gutiérrez et al., 2010; Shelton & Headley,
2002; Sin & Zaman, 2010) incorporated a pre-post-test format.
A couple of additional themes emerged from the review of literature. (Banu, 2012;
Chen et al., 2011a; Frietas & Campos, 2008; Haley-Hermiz et al., 2012; Matcha & Rambli,
2011; Sumadio & Rambli, 2010) all incorporated an augmented reality prototype. The
augmented systems used in their studies were unique to that particular study and not
universal. Studies by (Sin & Zaman, 2010; Sumadio & Rambli, 2010; Woods et al., 2004)
made a point of including subjects with no prior experience working with augmented reality.
Finally, (Y. Chen, 2006; Medicherla et al., 2010; Núñez et al., 2008) used simple augmented
Implications Obtained From Studies
There were numerous implications relevant to this study identified in the review of
literature. The implications were gathered, analyzed, and categorized into three major
themes: The use of augmented reality as a motivational tool, as a means of improving spatial
visualization ability, and its impact on learning experiences. The findings provided the
foundation for the design of this study, and established the rationale for the research
questions. The results and implications also identified holes in the literature where additional
research is needed.
The effective use of augmented reality may lie in its use as a motivational tool to
enhance the learning process. The review of literature indicates that augmented reality is a
motivational tool when implemented in an educational setting. Several studies have shown
that the technology provides an immersive learning environment (Allison & Hodges, 2000;
Di Serio et al., 2012; Lee et al., 2010). Additional studies indicated that the ability to interact
with augmented reality was motivational (Campos et al., 2011; Frietas & Campos, 2008; Lee
et al., 2010; Serdar, Stevens, Ses, Esche, & Chassapis, 2007), and provides a learner centered
approach to instruction (Di Serio et al., 2012; Larsen et al., 2011). In addition, the design of
augmented reality allows for ease-of-use and enables technology to serve as a motivational
tool (Larsen et al., 2011; Lee et al., 2010; Martín-gutiérrez et al., 2010).
Immersion through the inclusion of augmented reality in the classroom allows
students to maintain higher levels of attention and interest in the content (Di Serio, et al.,
2012). Allison and Hodges (2000) and Lee et al. (2010) used an immersive virtual
reality were fascinated, enthusiastic, and motivated (Allsion & Hodges 2000) and that the
combination of realism and manipulation created from the inclusion of virtual reality was
interesting and motivating for the students (Lee et al., 2010).
Lee et al. (2010) demonstrated that students can become motivated and interested
through the combination of realism and manipulation provided through the inclusion of
augmented reality. Students who used augmented reality were motivated to learn, enjoyed the
experience, and showed increased curiosity (Campos et al., 2011). Evidence of the students’
motivation was observed as students refused to quit the game presented until the task was
complete (Campos et al., 2011). These findings were also evident in a case study conducted
by Serdar et al. (2007) which concluded that the inclusion of augmented reality in
engineering graphic course led to increased student interest and awareness. Freitas and
Campos (2008) indicated that augmented reality was effective at maintaining high levels of
motivation, had a positive impact on student learning experience, and promoted active
learning. They also found that augmented reality had a greater impact on the learning
experiences of weaker students (Freitas & Campos, 2008).
Augmented reality allows for a student centered approach to instruction (Di Serio et
al., 2012; Lamanauskas, Pribeanu, Vilkonis, Iordache, and Klangauskas, 2007; Larsen et al.,
2011). The ability to interact with models motivates students because they are actively
involved in the learning process. Di Serio et al. (2012) reported that students showed high
levels of engagement, were highly motivated, felt they had control of the activity, and could
explore topics on their own. Active student participation increases motivation, engagement,
The level of usefulness and ease-of-use is important for increasing motivational
attitudes of students who use augmented reality (Lee et al., 2010). Teachers indicated that the
augmented reality system simplified instruction and allowed students to become active
participants (Larsen et al., 2011). Larson et al. (2011) also concluded that for continued
integration, augmented reality needs to be user-friendly and reliable. A study conducted by
Martín-gutiérrez et al. (2010) highlighted that when designed effectively participants had a
positive attitude towards the implementation of augmented reality, were interested in the
technology, and considered it a useful tool.
However, implementation of augmented reality may increase motivation due to the
novelty effect. Allison and Hodges (2000) concluded that some of the enthusiasm
surrounding the inclusion of augmented reality might be associated to the novelty of the
technology. Di Serio, et al. (2012) also identified that the novelty of the technology may have
influenced their results.
The participants in the aforementioned studies were children and adolescents.
Campos, et al. (2011) used kindergarten students, Di Serio et al. (2012) middle school
students, and Freitas and Campos (2008) studied seven and eight year old students. Thus, the
effectiveness of application of augmented reality to older students in a college classroom
who have already established learning strategies needs to be determined.
Multiples studies have emphasized the ability of augmented reality to positively
impact spatial visualization skills. Studies by (Allen, et al., 2011; Y. Chen, 2006; Kaufmann
& Schmalstieg, 2002; Martín-gutiérrez et al., 2010; Medicherla et al., 2010; Núñez et al.,
tool to enhance the learning experience. Allen et al. (2011) noted that augmented reality
helped subjects visualize the intention of the design, while Y. Chen (2006) believed users
were able to visualize concepts and relationships that may not be evident when relying solely
on conventional methods. The study conducted by Núñez et al. (2008) indicated that students
had improved spatial intuition, a greater understanding of visual cues, and were able to better
understand complex 3-D structures. Shelton and Hedley (2002) indicated that augmented
reality was a powerful visualization tool that allowed students to explore content
interactively.
Additional studies have exposed augmented reality’s ability to impact the academic
performance of varying levels of visual learners. Y. Chen (2006) concluded that students
with both low and high visualization skills showed improvement as compared to those who
received no treatment. Building upon this, Frietas and Campos (2008) stated that augmented
reality had a much higher impact on weak and average students. Finally, Larson et al. (2011)
showed that augmented reality was able to reduce the learning curve when introducing new
content.
Multiple studies have touted the capabilities of augmented reality to enhance the
learning process through the ability to manipulate objects, provide the opportunity to
experiment virtually, and the engage in kinesthetic learning. Studies showed that augmented
reality can bridge the gap between formal and informal learning, as well as teacher-controlled
learning environments and student-controlled learning environments (Salmi et al., 2012). The
development of processing skills such as critical thinking, problem solving, and
communicating (Dunleavy et al., 2009).
Manipulation. Numerous studies have indicated that augmented reality allowed students to manipulate models to obtain views from multiple perspectives. Instead of relying
on a static image, users were able to manually rotate the 3-D object with their hands. Núñez
et al. (2008) highlighted the impact an augmented reality system can have on the learning
experience through manipulation. The study reported that students believed augmented
reality provided an advantage through the ability to interact and manipulate structures,
analyze models from multiple angles, and improve visual and spatial skills. A study by
Gelenbe et al. (2005) added to this finding by stating that students were able to view objects
from multiple perspectives in order to compare and evaluate results. In addition, students
noted that they were able to predict capabilities and limitations of their projects.
The ability to manipulate objects allows for student interaction while promoting
understanding of content. Shelton and Hedley (2002) indicated that augmented reality
intervention improved students’ conceptual and factual understanding. Kaufmann and
Schmalstieg (2002) concluded that the implementation of augmented reality allowed students
to view and manipulate objects in 3-D, while finding anecdotal evidence that exposure to
augmented reality led to a greater understanding of 3-D geometry concepts. Students enjoyed
interacting with the augmented models and were able to view the models from multiple
perspectives. In support of the above, Y. Chen (2006) and Chen et al. (2011b) reported that
the ability to virtually manipulate objects through augmented reality aided in understanding.
that by manipulating models students were able to visualize the intention of the design, and
that they would not have been able to visualize these concepts as efficiently without the use
of augmented reality.
Through manipulation, augmented reality allowed for the combination of visual and
sensory information that resulted in a powerful learning and cognitive experience (Shelton &
Hedley, 2002). The ability to naturally interact with the augmented models allowed the
students to gain a greater understanding of spatial relationships. Woods et al. (2004, p. 5)
suggested that through manipulation augmented reality “can clearly demonstrate spatial
concepts, temporal concepts and contextual relationships between both real and virtual
objects.” Sin and Zaman (2010) determined that participants naturally manipulated the
physical objects by ‘rotating’, ‘picking up’, and ‘placing and holding them’ allowing for an
engaging learning experience that increased academic performance by 46 percent.
Engagement and experimentation. The review of literature indicated that augmented reality allowed students to engage in the learning process and become active
participants through the provision of an additional method of instruction. This was
demonstrated in the study conducted by Salmi et al. (2012) who noted that augmented reality
can effectively provide ‘hands on’ experimentation. Through the ‘hands on’ approach,
participants were able to interact physically and mentally to explore the learning scenarios.
The teachers in the study believed the technology was an effective tool that connected
learning environments (Salmi et al., 2012). Adding to this finding were studies by Dunleavy
et al. (2009) and Núñez et al. (2008) that provided additional evidence of student engagement
Through the addition of augmented reality, students have been able to visually
compare and explore concepts. Di Serio et al., (2012) indicated that students enjoyed actively
exploring topics on their own through augmented reality. Students expressed their
satisfaction in regards to material used, the possibility of receiving information in different
formats, and the feeling of having control of the activity as they could explore the topics in
the order they chose and could revisit materials as needed. Through active exploration,
students became engaged in the learning process. The authors concluded that augmented
reality had a positive effect on learning outcomes through a learner-centered approach. The
study by Dunleavy et al., (2009) built on this idea by stating that participants in their study
described the learning exercises as engaging. Kerawalla et al., (2006) added to this finding by
noting in their study that exploring models in 3-D promotes inquiry based learning.
Augmented reality allowed participants to experiment with objects in order to obtain
a greater understanding of concepts. Gelenbe et al. (2005) used augmented reality as an
experimental tool to ask “what if” questions. As a result of this additional method of
instruction, participants were able to obtain a greater understanding of the problem. The
results of the study by Banu (2012) indicated that the combination of augmented reality,
sketch interpretation, and 3-D geometrical reconstruction techniques provided an interactive
learning experience and improved spatial ability by allowing participants to experiment with
Mixed Reality in Graphic Communication Courses
To determine if augmented reality was effective in improving learner outcomes, it
was implemented into an introductory engineering graphics course. An engineering graphics
course was chosen because courses within the field focus heavily on the use and development
of visualization skills, which were shown through the review of literature to be improved
through the use of augmented reality. In addition, an engineering graphics course was chosen
because Kaufmann and Schmalsteig (2003) determined that augmented reality’s
effectiveness cannot be analyzed in isolation. To analyze the effectiveness of augmented
reality the software needs to align with curriculum that could enhance the learning process.
In fact, Kaufmann and Schmalstieg (2003) believed substantial content needs to be
developed around augmented reality before the true effectiveness of the software can be
determined.
There is no universal method of instruction for introducing students to 3-D modeling
(Hartman & Branoff, 2005). Traditionally, engineering graphics used physical models and
textbooks to teach concepts, emphasize design, and define models. This singular approach
has changed with the advent of computers and influx of software to assist student
comprehension. As the processing power of computers continues to grow, more viable
methods for assisting modeling have become available. These advancements are important as
the majority of concepts taught in an engineering graphics course deal with 3-D objects or
concepts (Lieu, 1999). According to Howell (2004) both engineering graphics and
computer-aided design subjects are difficult to comprehend solely through the use of a textbook,
modeling instead of physical modeling to aid students visually. Augmented reality has
become the latest virtual technology to impact engineering graphics.
Studies conducted by (Y. Chen, 2006; Chen et al, 2011a; Haley-Hermiz, et al., 2012;
Huffman & Miller, 2012) have compared the use of augmented reality to traditional physical
models, with mixed results. Haley-Hermiz et al. (2012) suggested that the augmented reality
software provided a more positive experience as compared to the practical props method. In
contrast, were studies by Y. Chen (2006) Huffman and Miller (2012). Y. Chen (2006) found
that some students preferred the ability to virtually manipulate objects through augmented
reality while others preferred to interact and touch the physical models. Huffman and Miller
(2012) compared the use of augmented reality blocks to real physical blocks and found that
there was not a significant difference between the use of augmented reality blocks and real
blocks. Huffman and Miller (2012) did suggest that the use of more challenging blocks
should be used to gain a more accurate measure.
Equivalent findings were also reported by Chen et al. (2011a) who compared the
effectiveness of tangible, paper based, and augmented reality models in an engineering
graphics course. Students completed a paper based test using all three modeling formats to
transform 2-D images into 3-D objects. According to the test results, the augmented reality
model had minimal effects on transforming 2-D images into 3-D objects (Chen et al., 2011a).
They authors noted that although the augmented models allowed for manipulation, the
tangible models were more effective because they allowed students to physically touch and
participants believed the augmented reality model provided the same improvement as the
tangible models (Chen et al., 2011a).
There were several reasons why augmented reality was selected over traditional
physical models for this study. Y. Chen (2006) believed that augmented reality was more
convenient as a supplemental tool because it was portable, easy to make, and could display
complex models, while the physical models took time to assemble, were fragile, and clumsy
at times. Woods et al. (2004) provided the following rationale for choosing augmented reality
as opposed to physical models: the use of virtual objects was less restricting than physical
modeling, it can be animated and respond to user input, it can be modified and transformed,
it can be combined with other media, and is not necessarily constrained by the laws of
physics. Another reason for using an attractive technology is to draw the students' attention
and increase interest. According to Martín-gutiérrez et al. (2010) courses that students find to
be uninteresting have a high withdrawal rate, and can be avoided by using new technologies
such as augmented reality.
Spatial Visualization in Engineering Graphics
In engineering graphics, visual thinking serves as a means of communication and as a
tool of reasoning. This leads to the incorporation of visual thinking throughout the
engineering curriculum (Condoor, 1999). An important component of engineering graphics is
spatial ability. Because it has multiple implications, spatial ability continues to be actively
researched (Moehler, 2009). Several studies have highlighted the fact that spatial ability is an
important component for success in engineering courses (Strong & Smith, 2002; Burton &
who struggle in introductory engineering courses are more likely to fail, change majors, and
transfer from the program. Spatial ability skills contain five different components including
spatial perception, spatial visualization, mental rotations, spatial relations, and spatial
orientation. Augmented reality has the capability to allow for exploration of all of these
components.
It has been suggested that a greater emphasis should be placed on visualization skills
because these skills play an important role in engineering graphics courses (Alias, Black, &
Gray, 2002). The development of spatial visualization skills is heightened in an introductory
engineering graphics course because the course is the student’s first exposure to engineering
principles at the collegiate level and serves as a foundation course. In general, an
introductory engineering course consists primarily of first year engineering students (Crown,
2001). In an introductory engineering graphics course these skills are developed through
sketching, design, and computer based modeling. Nearly all of the topics encountered in an
engineering graphics course deal with 3-D objects or concepts, which are often difficult to
visualize. The ability to visualize is a powerful tool because it allows one to manipulate a
model, mentally understand a model, and develop models not yet created (Bertoline et al.,
2011).
Spatial visualization skills can improve over time. Potter (2009) concluded that a
student’s three dimensional spatial perception is trainable and will develop through the first
year at a university. In addition, visualization skills can be improved through teaching and
learning (Alias et al., 2002; Güven & Kosa, 2008). These studies indicated that spatial