THE MINIMUM NUMBER
O FGENES CONTRIBUTING
T O
QUANTITATIVE VARIATION BETWEEN
AND
WITHIN POPULATIONS
RUSSELL LANDEDepartment of Biophysics and Theoretical Biology, The University of Chicago, Chicago, Illinois 60637
Manuscript received August 8, 1980
Revised copy received August 28,1981
ABSTRACT
A procedure is outlined for estimating the minimum number of freely segregating genetic factors, n,, contributing to the difference in a quantitative character between two populations that have diverged by artificial or natural selection. If certain simple criteria are satisfied approximately on an appropri- ate scale of measurement, nE can be estimated by comparing the phenotypic means and variances i n the two parental populations and in their F, and F, hy- brids (and backcrosses). This generalizes the method of WRIGHT to genetically heterogeneous (or wild) parental populations, as well as inbred lines. Standard errors of the estimates are derived for large samples. The minimum number of
genes involved in producing a large difference between populations in a quan- titative trait is typically estimated to be about 5 or IO, with occasional values up to 20. This strongly supports the neo-Darwinian theory that large evolution- ary changes usually occur by the accumulation of multiple genetic factors with relatively small effects.
ESTIMATES
of the number of genes contributing to the variance of quantita- tive characters within and between populations are fundamental for the study of mechanisms of heredity and evolution. The multiple-factor theory of the inheritance and evolution of quantitative characters (reviewed byWRIGHT
1968, Ch. 15) holds that heritable variance in quantitative traits within populations is caused by the segregation of multiple genetic factors, and that large evolutionary changes in quantitative characters generally occur through the Darwinian process of accumulation of numerous genetic factors with individually small effects. This theory is supported by several types of evidence including (1 ) artificial selection experiments where populations evolve far beyond the limits of variation in the original base population (FALCONER 1960), (2) correlations of quantitative char- acters with multiple genetic markers introduced in crosses between divergent lines(DOBZHANSKY
1936,1951 pp. 220-227;SMITH
1937), and ( 3 ) patterns ofsegregation following hybridization between widely different lines, races or species
(WRIGHT
1968).A
variety of statistical techniques have been proposed for estimating the effec-tive (or minimum) number of genetic loci contributing to the difference in a metrical trait between two inbred lines grown in a common environment (e.g.,
SEREBROVSKY 1928;
FISHER,
IMMER and TEDIN 1932; STUDENT 1934; PANSE1940a,b;
WENG
1966,1968;TAN
and CHANG 1972; PARK 1977a,b). The original method ofWRIGHT
(in CASTLE 1921;WRIGHT
1952,1968) seems to be the sim- plest and most robust to deviations from the assumptions. WRIGHT’S method as- sumes that, with respect to all relevant loci, one line is fixed with alleles increas- ing the character of interest, and the other line is fixed with alleles decreasing it. This is most likely when the divergence of the populations was caused by SUS- tained artificial or natural selection o n the trait of interest or on some character(s) highly correlated with it genetically. Estimates of the effective or minimum num- ber of genes influencing such a trait are obtained by comparing the phenotypic means and variances of the character in parental, F,,F,
and backcross popula- tions. The requirement of inbred lines, which is sometimes violated i n practice, may produce unwanted complications of inbreeding depression on the mean and developmental stability of the lines.It is shown here that, with a more general interpretation, WRIGHT’S formulas for the effective number of genetic factors can still be applied to crosses between genetically heterogeneous (or wild) populations, This minimizes the extent of inbreeding depression and reduces the total time necessary to perform the experi- mental crosses. The effective number of genes estimated by this method can not exceed the number of chromosomal segments segregating independently in one generation, i.e., the “recombination index” of DARLINGTON (1937), which equals the haploid number of chromosomes plus the mean number of recombination events per gamete. In most higher plants and animals the number of recombina- tions is limited to one or a few per chromosome per generation, so that the re- combination index is usually on the order of a few times the haploid number of chromosomes (DARLINGTON 1937;
WHITE
1973, pp. 497-499;KING
1975a,b.c). The effective number of genetic factors is also related to an upper bound on the magnitude of the factor of largest effect. Selection theory indicates that the same procedures can be used to estimate the minimum number of genes influencing variation in a quantitative trait within a given base population, by hybridizing sublines artificially selected for a few generations to increase and decrease the character.ESTIMATORS O F THE EFFECTIVE NUMBER O F FACTORS
It is assumed that there is a scale of measurement for the character such that all of the genetic variance is additive. The two parental populations are assumed to have homologous gene sequences so that there is no post-mating reproductive isolation due to chromosomal rearrangements. Any number and frequencies of alleles are allowed a t each locus within the parental populations. The loci or
NUMBER O F GENES I N QUANTITATIVE VARIATION
TABLE 1
Contributions to the mean and variance of a quantitative character b y multiple alleles with additive effects at the i t h locus in parental and hybrid populations
543
~~
Variance
Population Mean
Pl 2sli 1 2ag
,
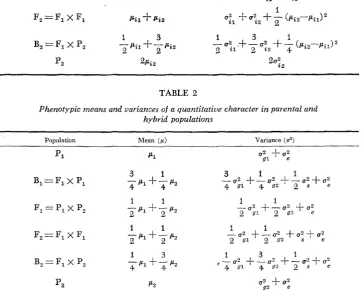
TABLE 2
Phenotypic means and variances of a quantitative character i n parental and hybrid populations
Population Variance ( u2)
F, := F,
x
F,1 1
- S L , + p 2
population is the sum over all n loci of the entries i n Table I, plus a nonheritable environmental component, U;, supposing that genetic and environmental effects
are independent.
The mean phenotypes and total genetic variances in the two parental popula- tions are written as
n
2 = 2
z
ff2Q l i=1 $1
populations as S i = p i 2
-
ptil, which is assumed to be of the same sign for all loci, the difference in the mean phenotypes of the parental populations is"
pz
-
p, = 2 .Zsi
= 2nS,
( 2 )% =1
in which
s
is the mean value of 86 averaged across all relevant loci. The extra genetic variance segregating in the F, population beyond that in the F, hybrids isFrom Table 2 and Figure 1, this can be estimated using the F, variance as
or
The later formula was preferred by
WRIGHT
(1952, 1968) because, if the en- vironmental variance in a population is related to its heterozygosity, weighting the parental and F, populations corresponding to the frequencies of their geno- types in the F, generation will partially account for this effect. Two further estimates based on similar reasoning and utilizing backcross data areand
I
1
-
[
a;,+
3
U;,+
-
0 %1
U; = U;
+
2 p2
.
From (2) and ( 3 ) , the actual number of factors contributing to the phenotypic difference between samples from the parental populations raised in a common environment is
The last term in parentheses, the squared coefficient of variation of the magni- tudes of the genetic factors, is generally unknown, but it must be positive, as noted by MATHER ( 1949, Ch. 6). Therefore, a n estimate of the minimum number
of genetic factors, using any one of the estimates of the segregation variance, is
I Z I (pp2 - p p l ) z / ( 8 ~ ~ ) 5 li
.
(6)N U M B E R O F G E N E S IN Q U A N T I T A T I V E VARIATION 545
the actual number of factors by decreasing the mean difference between the parental populations; in such cases it is even possible for an estimate of n E to be
less than one ( SEREBROVSKY 1928). Hence, this method is expected to be of little value when the range of genetic variation in the
Fz
population exceeds the mean difference between the parental populations.Linkage of loci influencing the character increases U: in equation (3) and
Table 2 by the amount%: (-
-
r c j )aisi,
where rti is the recombination rate be- tween locii
andi.
Hence, linkage does not distort the triangular pattern in Figure 1, but causes nE to underestimate further the actual number of genes, as shown byDEMPSTER
and SNYDER (1950). Previous models assuming inbred parental lines indicate that dominance and most types of genetic interactions are likely also to produce a downward bias in estimates of nE (WRIGHT 1968 Ch. 15), as wouldF,
or backcross “breakdown” entailing increased variance due to the segregation of aneuploid genotypes (ifPI
andP,
differ by chromosomal rearrangements) or from non-Mendelian or nongenetic causes.Standard errors of estimates: The sampling variances of estimates of the effec- tive number of genetic factors in large random samples can be approximated by expanding the estimators as Taylor series in deviations of the parental population means and segregation variance from their expected values, retaining only the first-order terms and taking variances (KENDALL and STUART 1976, Ch. 10.6). Employing standard formulas for the sampling variances of the mean and vari- ance of a normally distributed character in samples of size N
>>
1 (which, from a population with variance u2, are respectively u2/N and 2 u 4 / N ) , and utilizingindependence of the sample mean and variance for normally distributed popu- lations ( C R A M ~ R 1946, Ch. 27.4), gives finally
1
2
MEAN
ip)
MEAN
546
The standard error of an estimate of nE is the square-root of this expression. Corresponding to the four ways of estimating the segregation variance in equations
(4)
are the sampling variances(8a> Var [U:] -N 2ai2/NF 2 -I- 24.,/NF 1
1 1 1
Fr F 2 2 F1 F1 8 8
VarCa;] 2u4 / N
I-
-
u4/ N
+
-
U : ~ / N ~ ,+
-
ut2/Np,1 1
Var[ai] e 214~/N, 1
+
24,/NB2+
20; 1/NFl
+
u;,/Nplf
uti/Np,. (8d)These approximations are based on random sampling of unrelated individuals from each population. For the analysis of data obtained i n the form of full- (or
half-) sibling families, it can be noted that for each population in Table 2 half (or one-quarter) of the residual genetic variance originating within the parental populations occurs between families; the rest of the total phenotypic variance occurs within families. Estimates of U; and V a r r ~ , " ] can then be made most ac-
curately from formulas
(4)
and (8), using within-family variances and the appropriate sample sizes, i.e., total individuals minus number of families.Magnitude of the kading factor: The number of effective factors contributing to the difference between two populations also places a n upper bound on the proportion of the difference attributable to the factor of largest effect, p = 26,,,/
( m
- pp,). From ( 3 ) and (6)n E 5 (PP2 - pP,>"/(4s,",,,,) = p-?
,
hence, the maximum proportion of the difference between the parental popula- tions due to the leading factor is
which is identical to a formula of WRIGHT (1952, 1968). Thus, if the effective number of factors is not small, the proportion of the range between the two popu- lations explained by the leading factor can not be very large. As noted by WRIGHT,
experimental isolation of a leading factor with substantial effect can be accom- plished by repeated backcrossing to a parental strain with continued selection to prevent swamping by the parental type.
Eflectiue number of factors within a population: The same procedure can be
NUMBER O F GENES I N QUANTITATIVE VARIATION 547
on the character within a few generations such that the pattern of genetic variance is roughly conserved, u : ~ N ,:U
=
U:, then all of the S i have the same sign and Sicu: where c is a constant determined by the strength of selection. Using this rela- tion with (2), (3) and (6), a theoretical formula for the effective number of loci segregating within the original base population is
n
For a randomly mating population in linkage equilibrium, this is equivalent to the effective number of loci segregating within a population defined by LANDE
( 1977). This formula is of no direct use in analyzing data, but demonstrates that estimating nE from crosses between replicate populations artificially selected in opposite directions for a few generations does provide information on the effective number of genes segregating in the original base population.
For instance, WRIGHT (1968 pp. 379-381) analyzed results from an experi- ment in which hooded rats were selected to increase and decrease the extent of dark coloration in the coat. Crosses performed between the divergent lines after
5
and 10 generations of selection yielded estimates by the present method, using (4b) on transformed data in WRIGHT (1968), of 4.9 -C 0.8 and 8.2*
2.4 effective factors, respectively. This suggests that the original base population was segre- gating for an effective number of about5
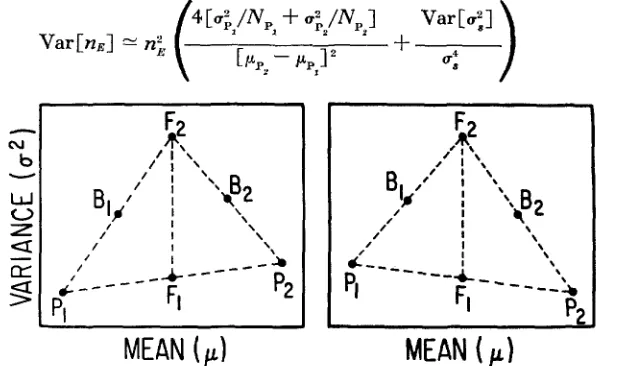
genetic factors and that another few genes were polymorphic for rare alleles that contributed little to the initial divergence, but substantially to later selection.Examples: Before estimating the effective number of factors and their standard errors in several examples of extreme changes in quantitative characters produced by artificial and natural selection, it may be well to restate the criteria for choice of a scale of measurement that must be satisfied, at least approximately, if the method is to be applied validly. These are (1) additivity of the mean phenotypes in F,, F, and backcross populations, (2) constancy o r linearity of PI,
F,
and P,variances plotted against their means, with the extra variance segregating in
backcross populations being half that in the F, (see Table 2 and Figure I )
,
and(3) standard errors are based on normality of the phenotype distributions in all populations. The second condition allows the environmental variance to differ between populations as a function of the mean phenotypes, along with the residual genetic variance originating within the parental populations.
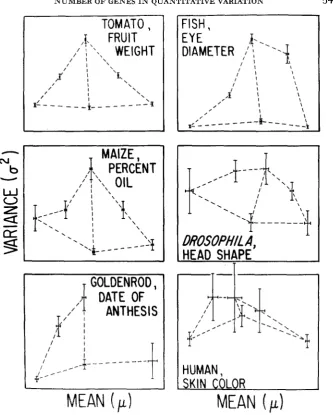
Data on crosses between races or species that differ greatly in a quantitative trait are given in Table 3 and Figure 2. These examples are representative of crosses between widely different populations that have (presumably) diverged by sustained natural or artificial selection. Examples meeting the above criteria were chosen to illustrate the influence of various sampling schemes on the standard errors of estimates of the effective number of factors. In each case, the difference in the mean phenotypes between parental populations is reported in units of
TABLE 3
Statistics for crosses between widely diuergent races or species
~ ~
Population N s U2 N P U2
Tomato, fruit weight (gm) Fish, eye diameter
log(x
-
0 153) XPI 420 -0.137 0.0165
Bl 932 0.249 0.0339
F, 475 0.710 0.0144
F2 932 0.653 0.0570
B2 93 1 1.163 0.0344
p2 456 1.689 0.0165
n, = 9.8 t 0.6 n3 = 9.1 t 1.1
n2 = 10.0 f 0.7 n4 = 11.1 f 0.8
Maire, percent oil In kernels l o g ( r
+
1 5 7 )30 2.10 0.0264 450 3.78 0.2190
30 5.09 0.0571
702 4.72 0.5628 142 6.21 0.4691 30 7.05 0.0220 n, I= 6.1 t 0.4
n2 I= 5.9 t 0.4
n3 = 7.0 I- 1.3 n4 = 5.0 k 0.5
Hawaiian Drosophila, female head \hape arctan(1iead width/head length)
Pl 22 0.513 0.00142
B, 68 0.670 0.00169
F, 20 0.8 17 0.00030
F2 146 0.804 0.00303
B2 74 0.972 0.00169
p2 19 1.122 0.00053
n, = 17.0 f 2.3 n2 = 19.4 f 3.1
n3 = 17.3 k 5.3
n4 = 22.0 t 5.0
Goldenrud date of anthesis date relative io Auguct P l 27 -2.93
Bl 79 6.24
F, 47 16.62
F, 95 16.72
B2
+
t
p2 5 44.20
n, #= 6.7 +- 1.5
n, .= 6.4 t 1.4
6.00 38.94 15.29 57.00
t
17.39t
t
20 1.157 0.000121 141 1.187 0.000155 37 1.197 0.000067 71 1.207 0.000159 123 1.224 0.000 121 20 1.234 0.000066
n4 = 6.4 k 2.1 n, ,= 8.1 t 2.8
n2 ,= 9.4 t 3.6
*
Human, skin color antilog reflectance at 685 m p 105 30 94 14 26 106 * *
0.421 0.001 09 0.382 0.00200 0.334 0.00159 0.346 0.00199 0.304 0.001 71 0.225 O.CQ105
*
n4 = 4.6 k 3.3
Sample sizes ( N ) , means ( a ) , and variances (u2) of the characters in parental and hybrid populations are given with estimates of the effective number of loci and their standard errors. Original data are from POWEM (1942), SPRAGUE and BRIMHALL (1949), GOODWIN (1944), WILKINS (1971), VAL (1977), and HARRISON and OWEN (1964). Scales for tomato and maize are from WRIGHT (1968) and for Drosophila from TEMPLETON (1977).
* Standard error exceeds estimate.
t
Backcross data not available.variance of P, and P,). Standard errors are calculated from total variances, assuming random sampling from each population.
549
NUMBER O F GENES I N QUANTITATIVE VARIATION
I
FISH,
DffOSOf~ILi,
HFAO
SHAPE
p
I IMEAN
( p )
HUMAN,
MEAN
( p )
FIGURE %-Transformed phenotypic means and variances plotted with standard errors, from the data on crosses summarized in Table 3.
550
mosome number of 10 and a recombination index of about 36 (DARLINGTON 1937), there is probably a considerably larger actual number of linked genes affecting the character.
GOODWIN ( 19%) hybridized two races of goldenrods, Solidago sempervirens,
from Maryland and Florida in which the mean date of anthesis of the first disc florets grown in a common environment differed by about six weeks, or more than
15 phenotypic standard deviations. Complete backcross information was not given, so ihat n3 and n4 can not be calculated. The F,,
F,
and B, populations con- form fairly well to the assumptions of the theory. Despite the rather small sample size of the P, population, the first two estimators imply a minimum of 6 to 7 genes, which is close to the haploid number of 9 chrom,osomes.WILKENS (1971) studied the inheritance of eye size in a cross between a cave fish with highly reduced eye; and its surface-dwelling relative with unreduced eyes. The mean eyeball diameters in samples from these populations grown under identical lighting conditions differed about 3-fold, o r more than 30 phenotypic standard deviations, although electrophoretic evidence indicates that these popu- lations may have diverged quite recently (AVISE and SELANDER 1972). The popu- lation means are nearly additive on the original scale, with little variance within the parental lines or F,. The relatively high variance in the B, population is re- flected in a strongly bimodal distribution (WILKENS 1971, Figure 6) suggestive of a n incipient developmental threshold for eye size. This biases the last two estimates of the effective number of genetic factors based on backcross variances, but together the estimates are reasonably consistent at a minimum of about 6 genes contributing to the difference in eye sizes.
VAL
(1977) and TEMPLETON (1977) analyzed two species of Hawaiian Dro- sophila that differed markedly in head shape, by about 8 phenotypic standard deviations i n females.D.
silvestris has a conservative head shape with little sexual dimorphism; whereas,D.
heteroneura has an extremely widened head with greater development in males. Electrophoretic similarity indicates a recent di- vergence time(VAL
1977). Because these species have a lek system of mating and are reproductively isolated by female mating preferences (CARSON 19781, it ap- pears that sexual selection on male head shape in D. heteroneura has acted through the pleiotropic effects of genes in the two sexes to produce a correlated response in female head shape (LANDE 1980). Much of the deviations of the F,and backcross populations from a simple triangular pattern in Figure 2 are probably accounted f o r by partial sex-linked inheritance of the character (TEM-
PLETON 1977), since data from only one reciprocal cross was utilized. (With sex- linkage and/or sex differences in recombination, pooling reciprocal crosses with equal weightings would theoretically restore the pattern of Figure 1 for females.) Modest sample sizes make the standard errors substantial, and that for n3 exceeds the estimate. With five major chromosomes (and one dot), no recombination in males, and some differences in inversion frequencies between species, the re- combination index is close t o 7 in this cross. Therefore, the effective number of 6
NUMBER O F GENES I N QUANTITATIVE VARIATION 551
For organisms that can not be experimentally hybridized, investigation is limited by the availability of (and ability to identify) naturally occurring hy- brids of different types. HARRISON and OWEN (1964) studied the inheritance of human skin color in populations of hybrids between various races of white Euro-
peans and black West Africans living in Liverpool, which differed by about 6 phenotypic standard deviations (reviewed by CAVALLI-SFORZA and BODMER 1971, Ch. 9.5). The small sample of
Fz
individuals has a mean not significantly different from the intermediateF,
population, but renders useless all estimates based on theF,
variance. Even the estimator n4, based on backcross rather thanFz
informa- tion, has a high standard error and merely suggests that the trait is influenced by a few or several genes rather than one.DISCUSSION
The data analyzed here are typical of crosses between races or species that differ greatly in a quantitative character as a result of artificial or natural selec- tion. The mean difference between populations grown in a common environment ranges from 6 to 30 phenotypic standard deviations. Estimates of the effective or minimum number of freely segregating genetic factors, nE, involved in producing these extreme differences are usually about 5 or 10, with occasional values up to 20. The standard errors account only for deviations due to sampling, but indicate that, when the assumptions depicted in Figure 1 are approximately satisfied, the estimates of n E will be reasonably accurate if the sample sizes of the parental and
F,
populations are at least 20 or 30 and those of theF,
and backcross populations are around 100 o r more. The analysis demonstrates that on the chosen scales of measurement multiple genetic factors with primarily additive effects are involved and that no single factor accounts f o r a majority of the difference between parental populations (eq. 9).These results strongly support the neo-Darwinian theory that large evolu- tionary changes in quantitative characters usually occur through the accumula- tion of multiple genetic factors with relatively small effects, because mutations with major effects almost universally have deleterious pleiotropic effects (FISHER
1958, pp. 4 1 4 ; WRIGHT 1977, Chs. 12, 13). Although a multitude of major mutations are known to geneticists and to plant and animal breeders (e.g.,
LINDS-
LEY and GRELL 1968; KING 1975a,b,c), there is a t present little evidence that single-gene mutations with major effects have been important in the evolution of natural populations.I thank S. 5. ARNOLD for stimulating discussions and J. A. COYNE, T. NAGYWKI, J. B. SPOFFORD,
S. WRIGHT and the reviewers for helpful criticisms. This work was supported by National Science Foundation grant DEB7909804, Public Health Service grant GM27120 and the Andrew W. Mellon Foundation.
LITERATURE CITED
AVISE, J. C. and R. K. SELANDER, 1972 Evolutionary genetics of cave-dwelling fishes of the genus Astyanaz. Evolution 2 6 : 1-19.
552
CASTLE, W. E. 1921
CAVALLI-SFORZA, L. L. and W. F. BODMER, 1971
C R A M ~ R , H., 1946 DARLINGTON, C. D., 1937
DEMPSTER, E. R. and L. A. SNYDER, 1950
DOBZHANSKY, TH., 1936
An improved method of estimating the number of genetic factors concerned
The Genetics of Human Populations. Freeman,
Mathematical Methods of Statistics. Princeton University Press, Princeton.
in cases of blending inheritance. Science 54: 223.
New York.
The biology of crossing-over. Nature 140: 759-761.
A correction for linkage in the computation of number of gene differences. Science 111: 283-285.
Studies on hybrid sterility. 11. Localization of sterility factors i n Drosophila pseudoobscura hybrids. Genetics 21 : 113-135.
-
, 1951 Genetics and the Origin of Species, 3rd edition. Columbia University Press, New York.FALCONER, D. S., 1960
FISHER, R. A., 1958 T h e Genetical Theory of Natural Selection, 2nd edition. Dover, New York.
FISHER, R. A., F. R. IMMER and 0. TEDIN, 1932 The genetical interpretation of statistics of the third degree in the study of quantitative inheritance. Genetics 17: 107-124.
GOODWIN, R. H., 1944 The inheritance of flowering time in a short-day species, Solidago semper- virens L. Genetics 29: 503-519.
HARRISON, G. A. and J. J. T. OWEN, 1964 Studies on the inheritance of human skin color. Ann.
Human Genet., Lond. 28: 27-37.
KENDALL, M. and A. STUART, 1976 T h e Advanced Theory of Statistics, Vol. 1. Distribution Theory, 4th edition. MacMillan, New York.
Handbook of Genetics, Vol 2. Plants, Plant Viruses and Protists. Plenum, New York. ___ , 197513 Handbook of Genetics, Vol. 3. Invertebrates of Genetic Interest. Plenum, New York.
-
, 1975c Handbook of Gengtics. Vol. 4. Vertebrates of Genetic Interest. Plenum, New York.The maintenance of genetic variability by mutation in a polygenic character with linked loci. Genet. Research 26: 221-235. The influence of the mating system on the maintenance of genetic variability in polygenic characters. Genetics 86: 485- 498. ~ , 1980 Sexual dimorphism, sexual selection and adaptation in polygenic
characters. Evolution 34: 292-305.
Genetic Variations of Drosophila melanogaster. Car- negie Inst. Wash. Publ. 627.
Introduction to Quantitative Genetics. Oliver and Boyd, London.
KING, R. C. (ed.), 1975a
LANDE, R., 1975
-, 1977
LINDSLEY, D. L., and E. H. GRELL, 1968
MATHER, K., 194.9
PANSE, V. G., 1940a
Biometrical Genetics. Methuen and C O , London.
Application of genetics to plant breeding. 11. The inheritance of quantitative characters and plant breeding. J. Genetics 40: 283-302. -, 194Ob A statistical study of quantitative inheritance. Ann. Eugenics 10: 76-105.
Theory f o r the number of genes affecting quantitative characters. I. Estima- tion of and variance of the estimation of gene number f o r quantitative traits controlled by additive genes having equal effect. Theoret. Appl. Genet. 5 0 : 153-161.
-
, 1977b Theory for the number of genes affecting quantitative characters. 11. Biases from drift, dominance, inequality of gene effects, linkage disequilibrium and epistasis. Theoret. Appl. Genet. 50: 163-172.The nature of the series of environmental variances and the estimation of the genetic variances and geometric means in crosses involving species of Lycopersicon. Genetics 27: 561-575.
An analysis of the inheritance of quantitative transgressive characters. Zeit. fur indukt. Abstam. Vererbungsl. 48: 229-243.
PARK, Y. C., 1977a
POWERS, L., 1942
N U M B E R O F GENES I N QUANTITATIVE VARIATION 553
SMITH, H. H., 1937 The relation between genes affecting size and color in certain species of
Nicotiana. Genetics 2 2 : 361-375.
SPRAGUE, G. F. and B. BRIMHALL, 194Q Quantitative inheritance of oil in the corn kernel. Agronomy Journal 41 : 30-33.
“STUDENT,” 1934 A calculation of the minimum number of genes in Winter’s selection experi- ment. Ann. Eugenics 6: 77-82.
TAN, W. Y. and W. C. CHANG, 1972 Convolution approach to the genetic analysis of quantitative characters of self-fertilized populations. Biometrics 28: 1073-1090.
TEMPLETON, A. R., 1977 Analysis of head shape differences between t w o interfertile species of Hawaiian Drosophila. Evolution 13 : 330-341.
VAL, F. C., 1977 Genetic analysis of the morphological differences between two interfertile species of Hawaiian Drosophila. Evolution 31 : 611-629.
WENG, T.-S, 1966 A note on the estimation of effective number of factors by means of proba- bility-generating functions. Botanical Bull. Acad. Sinica 7: 101-104.
-
,
1968 A fur-ther note on the estimation of the effective number of factors by means of probability- generating functions. Botanical Bull. Acad. Sinica 9: 10-14.
WHITE, M. J. D., 1973 Animal Cytology and Evolution, 3rd edition. Cambridge University Press, Cambridge.
WILKENS, H., 1971 Genetic interpretation of regressive evolutionary processes: studies on hybrid eyes of two Astyanaz cave populations (Characidae, Pices). Evolution 25: 53%544. WRIGHT, S., 1952 The genetics of quantitative variability, pp. 541. In: Quantitative Znhdri-
lance. Edited by E. C. R. REEVE and C. H. WADDINGTON. Agricul. Res. Council. H e r Majesty’s Stationery Office, London.
-
, 1968 Evolution and the Genetics of Populations, Vol. I. Genetic and Biometric Foundations. University of Chicago Press, Chicagu. 1977 Evolution and the Genetics of Populations, Vol. 3. Experimental Results and Evolutionary Deductions. University of Chicago Press, Chicago.Corresponding editor: W. W. ANDERSON