Using Magnetoelastic Testing for Mechanical Stresses Evaluation in Structural
Components
Silv6rio Ferreira da Silva JOnior and Julio Ricardo Barreto Cruz
Brazilian Nuclear Regulatory Commission (CDTN/CNEN), P.O. Box 941, Belo Horizonte, MG, Brazil
A B S T R A C T
Structural components of NPP are submitted to the influence of different factors such us temperature, corrosive environment and radiation fields. The combined effect of these factors allied to the presence of residual stresses and the stresses due to the inservice conditions have an extremely important influence on the components life and inservice behavior. To perform structural integrity and life extension programs, it is important to know the real stress state present in the component. In this context, the possibility to determine the stress state acting in a structural component by means of a nondestructive test method presents an important feature by the fact that it does not introduce any changes into the material tested. Amongst the available nondestructive testing method for stress measurements, the magnetoelastic test method presents advantages such as the possibility to perform measurements at high temperatures. This paper presents a study concerning to the use of the magnetoelastic method as a NDT for determining the stress state in ferromagnetic materials. The experiments were carried out in ASTM A-515 and ASTM A-36 steels, used for pressure vessels manufacturing. The results obtained have shown a good sensitivity to stress changes. The main restrictions and applications are discussed.
I N T R O D U C T I O N
Components structural integrity evaluation requests the previous knowledge of the stress state present in the component. Experimental stress determination is usually done using electric strain gages. The component is instrumented using resistive strain gages and from the strain measurements during load testing, hydrostatic testing or inservice operation condition, the values and directions of the principal stresses can be determined at the more critical regions. However, the use of this procedure presents some inconveniences. To assure the reliability of the results, the surface of the component should be submitted to a mechanical and chemical conditioning at the areas of interest in order to allow the correct fixation of the strain gages. After installed, the strain gages should be linked to the instrumentation responsible for the acquisition and conditioning of the signs generated during the component loading. A reasonable time is expended to carry out these procedures, sometimes implying in an extremely high cost for its accomplishment. Additionally, in those situations where the equipment operation temperature is elevated, the use of special strain gages and procedures can make unfeasible the accomplishment of the test.
A recent development for stress measurements in structural materials is the magnetoelastic testing, based on the Barkhausen noise analysis. Barkhausen effect originates from the interactions occurring between magnetic domain walls and pinning sites present into a ferromagnetic material during the magnetization process [1]. Magnetic domains are small areas present into a ferromagnetic material where the magnetization value is equal to the saturation magnetization value for the material. They are randomly oriented into the material in the demagnetized state. Under influence of a increasing magnetic field, the domains aligned in the directions close to the magnetic field direction tend to increase and those aligned in less favorable directions tend to disappear. This process occurs during domain walls motion through the material [2].
Magnetic domain walls motion is affected by the presence of structural discontinuities such as grain boundaries, inclusions, precipitates and mechanical stresses. They act as energy barriers to the domain walls motion, which occurs in jumps, from one pinning site to the another, as the magnetic field increases. This discontinuous motion promotes discontinuous changes in the magnetic flow, which can be detected by a coil positioned in the surface of the material. The electric pulses induced in the coil are denominated Barkhausen noise [3-5].
The mechanical stresses influence the distribution of the domains and the dynamics of the domain walls mo~ion through the magnetoalastic interaction [6]. In materials with positive magnetoestriction the presence of compression stresses reduces the intensity of the Barkhausen noise, the opposite occurring with the presence of tension stresses. Besides the elastic stresses, material hardness and microstructure also have influence in the intensity and characteristics of the Barkhausen noise [7]. Thus, it is necessary a carefully calibration of the test system to allow the use of this test method for stress measurements. An important characteristic of the magnetic Barkhausen noise generated into a ferromagnetic material is the dependence of the direction. Depending on the direction of the excitation magnetic field applied to the material, the resulting magnetic Barkhausen noise will present different values, due to the magnetocrystalline anisotropy [8,9] and this should be considered when using this test method for stress measurements.
The basic test system used for stress measurements consists of a probe that incorporates an electromagnet to apply the excitation magnetic field to the material and a coil, responsible by the magnetic Barkhausen noise (MBN) detection. This probe is linked to a microcomputer that controls the test parameters and the data acquisition process.
SMiRT 16, Washington DC, August 2001
Paper # 1825
METODOLOGY
Materials and Equipment
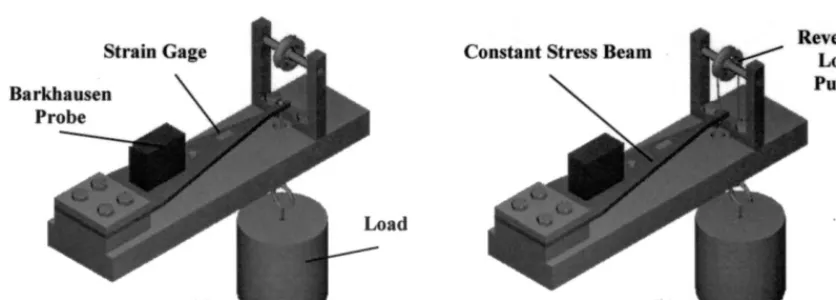
The experiments were carried out in ASTM A-515 and ASTM A-36 carbon steels, used for pressure vessels manufacturing. These materials presented a yield limit of 300 MPa in tension tests carried out according ASTM E 8 96. Two constant stress cantilever beams were machined from plates of these materials. The longitudinal axes of the beams are parallel to the rolling direction of the materials. After machining, the beams were submitted to a heat treatment for stress relief and instrumented with PL-10-11 (TML) strain gages. The strain gages were positioned with the longitudinal axis parallel to the longitudinal axis of the beams. The beams were assembled in a device designed to allow the generation of tension and compression stresses at the beams' surface using a dead load system. The Barkhausen detection probe was positioned parallel to the beams longitudinal axis. Fig. 1 shows the experimental set-up used in this study.
:eversing
Strain Gage Co Load
Barkhausen Pulley
Probe
Load
(a)
Fig. 1 Experimental set-up used to obtain tension stresses (a) and compression stresses (b) at the beams
surface,
Measurements of stresses were performed with the PL-10-11 strain gages at room temperature. The instrumentation for strain measurements includes a 4 ½ digit microvoltimeter and a power source with a 10 channel selector.
The magnetic Barkhausen noise generated during the experiments were measured using a Stresstest 20.04 test unit, that incorporates a probe for material excitation/magnetic Barkhausen noise detection.
Sensitivity to the Stress Changes
The stress state changes at the beams' surface were obtained through the changes in the loads applied at the beams' extremity. The probe used for material excitation and MBN detection was positioned so that the direction of the excitation magnetic field stayed parallel to the longitudinal beam axes. This direction coincides with the direction of the maximum principal stress acting and the rolling direction of the material.
For each load condition, the value of the resulting stress was determined from the readings of the strain gages. At the same time, the value of the corresponding MBN detected by the electromagnetic probe was registered. This procedure was done in order to cover the range between 80% of the yield limit in compression to 80% of the yield limit in tension, for the materials studied. The generated data allowed the obtaining of the curves relating the amplitude of MBN emitted by the material as a function of the stress state at the beams surface.
Angular Dependence
: ?i
• ~i!~i!ii !ii!ill ¸¸¸
" 2 1 0 0 ~ ~
• ~
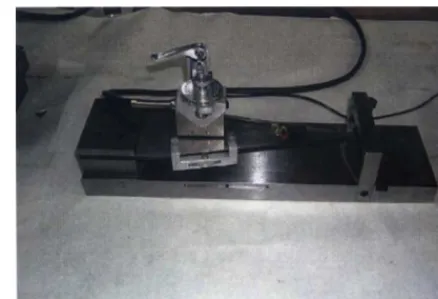
Fig. 2 Experimental set-up used to verify the angular dependence of the MBN.
EXPERIMENTAL RESULTS
Fig. 3 and 4 show the changes in the MBN as a function of the stress value at the beams' surface, for stress values from -200 MPa to 200 MPa. Beyond these values, the changes in the amplitude of the MBN were not significant.
2 1 0 0
' ~ 1800
o. 1500 < • ~ 1200 Z
9 0 0
6 0 0
300
0
- 2 0 0 - 1 5 0 -100 -50 0 50 100 150 2 0 0
i • i . i • i • i • i . i • i • i
/
I • I . I • I • I • I • I , I , I
- 2 0 0 - 1 5 0 - 1 0 0 -50 0 50 100 150 2 0 0
Stress (MPa)
1800
1500
1200
900
600
300
0
Fig. 3 MBN Amplitude as a function of stress value for ASTM A 515 Steel.
4000
~'~ 3500
= 3000
[.
"< 2500.m
= 2000
• ~ 1500
.~ 1000
s00
-200 -150 -100 -50 0 50 100 150 200 • t • I • I • I • I • I • I • t • I • 4000
3500
3000
250O
2000
1500
1000
! ~ 51111
• I • I . I • I . I • I I l I l i I i
-200 -150 -100 -50 0 50 100 150 200
Stress ( M P a )
Fig. 4 MBN Amplitude as a function of stress value for ASTM A 36 Steel.
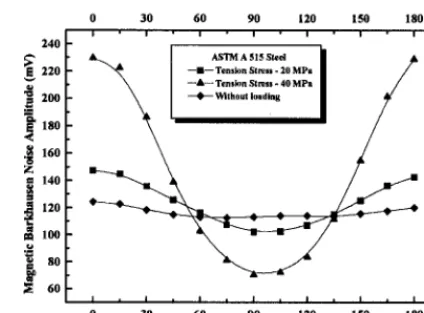
Fig. 5 and 6 show the changes in the MBN amplitude depending on the measurement direction for ASTM A 515 and ASTM A 36 carbon steels respectively. For both materials, measurements were carried out using the same test parameters. Additionally, the beams were loaded in order to generate tension stresses of 20 MPa and 40 MPa at the beams surface and new measurements were carried out in these conditions.
240
~ 220 ~ 2..
~
180160
= 140
~ 120
'~ SO
0 3 0 6 0 9 0 120 150 180
i • i i • i . i • i . i
/
. ASTM A 515 Steel ]&
" ~ --II-- Tension Stress - 20 MPa / --A-- Tension Stress - 40 MPa /
Without loading
. . . . 6 0 1 9 0 1 1 1 1 , I
0 30 120 150 180
A n g l e b e t w e e n M e a s u r e m e n t D i r e c t i o n a n d R o l l i n g D i r e c t i o n (°) - 240
220
200
180
160
- 140
120
100
8 0
60
Fig. 5 MBN amplitude as a function of the measurement direction for ASTM A 515 Steel.
300
~'E 280
260
~ . 240 E .< 220
r~ "~ 200 Z
18o -
j 160
140
12o ~, ,
1 0 0
80
-20 0
• i • i • • i • i • i • i • i • i • i •
• AS,.A 6S+ i
- - I I - - Without Loading I /
• i . i , i , i , i . i . I . i . i . i .
-20 0
20 40 60 80 100 120 140 160 180 200
- 300
280
260
240
220
200
- 180
160 0 140 0 120 100 80
20 40 60 80 100 120 140 160 180 200
A n g l e b e t w e e n t h e M e a s u r e m e n t D i r e c t i o n a n d R o l l i n g D i r e c t i o n (o)
Fig. 6 MBN amplitude as a function of the measurement direction for ASTM A 36 Steel.
R E S U L T S D I S C U S S I O N
The curves obtained, Fig. 2 and 3, representing the changes occurred in the MBN amplitude as a function of the stresses acting in the studied materials, demonstrate that this test method was sensitive to the stress changes in these materials.
For low values of tension and compression stresses, the curves presented a linear region where small changes in the stresses values promote large changes in the MBN amplitude.
Beyond values of 30% of tension and compression yield limit for these materials the sensitivity to stress changes diminishes.
Near 200 MPa in the tension and compression regions, corresponding to 2/3 of the yield limit for these materials, the MBN amplitude had no changes with the stress increase, suggesting these values as a limit for stress determination in these materials.
CONCLUSIONS
The magnetoelastic method was sensitive to the stress changes in the studied materials and can be used for stress measurements in the studied materials. However, the sensitivity of the test system was limited to values about 2/3 of the yield limit of these materials.
The MBN amplitude presented differences depending on the directions the measurements were carried out. It means that it is necessary to have a correspondence between the directions in which the calibration take place in a sample of the material to be inspected and the directions of measurements in the real components. Usually, the calibration is accomplished in the directions parallel and perpendicular to the rolling direction of the material and the measurements in the components also accomplished in these directions.
REFERENCES
1. Dhar, A., Jagadish C., Atherton, D. L., "Using the Barkhausen Effect to determine the Easy Axis of Magnetization in Steels", Materials Evaluation, October 1992, pp 1139-1141.
2. Cullity, B.D., Introduction to Magnetic Materials," Addison-Wesley Publishing Company, London, 1972.
3. Sipahi, L. B., Overview of Applications ofMicromagnetic Barkhausen Emissions Material Noninvasive Characterization Technique, Journal of Applied Physics, v.75, n.10, p.6978-6980, May 1994.
4. Kameda, J., Ranjan, R., Nondestructive Evaluation of Steels Using Acoustic and Magnetic Barkhausen Signals - I. Effect of Carbide Precipitation and Hardness, Acta Metallurgica, v.35, n.7, p.1515-1526, 1987.
5. Krause, T. W., Atherton, D. L., High-resolution magnetic Barkhausen noise measurements, NDT & AND International, v.27, n.4, p.201-207, 1994.
6. Devine, M. K., The magnetic Detection Material of Properties, JOM, p. 24-29, October 1992.
7. Pasley, R. L., Barkhausen Effect - An Indication of Stress. Materials Evaluation, p. 157-161, July 1970.
8. Dhar, C., Atherton, D. L., Jagadish, C., Using the Barkhausen Effect to Determines the magnetic Easy Axis of Magnetization in Steels. Materials Evaluation, p.1139-1141, October 1992.
9. Silva Jr., S. F., Mansur, T. R., Palma, E. S., Vilela, J.J., Oliveira, W., Determina~.o da Dire~.o de Lamina~o em Materiais Ferromagn6ticos pelo Efeito Barkhausen, Confer~ncia sobre Tecnologia de Equipamentos - COTEQ 99, p 109-
112, August 1999.