NUMERICAL ANALYSIS
O F WEAK
RANDOMDRIFT IN
A
CLINEMITCHELL LUSKIN
Department of Mathematics, University of Michigan, Ann Arbor, Michigun 48109
THOMAS NAGYLAKIt
Department of Biophysics and Theoretical Biology, The University of Chicago, 920 East 58th Street, Chicago, Illinois 60637
Manuscript received June 20, 1978 Revised copy received November 11, 1978
ABSTRACT
The equilibrium state of a diffusion model for weak random genetic drift in a cline is analyzed numerically. The monoecious organism occupies an un-
bounded linear habitat with constant, uniform population density. Migration is homogeneous, symmetric, and independent of genotype. A single diallelic locus with a step environment is investigated in the absence of dominance and muta- tion. The ratio of the variance of either gene frequency to the product of the ex- pected gene frequencies decreases monotonically to a non-zero constant. The correlation between the gene frequencies at two points decreases monotonically to zero as the separation is increased with the average position fixed; the de- crease is asymptotically exponential. The correlation decreases monotonically
to a positive constant depending 011 the separation as the average position in- creasingly deviates from the center of the cline with the separation fixed. The correlation also decreases monotonically to zero if one of the points is fixed and the other is moved outward in the habitat, the ultimate decrease again being exponential. All the results are parameter free. Some asymptotic
formulae are derived analytically.
a recent paper (NAGYLAKI 1978a), the biological importance of random ':enetic drift in a cline was briefly discussed, previous work was reviewed, and a diffusion model was developed. The diffusion treatment requires that the selection coefficient, s, the variance of the migrational displacement, 2, and the reciprocal of the population density, l/p, be all small and of the same order of magnitude (NAGYLAKI 1978b), and yields the following results (NAGYLAKI 1978a). For most selection gradients, s, u2, and p appear combined only in the single dimensionless parameter
8,
the ratio of the characteristic length for migra- tion and random drift to the natural distance for migration and selection. Random drift is highly significant ifp
<<
1;
it causes only relatively small variations of order 1//3 around the deterministic cline if8
> >
1.With
p
> >
1, the correlation between the gene frequencies at any two points is very nearly independent ofp ,
and hence is parameter free for particular forms of the selection gradient. For a very steep selection gradient,p
= 2dZpu, i.e., essentially the product of thet Supported by the National Science Foundation (Grant No. DEB77-21404).
298 M. L U S K I N A N D T. NAGYLAKI
square root of the selection intensity and the neighborhood size. Thus, with weak selection a large neighborhood size is required for large
p .
Since the derivation of detailed analytic results appears to be quite difficult, we must resort to numerical methods. Such treatments of random drift in linear stepping-stone clines of finite length have been given by FELSENSTEIN (1975) and SLATKIN and MARUYAMA (1975). The latter authors’ study of large random drift in a cline is discussed in
NAGYLAKI
(1978a). Numerical exploration of this difficult problem, including a n investigation of the persistence time of a n allele in a n environmental pocket, will commence soon, Our computations in this note relate directly to FELSENSTEIN’S (1975) small random drift work.By combining parameters into the single quantity
8,
the diffusion approxima- tion enormously increases the range of parameters accessible to numerical analy- sis. This advantage is even greater with weak random drift, for then parameter- free results can be obtained for particular forms of the selection gradient.A
single calculation with a fixed value ofp
covers all possible values of s, U,, and pyielding that
8.
Furthermore, without the diffusion approximation, numerical investigation of parameter sets with weak migration and selection and high popu- lation density is not practicable.Our diffusion model is the limit of the following discrete scheme. A diploid monoecious population occupies a n infinite chain of equally spaced colonies. W e suppose migration is homogeneous, symmetric, and independent of genotype, and consider a single diallelic locus with alleles
AI
and A , in the absence of dominance and mutation. The generation starts with the same very large number of zygotes i n each colony. Selection and migration, occurring in succession, may alter the subpopulation sizes, but the latter must remain extremely large. Any biologically reasonable variation of the subpopulation numbers under selection, i n particular, no change (soft selection) and change determined by the mean fitness in each colony (hard selection), leads to the same diffusion limit(NAGY-
LAKI 1978b). Random genetic drift acts through population regulation, which
truncates each colony to the same finite number of adults. Each of these adults produces many gametes without fertility differences. These gametes fuse at ran- dom to form the next generation of zygotes, in Hardy-Weinberg proportions in each colony.
ANALYSIS O F RANDOM DRIFT 299 We investigate only the equilibrium state of the population. For the step environment, the characteristic convergence time to equilibrium is l/s
(NAGY-
LAKI 1978a). Our treatment will be restricted to the expected gene frequency in the cline and the covariance between the gene frequencies at two arbitrary points. Let us denote the mean allelic frequency at
x
byp ( [ ) ,
where5
= x/Z is a con- venient dimensionless spatial coordinate. We express the covariance between the gene frequencies atx
and y = 27 as a function, u ( z , w ) , of the dimensionless average positionz
= ([+
7)/2 and separationw
=(6
- 7)/2.Our approximation applies f o r weak random drift, defined by
/3
= 24%pu>>
1.Since the neighborhood size, pu, almost always seems to exceed 20 or 30, and is usually at least a few hundred
(WRIGHT
1978, Ch. 2), the approximation should be quite accurate unless selection is quite weak. With/3
>>
1, the average gene frequency is very close to the deterministic one(NAGYLAKI
1978a):(1) By the symmetry of the problem,
p ( - [ )
= 1 -p ( 5 ) .
We owe the deterministic solution to HALDANE (1948). Observe thatp ( [ )
increases monotonically from 1/2 to 1 as [increases from 0 to W .The covariance is approximately proportional to
l/p:
u(z,w) =@%(z,w)
with U independent of8
in the limit /3 -+ 0. Even in the discrete model, one cansee that the covariance is inversely proportional to the colony size (FELSENSTEIN 1975). Taking into account the symmetries U(-z,w) = u(z-w) = u ( z , w ) , we have the following boundary value problem for the parameter-free function U
(NAGYLAKI
1978a):U,-
+
u w u ,+
2f(z,w)
u = 0, z,w>
0, P a )f(z,w)
= 1-
2p(z+
w )
+
s g n (2-
w ) [I-
2p(z-
w)],
(2b)u,(O,w)
= 0 7 (2c)U W ( Z , O + )
+
p ( z )
[I-p(z>I
= 0 7 (2d)u(z,w) + 0 as z2
+
w 2 4 E, (2e)p (0
=-
(1/2)+
(3/2) tanh2 [ (5/2)+
tanh-1v'm]
,
6
2 0.in which the subscripts represent partial derivatives (e.g., uZz = a2u/8z2). Since the gene frequency has mean
p ( z )
and must be in [0,1], the maximum possible value of the variance v(z,O) isp ( z )
[l-
~ ( z ) ] . Hence, the ratio of these quantities. F ( z ) , is a good measure of random variation. We use the parameter- free entityThe correlation between the allelic frequencies at
x
and y,r ( z , w ) = u(z,w) [ u ( z
+
w,O) u ( z - w,0)]-1/2,(4)
300 M. LUSKIN A N D T. NAGYLAKI
If both points at which the gene frequency is measured are on the same side of the center of the cline and far away, i.e., z
-
w> >
I, it is easy to analyze( 2 ) asymptotically. As z 3 00, (1) yields
-
p ( z ) 1
-
b ~ ' , b =
6 ( 5 - 6+/2/3) 0.606. (5) Asz
-
wvalue problem ( 2 ) becomcs asymptotically
00, ( 2 ) informs us that f ( z , w ) 4 -2. Therefore, the boundary
us-"
+
Uww-
4u = 0, w>
0, (6a)u,(z,O+)
+
be--" = 0, (6b)u(z,w) -j 0 as z2
+
w 2
4 W. (6c)U (z,w)
-
ce-i-"-fiw, X2+
p2 =4.
Separation of variables shows that solutions of (6a) have the form
By dint of (6c), X
>
0 and p>
0. Enforcing (6b) for all largez,
we find X =1,
p=d3,
and c =b/+z
= 0.350. Thus,u(z,w)
-
0.350 c-"-vym as z -w
4 W. (7)Substituting
( 5 )
and (7) into ( 3 ) gives1
P F ( z )
4 I = 0.577 as z 4 m.d 3
Inserting (5) and (7) into ( 4 ) leads to the correlation
(9) We shall now present the standardized variance and correlation obtained from numerical solutioiz of ( 2 ) . We expect all the results to deviate at most by
1
%
from the (unknown) exact solution of ( 2 ) .
Figure 1 shows JBP ( z )
,
which decreases monotonically from a maximum valueP F ( 0 ) = 0.719 as z increases. The slope is zero at the origin because
P(-z)
=F ( z ) .
Note the precise agreement with the analytic result (8). Figure 1 isgenerally consistcnt with FEMENSTEIN'S (1975) calculatisons, but demonstrates that the slight rise in his variances at the extremities of his chain of colonies is an end effect.
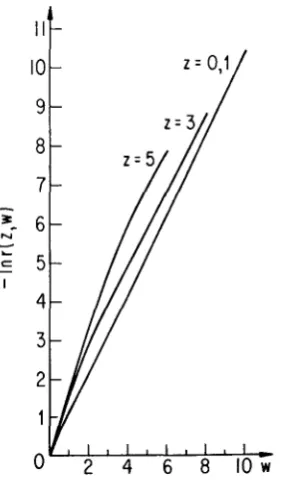
The monotonic decrease of the correlation for fixed average position, z, and variable separation, w , is displayed in F i p r e 2, which shows --In I ( Z , W ) plotted
against w. For large values of w, the following exponential approximations hold:
-
I ( Z , W )
-
e-v3w asz -
w 4 00.r(0,w)
=
I( 1,w)=
1.00 e1.0520,w
2 3,r(3,w)
=
0.426 e-*.00w, w 2 4,ANALYSIS O F RANDOM DRIFT
PF(z1
0.74
30 1
0.561,
,
, I I I,
,
I,
-
0
2
46
8
1 O zFIGURE 1.-The standardized variance as a function of position.
302 M. LUSKIN A N D T. NAGYLAKI
Observe that the decay rate decreases slowly with
z.
Plots of u(z,w) for various fixed values of z show very little departure from exponential decay, even for small w , and a slowly decreasing decay constant (as a function of z again) in theapparently pure exponential decay for large
w.
FELSENSTEIN
(1975) noticed approximate exponential decay of the correlation with separation.In
the neutral case with mutation, the correlation is independent ofz,
owing to spatial homo- geneity, and decays exponentially withw
( M A L ~ ~ C O T 1955;WEISS
andKIMURA
1965; NAGYLAKI 1976; SAWYER 1977).
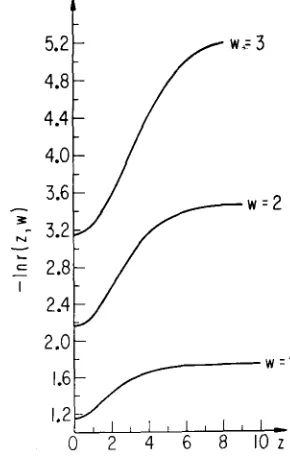
Figure 3 exhibits the monotonic decrease of the correlation as a function of the average position, z , for various values of the separation, w. The curves are hori- zontal at z = 0 because r(-z,w) = r(z,w). The constant limits as z + 00 agree
with (9).
FELSENSTEHN
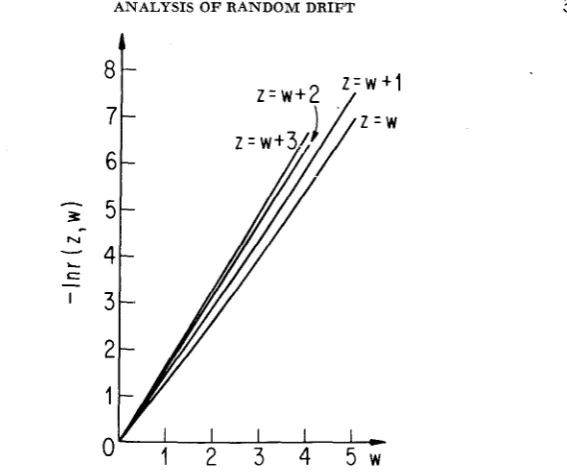
(1975) obtained a slight dip in the correlation between nearest neighbors at the center of the cline. Our diffusion results do not show this nonmonotonicity, but otherwise have the same qualitative form as his computations.Suppose now that we fix one point at r] and vary the position of the other point,
&
moving it outward from r]. I n Figure4
we display r ( w+
7,w) for variousvalues of 7. The monotone decrease is very close to exponential throughout; for
r ] = 3 the results are already close to (9), which applies as 7 + W .
We thank JIM DOUGLAS, JR. and TODD DUPONT for supplying some subroutines and discussing the numerical analysis of this problem. We are grateful to WILLIAM H. REID for a helpful conversation concerning its asymptotics.
3.2
I
2.4
. w = 2
2.01
1.2 I 0 2 4 a 66 8 E 102 '
FIGURE 3.-The correlation as a function of average position for various fixed values of t h e
ANALYSIS O F R A N D O M DRIFT 303
FIGURE 4.-The correlation as a function of separation for various fixed locations of the point closer to the environmental transition.
L I T E R A T U R E CITED FELSENSTEIN, J., 1975
FISHER, R. A., 1950
HALDANE, J. B. S., 1948
M ~ C O T , G., 1955 Decrease of relationship with distance. Cold Spring Harbor Symp. Quant. Biol. 20: 52-53.
MAY, R. M., J. A. ENDLER, and R. E. MCMURTRIE, 1975 Gene frequency clines in the presence of selection opposed by gene flow. Am. Naturalist 109: 659-676.
NAGYLAKI, T., 1975 Conditions for the existence of clines. Genetics 80: 595-615.
--,
1976 The decay of genetic variability in geographically structured populations. 11. Theoret. Pop. Biol. 10: 70-82. -, 1978a Random genetic drift in a cline. Proc. Natl. Acad. Sci. U.S. 7 5 : 423-426. -, 19781, A diffusion model for geographically structured popu- lations. J. Math. Biol. 6: 376-3852. ~, 1978c The geographical structure of populations. In: Studies in Mathematical Biology. Edited by S. LEVIN. Mathematical Association of America, Washington.Asymptotic properties of the equilibrium probability of identity in a geo- graphically structured population. Advan. Appl. Prob. 9 : 268-282.
Genetic drift in clines which are maintained by migration and natural
Gene frequencies in a cline determined by selection and diffusion. Bio- selection. Genetics 81: 191-207.
metrics 6: 353-361.
The theory of a cline. J. Genet. 48: 277-284.
SAWYER, S., 1977
SLATKIN, M., 1973
SLATKIN, M., and T. MARUYAMA, 1975 WEISS, G. H., and M. KIMURA, 1965
WRIGHT, S., 1978
Gene flow and selection in a cline. Genetics 7 5 : 733-756.
Genetic drift i n a cline. Genetics 81: 209-222. A mathematical analysis of the stepping-stone model of
Evolution and the Genetics of Populations. Vol. IV. The University of Chi- Corresponding editor: W. J. EWENS genetic correlations. J. Appl. Prob. 2: 129-149.