Beef cattle distribution patterns on foothill range
A 3-year experiment designed to quantify the spatial and tem- poral utilization patterns of range sites by beef cattle on summer foothill range was conducted on the Wick Brothers Management Unit of the Wyoming Game and Fish Commission, 8 km w. of Arlington, Wyo. The grazing seasons, in replicate pastures, were from 15 July-9 August, 15 June-26 July, and 15 June-2 August in 1980,1981, and 1982, respectively. Daily observations were made of radio-telemetry collared cattle (3 per pasture). Cattle dispersion was constrained by the spatial distribution of water and slope. Across 3 seasons, 77% of observed use was within 366 m of water. Approximately 65% of the land area WPS beyond 723 m from water and sustained only 12% of observed use. Cattle concentrated use (79%) on slopes less than 7%. Consequently 35% of the area, on or surrounded by slopes >lO%, received only 7% of observed use. Loamy, grszable woodland and wetlandfsubirrigated range sites were most preferred and accounted for over 65% of observed use while occupying less than 35% of the land area. Overall, course upland, very shallow and shallow loamy sites were not preferred; however, site preference varied as areas further from water were utilized. Observed usewassigniticantly (P<O.lO)correlnted(r0.41 to 0.69) with standing crop and crude protein standing crop over various growth form characteristics of the forage component. Associated stepwise regression models accounted for44 to 73%ofthe variationin observeduseover the 1982 grazing season. As the forage complex became more similar, in terms of standing crop and crude protein content, significantly less (P<O.O5) variation in use was accounted for by the forage variables (O-37%). Key Words: plant community preference, slope sensitivity, water availability, seasonnl patterns
Achievingan equitable distribution of livestock use among areas and plant communities within a pasture is a major objective of grazing management practices (Holechek et al. 1989). Concen- trated use around water sources by cattle (Squires 1978, Gillen et al. 1984, Martin and Ward 1970) can lead to an eventual decline in range condition. Cattle prefer to use level to gently sloping terrain and avoid slopes in excess of 10% (Mueggler 1965, Cook 1966, Van Vuren 1982). Consequently, physiographically diverse ranges will have areas of over utilization adjacent to areas with under utilira- tion, because the negative interaction between slope and distance to water promotes over concentration ofuse on level areas adjacent to waterso~rces (Cook 1966, Roath and Krueger 1982b, Van Rees and Huston 1983).
Cattle prefer certain forage species and plant parts from the assemblage ofavailable forages within and among plant communi- ties (Arnold and Dud&ski 1978). These forage preferences often lead to over utilization of individual forage species and/or plant communities and then eventual decline.
WILLIAM E. PINCHAK, MICHAEL A. SMITH, RKHARD H. HART, AND JAMES w. WAGGONER, JR.
Abstract
JOURNAL OF RANGE MANAGEMENT 44(S), May 19%
\
.;
R5-l
\ \
i
-‘-‘- Intermittent Stream
L
Contour inter”*, 20 mFig. la. Bmge site eomposltion and locntion
of
water sources in pastures Bl and B3. Fig. tb. Topographic map of pastures Bt and BJ.t North
I
1 km
The combined effects of physiographic diversity, spatial distri- bution of water, and heterogeneity of plant communities on distri- bution patterns of cattle grazing foothill range have not been elucidated. Our objective in this experiment was to determine the effects of these abiotic and biotic factors on cattle distribution patterns on summer foothill range.
Materials and Methods
The study area is located on the 4,597 ha Wyoming Game and Fish Department’s Wick Brothers Management Unit, approxi- mately 8 km west-northwest of Arlington, Wyo. The grazing per- mit period was from 15 June to 15 October, with an 800 animal unit month (AUM) allocation. In 1980,10.6 km of rtwire, New Zealand type electric fence was built to facilitate implementation of a deferred rotation grazing system and establish replicate pastures Bl and B3 (Fig. la).
Elevations of the study pastures range from 2,340 to 2,640 m (Fig. lb). Topography is dominated by high rolling hills and benches in descending elevation paralleling perennial drainages. Aspects are dominated by NW, W, and SW facing slopes.
Annual precipitation averages 397 mm at Elk Mountain, 10 km west of the Wick Unit, most of which occurs as winter snow and early spring rains. Convective thunderstorms are characteristic of summer precipitation events. The 20-year average 0’ C frost-free period is 84 days f 15 days.
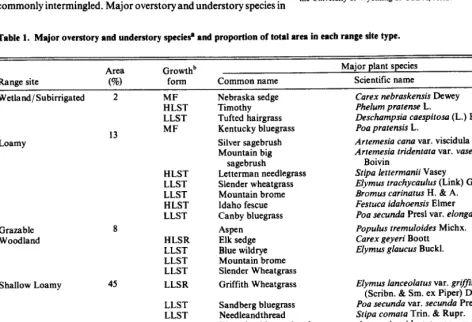
Major range sites were Wetland (WL), Sub-irrigated (SB), Loamy (LY), Grazable Woodland (GW), Shallow Loamy (SWLY), Coarse Upland (CU), and Very Shallow (VS). Wetland and SB sites were combined into WL/SB complexes because these are commonly intermingled. Major overstory and understory species in
each site type are given in Table 1. Figures la and b depict the spatial distribution of range sites and water and the topographic diversity of pastures Bl and B3, respectively.
Cattle Distribution
Throughout the experiment, pastures were lightly stocked (5.7 to 5.9 ha l AUM-‘) (Soil Conservation Service 1978) to facilitate animal expression of site preference. Each year, 3 animals (2 cows and 1 steer) per pasture were fitted with radio telemetry collars to facilitate daily observations of animal distributions on this foothill range. Collared animals and sub-herds not having collared animals were observed at least once daily. Observations were made during daylight hours (0600 to 2030) because we found very little night- time movement. A sampling day was divided into 3 periods, mom- ing (0600 to 1 lOO), mid-day (1101 to 1600) and evening (1601 to dark), which over the 3 grazing seasons accounted for 37,3 1, and 32%, respectively, of cattle observations. Employing this scan sampling design, across years 90 f 5% of the cattle in a pasture were accounted for at each observation.
Collared animals were located using a Telonics RDP21 receiver and a portable, 2-clement Yagi directional antenna. At each visual observation of collared animals and unassociated sub-herds, time, map location, range site type, activity, number of associated anim- als (within 183 m), their activity, distance from water, distance from shade, percent and length of slope, aspect, temperature, relative humidity, and wind speed and direction were recorded. Distance. from water and shade were estimated utilizing a Ranging
lMention of a trademarked product does not represent promotion or endorsement by the University of Wyoming or USDA, ARS.
Table 1. Major overstory and understory specie.@ and proportion of total area in each range site type.
Range site
Area (%)
Growthb
foml Common name
Major plant species
Scientific name
Wetland/Subirrigated 2 MF
HLST LLST
Loamy
Grazable Woodland
Shallow Loamy
Coarse Upland 26
Very Shallow 6
13 MF
8
45
HLST LLST LLST HLST LLST
HLSR LLST LLST LLST LLSR
LLST LLST
LLSR LLST LLST
HLSR HLSR LLST
Nebraska sedge Timothy Tufted hairgrass Kentucky bluegrass Silver sagebrush Mountain big
sagebrush
Letterman needlegrass Slender wheatgrass Mountain brome Idaho fescue Canby bluegrass Aspen
Elk sedge Blue wildrye Mountain brome Slender Wheatgrass Griffith Wheatgrass
Sandberg bluegrass Needleandthread Wyoming big sagebrush
Griffith Wheatgrass Sandberg bluegrass Needleandthread Mountain mahogany King spikefescue Ross sedge Griffith Wheatgrass
Carex nebraskensis Dewey Phelum pratense L.
Deschampsia caespitosa (L.) L%eauv. Poa pratensis L.
Artemesia cana var. viscidula Osterh. Artemesia tridentata var. vaseyana (Rydb.)
Boivin
Stipa lettermanii Vasey
Elymus trachycaulus (Link) Gould ex Shinners
Bromus carinatus H. & A. Festuca idahoensis Elmer
Poa secunda Presl var. elongata (Vasey) Dorn Populus tremuloides Michx.
Carex geyeri Boott Elymus glaucus Buck].
Elymus lanceolatus var. griffithsii (Scribn. & Sm. ex Piper) Dorn Pea secunda var. secunda Presl Stipa comata Trin. SL Rupr.
Artemesia tridentata var. wyomingensis (Beetle and Young) Welch
Cercocarpus montanus Raf. Leucopoa kingii (Wats.) Weber Carex rossii Boott
“Common and scientific names follow Beetle (1970) and Dorn (1988), respectively.
Table 2. Observed cattle use and preference of areas away from water within pastures across yearss.
Distance from Pasture Bl’ Year Pasture 83’ Year
water range m 1980 1981 1982
0- 183 .81b (P)’ so (P) .73 (P) .62 (P) .36 (P) 41 (P)
l&4- 366 .17 (P) .24 (P) .ll (P) .20 (P) .15 (P) .34 (P)
367 - 549 0 (A) .Ol (A) .05 (A) .04 (A) .09 (N) .lO (N)
550- 732 0 (A) .16 (N) .03 (A) .09 (A) .02 (A) .Ol (A)
733 - 1097 .Ol (A) .08 (A) .06 (A) .06 (A) .04 (A) .Ol (A)
1098- 1463 .Ol (A) .02 (A) .Ol (A) 0 (A) .14 (N) .Ol (A)
1464 - 1829 0 (A) 0 (A) .Ol (A) 0 (A) .03 (A) 0 (A)
1830 - 2195 NA’ NA NA 0 (A) .04 (A) 0 (A)
21% - 2743 NA NA NA NA .05 (A) 0 (A)
12744 NA NA NA NA .09 (A) 0 (A)
Observed AUDd 1180 2651 2656 1094 2030 2616
‘For ease of data presentation, the proportions of use were used in this table though the actual number of expected and observed AUD were utilized for x2 analyses. Calculated x2 for zone use among years within and across pastures (rows) and within pasture and year among zones (columns) are significant at P<O.Ot.
“Proportion of observed AUD in a zone.
‘P = preferred, A = avoided, N = no preference. Based upon Cl : observed AUD in a zone f I- =/2k, where K is the number of simultaneous comparisons (i.e. 10 zones). ‘Total observed AUD.
Inc.1 range finder and later verified with map coordinates. Percent slope was estimated and post-observationally verified utilizing an Abeny level. Similarly, length of slope was verified using a 100-m tape. Activity was classified into grazing, ruminating, walking, lying, and watering. Activity distribution among time periods indi- cated 64 to 75% of observed activities were grazing and 22 to 32% ruminating. There was no difference among time periods in these activities.
Each observation was weighted by the number of animals within 183 m of the collared animal or within 183 m of the centroid of a sub-herd. Weighting allowed quantitation of the magnitude of preference for a location and its attributes. Weighted values were defined as animal use days (AUD), which included all activities. If multiple collared animals were observed in a group, they were counted as a single observation. Subsequently, weekly and sea- sonal AUD and percent AUD were utilized to determine distribu- tion patterns.
Vegetation
Plant communities were mapped into range site types based upon SCS (1978) Technical Guidelines in 1979. Mapping resolu- tion was to .I-ha inclusions except for certain intermingled CU/SWLY and WL/SB complexes where proportions within a location were estimated. Twenty-five percent of the representatives of each range site in each pasture were selected for range condition determination in 1979. Condition ranged from mid-fair (40%) to high good (63%) across sites and was least around water sources.
During 1981 and 1982, approximately 100 g wet weight of the
‘Mention of a trademarked product does not represent promotion or endorsement by the University of Wyoming or USDA, ARS.
predominant grass species and select forbs (Table 1) from a repre- sentative of each range site type, in each pasture, was collected at IO-day intervals throughout the grazing period. Samples were frozen and later dried at 55’ C to a constant weight. Dry matter and moisture content were determined by difference. Crude pro- tein content was determined using a macro-Kjeldahl nitrogen technique (AOAC 1975) then multiplying percent nitrogen by 6.25.
In 1982, a 50 m X 100-m macro-plot was established in the same site representatives as previously sampled for forage quality. Standing crop of grasses and select forbs was estimated before, midway, and after grazing using the double sampling technique described by Wilm et al. (1944). On each date, twenty .25-m2 quadrats were randomly sampled within a macro-plot. Five to 6 plots were estimated and clipped by species; the remainder were estimated only and adjusted by a regression model of estimated weight to clipped weight generated for each site on each sample date.
A classification scheme was developed to describe standing crop in a currency which beef cattle might discriminate on, within and among range site types. Preferences exhibited by cattle for grass over browse and leaf over stem (Arnold and Dudzinski 1978) were the basis for classification. Forages were classified by growth form and relative 1eaf:stem ratio into 5 functional groups: mat forming (MF), high 1eaf:stem tufted (HLST), low leakstem tufted (LLST), high 1eaf:stem rhizomatous (HLSR), and low leakstem rhizomat- ous (LLSR) grasses (Table 1).
Standing crop in a pasture was estimated by first multiplying the acreage of a range site by the standing crop of that range site then summing across types. Standing crop of a range site as a propor-
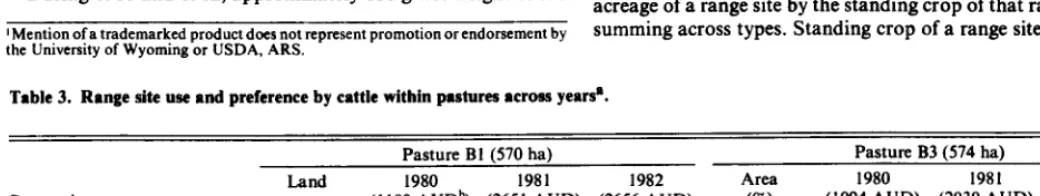
Table 3. Range site use and preferenee by cattle within pastures across yenrss.
Pasture Bl (570 ha) Pasture B3 (574 ha)
Land 1980 1981 1982 Area 1980 1981 1982
Range site area (I 180 AUDb) (2651 AUD) (2656 AUD) (%) (1094 AUD) (2030 AUD) (2616 AUD)
Coarse upland .27 .04= (A)d <.Ol (A) .Ol (A) .25 .20 (A) .05 (A) .02 (A) Shallow loamy .41 .27 (A) .28 (A) .27 (A) .48 .I5 (A) .32 (A) .32 (A)
Loamy .lO .44 (P) .34 (P) .41 (P) .16 .39 (P) .34 (P) .39 (P)
Very shallow .I2 .03 (A) .09 (A) .02 (A) .Ol 0 (A) 0 (A) .Ol (A) ,
Wetland/subirrigated .03 .16 (P) .18 (P) .16 (P) .Ol .18 (P) .08 (P) .07 (P) Grazable woodland .Ol .07 (N) .12 (P) .13 (P) .09 .08 (P) .22 (P) .19 (P)
'For ease of data presentation the proportion of expected use (and area %) and observed use were used in the table, however, the actual number of expected and observed AUD
were utilized in the ~2 analysis. Calculated chi-squares for range site use among years within and across pastures (rows) and within pasture and year among range sttes (columns) re significant at p<O.Ol).
gr otal observed animal use days (AUD). ‘Proportion of observed AUD.
dP = preferred, A = avoided, N = no preference. Based upon CI = observed AUD on a range site f 1 - / 2k, where K is the number of simultaneous comparison (i.e. 6 range sites).
Table 4. Relationships between cattle preference for range sites and distance from water over 3 grazing ‘*asons.
Zones” away from water
Range site Coarse upland
1 2 3 4 5 6 I 8 9 10
Pasture --- Pasture Pasture Pasture Pasture Pasture Pasture Pasture Pasture Pasture Year BI B3 Bl B3 Bl B3 BI B3 Bl B3 Bl B3 Bl B3 Bl B3 Bl B3 Bl B3
1980 -b + - q q - q + + + - .’ . nad na na na na
1981 _ t _ _ _ _ _ _ _ _ _ _ _ _ na _ na _ na _
1982 - - - + - - - . na . na . na .
Shallow loamy 1980 =I--+ - =. q _ _t na na na na na
1981 = _ q _ 1 _ _ _ t + - i : ; na ; na _ na =
1982 - - t - + - t - = - - + t - na . na . na .
Loamy 1980 t t - t + . - - - - na na na na na
1981 + - t = t + + t + - - ; r i na i na t na t
1982 + + + t - t - t q t - - - . na . na . na .
Very shallow 1980 - . + na na na na na
1981 = t _I 1 : I : - + i : i na i na _ na _
1982 - . - - + - + + - - . na . na . na .
Wetland/subirrigated 1980 + + - na . na na na na
1981 + - + ; 1 : ; : : : : ; : : na . na . na .
1982 + q q - + . - . . . - . . na . na . na
Grazable woodland l98Ot -- +. -. -- -- . . .na .nananana
1981 t t - - - + z/t - - _ na - na - na q
1982 t t - t - - - q - - . na . na na
‘Zones I through lOcorrespond to ranges of0-183,184-366,367-549,550-732,733-1097,1098-1463,1464-1829, 1830-2195,2196-2743,and>2743metersawayfromwater. b-, q , +; Avoided, expected, preferred within zone-pasture-year combinations; based upon CI=Proportion of observed AUD f I-/2K, where K is the number of simultaneous comparisons (IO zones).
;. ; Either kobserved use within a zone or range site did not occur in the zone.
, na ; Zone did not exist in year-pasture combination.
tion of the pasture standing crop was calculated by dividing range site standing crop by pasture standing crop. Functional group and crude protein standing crops within sites and pastures were calcu- lated in the same manner.
presentation. Arc-sine transformations were utilized when percen- tage data were analyzed. A protected Student-Neuman-Keuls test (SNK) was utilized for post-hoc mean separation (Zar 1974).
Results
Statistical AnalysesChi-square (x2) analyses were employed to determine whether cattle utilized (AUD) range sites, areas around water, and range sites within areas around water in accordance with availability. Heterogeneity of x2 analyses were used to test effect of pasture within and across years (Zar 1974). Chi-square analyses are sensi- tive to a large proportion of zero cells, hence, zones around water were delineated to minimize zero occurrences among years, yet retain maximum possible resolution. Consequently, zones were not equidistantly spaced away from water: Zones 1 through 4 were 183 m wide, Zones 5 through 8 were 366 m wide, and Zones 9 and 10 were 549 m wide.
Across all year and pasture combinations, significantly more (P<O.Ol) use occurred within 366 m of water than was expected (77% observed AUD vs. 1 l%expected AUD). Approximately 65% of the available land area lay beyond 723 m from water and sustained less than 12% of observed use. In terms of preference, areas within 366 mm of water were preferred while distances beyond that were avoided (Table 2).
Preference for range sites, zones around water, and site types within and among zones was calculated utilizing a Bonferroni Z simultaneous confidence interval (CI) approach described by Neu et al. (1974) and modified by Byers et al. (1984). A simultaneous confidence interval at l-a/2K, where K is the number of simul- taneous comparison, (i.e., site types 6; zones 7 to 10 etc.), was constructed around observed animal use. If expected use (E) was less than CI, conditions were preferred (P). If E was within the CI, conditions had no preference (N) and if E was greater than the CI, conditions were avoided (A).
The availability of water varied within pastures within and among years as watering locations became dry. Hence, the corres- ponding area of zones would expand or contract through time. The effects of these conditions were more pronounced in 1981 than 1980 or 1982, and in pasture B3 than pasture Bl (Table 2). During 198 1, observed use within 366 m was 40% and 27% lower (P<O. 10) than in 1980 and 1982, respectively. A concurrent increase in use occurred at distances beyond 732 m (Table 2). Changes in 1981 distribution patterns followed a winter where snowfall was 50% below normal, consequently, ephemeral drainages and some stock water locations were dry 3-4 weeks earlier than normal. A resul- tant 35% decrease (11% to 7% of the land area) of acreage within 366 m of water occurred.
Relationships between site preference and site attributes were analyzed by simple and Spearman rank correlation and stepwise regression analyses (Zar 1974). A general linear model split-split- plot AOV was used to test for temporal differences in the abiotic characteristics of observed locations (Hicks 1973). A split-plot AOV was utilized to determine temporal differences in forage, growth form, and weighted crude protein standing crop of range site types (Hicks 1973). Analyses were conducted utilizing actual AUD; however, results are given as percent of AUD for ease of
During 1981, distribution patterns in pasture B3 were more affected by changes in water availability than those in pasture Bl (Table 2). Four of 5 stock water locations were dry by June 25 in B3 whereas 1 of 3 was dry in pasture Bl. Presence of zones >2,195 m from water in 1981 and to less extent in 1982 indicates a major change in water availability from 1980. During 1981, 21% of the land area was beyond 2,195 m from water compared to an average of 10% over the course of the study. Associated with these changes
2500
z 2000 k f
I 3
E 1500 e
a E
lOOO-
2 P
500 1
lSSO-
1961-- 19lZ -..
O-: I
l’s i2 i9 6 13 20 27 3
JUNE JULY AUG
Fig. 2. Patterns of cattle dispersion away from water through time for the 1980-1982 grazing seasons. Mean f s.d.
pared to the average of 1980 and 1982.
As time into grazing season progressed, cattle utilized areas further away from water (P<O. 10, Fig. 2). No year of year X week interaction existed (ZPO. 10). After 3 to 4 weeks into the grazing season, cattle utilized areas increasingly further from water and variation about weekly means increased (Fig. 2). Concurrently, there was increased formation of sub-herd units from 1 or 2 initially, up to 6 at the end of the grazing season.
Averaged across years and pastures, cattle preferred slopes less than 4% (P<O.Ol), but were observed on slopes ranging from 0 to 40%. Over 90% of observed animal use occurred on slopes less than 7%. As a result, 20% of land area received no observed use by cattle over 3 grazing seasons.
Range Site Use Patterns
Observed cattle use of range sites was significantly (P<O.Ol) different from range site availability (Table 3). Individual site types varied widely in the amount of use sustained and their preference. Loamy sites sustained significantly (P<O.O5) greater AUD than other sites within and among pastures and years. Averaged across years, 38% of AUD occurred on LY sites. Similarly, cattle dis- played a marked preference for WLSB and GW sites over the course of the study. Wetland/subirrigated sites were preferred under all pasture-year combinations, whereas, GW sites were util- ized as expected during 1980 in pasture B3 and preferred under the remaining combinations (Table 3).
Cattle did not prefer SWLY, CU and VS range sites (Table 4). Shallow loamy sites occupied over 40% of the area in study pas- tures and were the dominat site type (Table 3). Even though SWLY sites were not selected for, over the course of the study these accounted for a significantly greater (P<O.O5) proportion of AUD
Table 5. Average forage standing crop, crude protein content, and crude protein standing crop among range sites during the 1982 grazing season-
Standing Crude Crude protein crop protein standing cro Range site (Kg l ha-‘) (%I (Kg CP l ha-‘)
Coarse upland 174 c’ 10.4 c 18c
Grazable woodland 252 bc 12.3 ab 31 bc
Loamy 292 b 12.7 a 37 b
Shallow loamy 283 b 10.6 bc 30 bc
Very shallow 181 c 12.2 b 22 c
Wetlandlsub- 911a 11.3 b 103 a
irrigated
lMeans within a column not having a common letter a~ different at Ko.05.
1250
1000
25C
C , --
l --
) --
$
I-
150
100
..’ +--1. ..’ ..’
-+._\. -..._
/’ ..’
2’ o-ecu .-
.aGW
!
T00
JUN JUL AUG
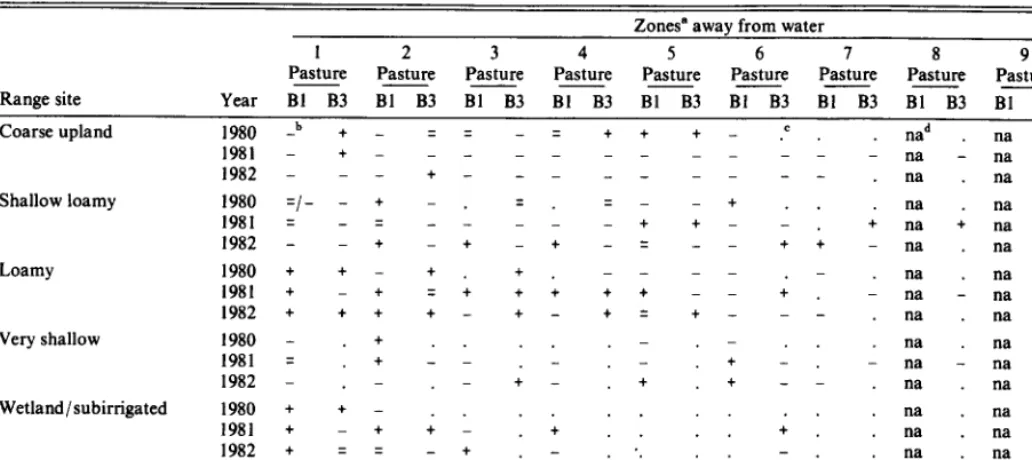
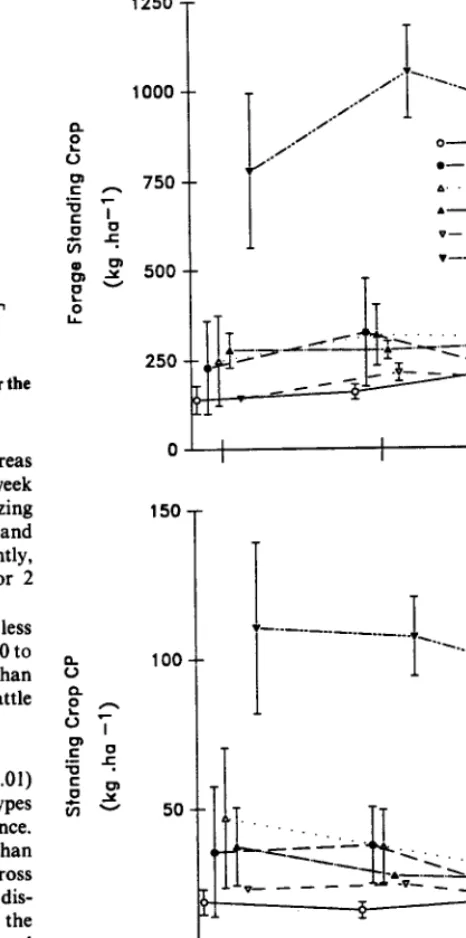
Fig. 3a. Preferred forage standing crop dynamics on range sites from 15
June through 10 August 1982. Fig. 3b. Crude protein standing eroP
dynamics on range sites from 15 June through 10 August 1982. Mean f
(2;dand 26% of AUD in pastures Bl and B3, respectively) than all but LY sites. Unlike CU and VS sites, the proportion of AUD on SWLY sites was remarkably consistent within pastures across years except pasture B3 and 1980 (Table 3). In this regard, SWLY sites were more similar to preferred than avoided sites. Coarse upland and VS sites on average sustained 5% of the AUD over the study period. Significantly less use was made of these sites than all other sites.
Yearly Patterns of Range Site Preference
While preference rating for a range site type remained relatively constant among years, significant changes occurred in the observed proportion of use on certain sites within and among pastures and years (Table 3). In 1980, a greater proportion of AUD occurred on CU sites than in either 1981 or 1982. Concurrently, proportional decreases of AUD on GW and SWLY sites were observed. Differ- ences in 1980 use patterns coincided with a grazing season delayed 1 month (15 July vs. 15 June) and ending 10 days later than in 198 1
Table 6. Average growth form standing crop and composition among range sites for the 1982 grazing season.
Growth form Mat Forming
Standing crop (Kg ha-‘)
Composition (%) High LeafStem Tufted
Standing crop (Kg ha’) Composition (%) Low LeaEStem Tufted
Standing crop (Kg ha-‘) Composition (%) High LeafStem Rhizomatous
Standing crop (Kg ha’) Composition (%) Low LeafStem Rhizomatous
Standing crop (Kg ha-‘) Composition (%) Forb
Standing crop (Kg ha-‘) Composition (%)
Wetland subirrigated
729 at 80 a
183a 20a
oc oc
oc oc
oc oc
Ob 0
Loamy
Ob Ob
63 b 21 a
19OC 63 a
21 b 9b
oc oc
18a la
Range site
Grazable Shallow Very Coarse
woodland loamy shallow upland
Ob Ob Ob Ob
Ob Ob Ob Ob
28 c SC 25 c 13 c
10 abc 2c 14 ab 7 bc
73 b 70 b 15C 14 c
32b 25 b SC 8c
133a <1 c 18b 4c
51 a <1 c 11 b 2c
oc 208 a 135 b 144b
OC 74 ab 68 b 83 a
17a Ob Ob Ob
la Ob Ob Ob
‘Means within a row without a common letter are different at p<O.OS.
and 1982. Furthermore, 1980 was the only year all stock water locations retained water throughout the grazing season.
Range Site Preference and Distance from Water Interaction
Cattle preference for certain range sites changed as cattle utilized areas further from water (Table 4). Year and pasture also affected range site preference within and among zones because range site composition of zones away from water changed as watering areas became dry. Insufficient occurrences of W 1Sb sites beyond Zone 2 precluded further analysis. Grazable woodland sites were more consistently preferred within 183 m than any other zone (Table 4). Use of VS sites was sporadic and tended to be either very high or zero. Associated preference ratings indicate that, as distance from water increased to between 366 m and 1,463 m, cattle at times exhibited preference for VS sites though no discernible trends were detected.
Loamy sites consistently sustained the most use across pastures
and year. Preference existed for LY sites up to 732 m from water. Consistent decreases in preference occurred beyond 732 m where LY sites occupied more severe topographic positions, though under certain conditions, these sites were still preferred (i.e.,>2,195 m from water).
Shallow loamy sites were not preferred at the pasture level; however, these sites were preferred under some year-pasture-zone combinations (Table 4). Generally, cattle displayed a greater pref- erence for SWLY sites in pasture Bl than pasture B3. Similarly, cattle did not prefer SWLY sites in pasture B3 within 732 m of water. Preference of SWLY sites within a zone was in part related to the range site composition of that zone. If a large proportion of a zone was CU or VS sites, then SWLY sites were usually preferred; however, if a larger proportion of the zone was SWLY, these were avoided.
Preference ratings of CU sites within a zone were a function of
Table 7. Simple correlations between observed ose, percentage of observed use, and intrinsic forage characteristics across and within months, 1982.
Correlation
Standing Crude CP Percent- Percent- Crop Protein Standing age of age of
(SC) (CP) Crop (kg* Pasture Pasture HLSr LLST” HLSR’ LLSR’
(kg*ha-‘) (%) CP m-1’) SC CPSC scb (%)SCC SCb (%)SCC SCb (%)SCC SCb (%)SCC Across months (n=30)
Observed AUD % Observed AUD By month (n=lO) JUNE
Observed AUD % Observed AUD JULY
Observed AUD % Observed AUD AUGUST
Observed AUD % Observed AUD
.51** .23 .56** .36*’ .42** .33* .21 .68* .69** .O5 -.03 .29 -.50**
,479’ .07 .41** .35* .40+* .2-I .I7 .57*+ .60** .a7 .Ol -.25 -.48**
39 .66** .56* .13 .23 .54 .50 .82** .98** -.06 -.07
.38 .69’* .54 .I3 .23 .55 .55* .78** .96** -.03 -.06
.68** .73-
.60* .61* ,678. .61*
.70** .64**
.33 .07 .78+* .72** .10 .03 .38 .I1 .14** .66** .I8 86
.61* .42
-.I1 -.05
.I3 -.02
.61* .98
.36 .44
.49 .I8
.42 -.02 -.Ol -.I5
.57+ -.52 .32 -.31
.lO -.lO .25 .14
-.45 -.64** -.46 -66**
-.19 -.42 -.22 -.45
-.21 -.43 -.14 -.32
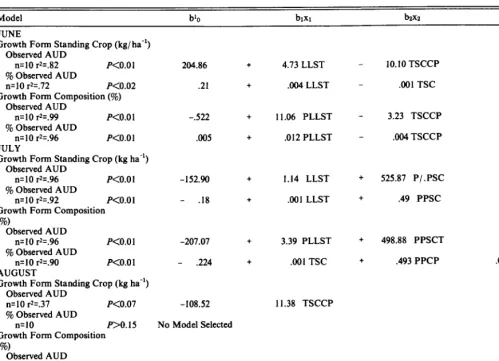
Table 8 .Stepwise regression analysis of relationships between observed use, percentages of observed use, and intrinsic fOrw characteristics of range sites throughout the 1982 grazing season. P<.15 for selection or rejection.
Model
Growth Form Standing Crop (kg l ha-‘)
Observed AUD
n=30 r2=.61 P<O.Ol
b’o bixl b&z b&s brX4
53.71 + .85 LLSTZ + 537.81 PPCP - .62 LLSR
9% Observed AUD .17 + .89 PPCP - .OOl LLSR
n=30 r2=.44 KO.01
Proportion of Standing Crop comprised
of a growth form (To)
Observed AUD n=30 r2=.73 P<O.Ol
155.45 + 535.47 PPCP - 2.84 PHLSR - 3.48 PLLSR + 8.24 CP
9% Observed AUD n=30 r2=.59 P<O.Ol
.31 t .64PPCP - .003 PHLSR - ,004 PLLSR
Ib.=intercept, b.=slope of variable n.
2LLSEStanding crop of low leafxtem tufted forages. PPCP=Standing crop percent of pasture crude protein. LLSR=Standing crop of low Ieafzstem rhizonatous forages.
PLLSR=Percentage of standing crop low leafzstem rhizomatous forages. PHLSP=Percentage of standing crop high leafzstem rhizomatous forages. CP=Average crude protein content (%) of the standing crop.
zone, pasture, and year (Table 4). Coarse upland sites within 366 m of water in pasture B3 were generally preferred or selected as expected whereas in pasture Bl, CU sites were avoided. There was only 1 instance, Zone 5, 1980, where cattle preferred CU sites in pasture Bl. Except in 1980, cattle avoided CU sites beyond 366 m from water.
Forage Attributes and Cattle Use of Range Sites
Across and within dates in 1982, the standing crop (Kg l ha-‘) of
preferred forages (PFSC) varied (P<O.O5) among range sites (Table 5 and Fig. 3). The PFSC on WLSB sites was greater, within and among dates, than on any other site. Whereas, the PFSC associated with VS and CU sites across dates was least. A signifi- cant date by range site interaction (PCO.08) (Fig. 3) was attributed to site specific changes in PFSC between July and August. Rank- ing of cattle preference for sites (Table 2) generally followed the same ranking as average PFSC (r. q .9 n = 6
P<O.
10) with cattlepreferring sites having greater PFSC.
Crude protein standing crops (CPSC) (Kg l ha-‘) varied in a
manner similar to PFSC across dates among range sites (Table 5). However, as evidenced by the absence of a date by range site interaction (Fig. 3), the seasonal dynamics of CPSC differed from PFSC. Overall, both PFSC and CPSC among sites became more similar as season advanced, though it was more pronounced and linear for CPSC. The rank correlation (r. = 1.0, n = 6, P<O.O5) between preference rank and CPSC rank was greater than for PFSC rank of a range site.
Growth form composition of the PFSC was significantly (P<O.O5) different among sites across dates (Table 6). Preferred sites (WLSB, LY, and GW) had significantly (P<O.OS) greater standing crops and proportion of standing crops of MF, HLST, and HLSR, respectively, than nonpreferred sites. While nonpre- ferred sites had greater (PCO.05) amounts and proportions of LLSR forages. The amount and proportion of LLST on LY and GW sites were greater (P<O.O5) than CU and VS sites. However, there was no difference between GW and SWLY sites in the amount and composition of LLSR.
Relationships between site use and site forage characteristics were temporally variable within and across time in the grazing season (Tables 7 and 8). Correlation and stepwise regression anal- yses were conducted after removal of WLSB sites and the MF growth variables because limited availability (<2% of the total land area) restricted expression of selectivity to short periods of
JOURNAL OF RANGE MANAGEMENT 44(3), May 1991
very high animal densities followed by long periods of low animal use. Seasonlong, site use (AUD and % AUD) was positively corre- lated to the amount and proportion of LLST standing crop, total PFSC, and crude protein standing crop (Table 7). The proportion of LLSR standing crop was negatively correlated with site use. Because significant (P<O.OS) autocorrelation existed between the standing crop of a growth form class and its associated proportion of PFSC, subsequent stepwise regression analyses were conducted utilizing either one or the other. Across dates (Table 8), models based on growth form porportion of standing crop accounted for more variation in observed use than models utilizing actual GF standing crop, though all models were significant (P<O.Ol). Approximately 73% and 59% of the variation in observed AUD and TO observed AUD, respectively, was explained by a combina- tion of growth form composition and crude protein variables.
Relationships between forage characteristics and site use varied as a function of time into grazing season (Table 9). Generally, as season progressed, the relationships between PFSC, CPSC and growth form composition deteriorated as these forage characteris- tics become more similar across range sites (Fig. 3). Hence, the greatest positive correlations between site use and the amount and proportion of LLST forages and the crude protein content of the forage occurred in June when use was negatively correlated to the proportion of LLSR forages. By August the proportion of observed AUD was not correlated with any measured forage char- acteristic. Similarly June and July regression models accounted for more (R* = .72 - .99) variation in site use than did August models (R* = 0 - .34) (Table 9).
Discussion and Conclusions
Observed distribution patterns on this foothill range were the integrated end product of water availability, physiography, and the range site mosaic. Water distribution appeared to be the major factor affecting cattle utilization patterns. As Valentine (1947), Squires (1978), and Van Vuren (1982) observed, there was a signifi- cant curvilinear decrease in observed use away from water across years and pastures. Cattle expressed preference for areas within 366 m of water and avoided areas beyond that. Gillen et al. (1984) reported comparable preference rankings from forested mountain range.
Distinct temporal dispersion patterns away from water existed (Fig. 2). Except in 1981, cattle observations were concentrated within 225 m of water 3 to 4 weeks into a grazing season, then
Table 9. Stepwise regression analysis of relationships between observed use, percentage of observed use, and intrinsic forage characteristics of range sites by month. P<.15 for selection or rejection of a variable.
JUNE
Growth Form Standing Crop (kg/ ha-‘) Observed AUD
n=lO rK82 P<O.Ol % Observed AUD
n=lO r*=.72 P<O.O2
Growth Form Composition (%) Observed AUD
n=lO r*=.99 P<O.Ol
% Observed AUD
n=lO r*=.96 P<O.Ol
JULY
Growth Form Standing Crop (kg ha-‘) Observed AUD
n=lO r*=.96 P<O.Ol
% Observed AUD
n=lO r*=.92 P<O.Ol
Growth Form Composition (%)
Observed AUD
n=IO r*=.96 P<O.Ol
% Observed AUD
n=IO r*=.90 P<O.O 1
AUGUST
Growth Form Standing Crop (kg ha“) Observed AUD
n=lO r*=.37
% Observed AUD P<O.O7
n=IO DO.15
Growth Form Composition (%)
Observed AIjD
n=lO r2=.37 P<O.O7
% Observed AUD
n=lO BO.15
204.86
.2l
-.522
.005
-152.90
- .I8
-207.07
- .224
-108.52
No Model Selected
-108.52
No Model Selected
4.73 LLST _ IO.10 TSCCP
.004 LLST _ .OOl TSC
I I .06 PLLST 3.23 TSCCP
.Ol2 PLLST .004 TSCCP
I.14 LLST
.OOl LLST
3.39 PLLST
,001 TSC
II.38 TSCCP
I I .38 TSCCP
+ 525.87 P/ .PSC .5308 TSC
+ .49 PPSC BOO8 TSC
+ 498.88 PPSCT .75 TSC
+ .493 PPCP .003 PLLST
‘b.=intercept, b.= slope of variable n.
*LLST q Standing crop of low leakstem tufted forages.
PPCP = Standing crop percent of pasture crude protein. LLSR = Standing crop of low IeaEstem rhizonatous forages.
PLLSR q Percentage of standing crop low leafzstem rhizomatous forages.
PHLSP = Percentages of standing crop high leafzstem rhizomatous forages. CP = Average crude protein content (%) of the standing crop.
presumably as available forage was depleted (Bryant 1982), cattle made use of areas further from water. During drought in 1981, cattle dispersed from water sooner and to a greater extent than in either 1980 or 1982, indicating forage resources were depleted more rapidly. Common to all temporal dispersion patterns was increased variation about weekly means of distance from water that was associated with increased formation of sub-herd units. Unlike Squires (1980), however, there was no evidence that groups of walkers and nonwalkers formed, because animals were observed to move freely among sub-herds.
were not physiographically constrained to these sites and a greater diversity of plant communities (range sites) existed within water and slope accessible zones. Furthermore, WLSB sites in this study were associated with ‘ephemeral streams and were neither as exten- sive or well developed as similar sites along perennial streams (Roath and Krueger 1982b). Hence, cattle use was intense for short time periods followed by extended periods of low animal densities.
The intolerance cattle have for moderate to severe slopes (Van Vuren 1982, Gillen et al. 1984) was reflected in the spatial distribu- tion of observed use on this foothill range. Over 3 grazing seasons cattle preferred areas with less than 4% slope. Sensitivity of cattle to slope is most pronounced in foothill and mountain regions (Mueggler 1965, Roath and Krueger 1983a, Gillen et al. 1984) though patterns of utilization by cattle on any landscape having significant topographic diversity will be influenced by slope (Moorefield and Hopkins 1951, Mackie 1970, Martin and Ward 1970).
Cattle preference for WLSB, LY, and GW sites was a complex function of forage production (Gillen et al. 1984, Hunter 1962), forage composition (Hunter 1962, Herbel et al. 1967, Senft et al. 1985), physiography (Cook 1966, Mueggler 1965), and season (Moorefield and Hopkins 1951, Stuth and Winward 1977, Salter and Hudson 1980).
Cattle demonstrated consistent preferences for range site types across pastures and years. Wetland and subirrigated sites, analo- gous to meadow types reported by Roath and Krueger (1982a, 1982b) and Gillen et al. (1984, 1985), were most preferred; how- ever, the proportion of observed use was less than reported by these authors. Unlike mountain landscapes, cattle on this foothill range
Assuming beef cattle attempt to maximize net energy (nutrient) capture (Senft et al. 1987), there should be a relationship(s) between intrinsic forage characteristics of range sites and site use (Hodder and Low 1978). Though forage characteristics of sites were measured only in 1982, we believe these were representative of the relative differences among sites over the study period. Sites receiving the most observed use also had greater average PFSC and CPSC than sites receiving less use, in agreement with Gillen et al. (1984), Miller and Krueger (1976), and Senft et al. (1985). Season-long indices of site use were significantly correlated to SC, CPSC, and abundance of LLST and LLSR growth form forages. Across the 1982 grazing season, more variation in actual and percent observed use was accounted for by a combination of growth form, standing crop, and crude protein variables. Though we do not propose cattle have euphagic wisdom, we interpret these results to indicate that not only is absolute forage standing crop an important characteristic for site preference but also the chemical and growth form composition of that standing crop as these affect caloric density of the diet. These results are consistent with the hierachial landscape utilization hypothesis forwarded by Senft et al. (1987).
Seasonal changes in the magnitude of correlations and predic- tive capability of regression models between site use and site forage attributes indicate a degeneration of these relationships by the end of the grazing season. These results are interpreted to suggest that as forage resources among sites became more similar, in terms of PFSC and CP, there was insufficient energetic advantage to cattle for discrimination among range site types. Again, these findings would be consistent with the hypothesis of Senft et al. (1987) concerning forage based cues.
Based on these and previously published results, we concluded uniform cattle dispersion across foothill and mountain landscapes is first constrained by the spatial distribution of water and physio- graphic complexity. Subsequently, within existing dispersion con- straints cattle utilize available plant communities based upon intrinsic forage characteristics that vary temporally. Finally, sea- sonal cattle use of extant foothill complexes can be predicted reasonably well from intrinsic forage characteristics.
Literature Cited
AOAC. 1975. Off. Anal. Chem. 1975. Official methods of analysis (1 Ith ed.). Assoc. Offic. Anal. Chem., Washington, D.C.
Arnold, G.W., and M.L. Dud&ski. 1978. Ethology of free-ranging domes- tic livestock. Elsevier Scientific Publ. Co.. New York. N. Y.
Beetle, A.A. 1970. Recommended plant names. Wyoming Agr. Exp. Sta. Res. J. 31.
Bryant, L.D. 1982. Response of livestock to riparian zone exlusion. J. Range Manage. 35:780-785.
Byers, C.R., R.K. Steinhorst, and P.R. Krausman. 1984. Clarification of a technique for analysis of utilization availability data. J. Wildl. Manage. 48: 1050-1053.
Cook, C. 1966. Factors affecting utilization of mountain slopes by cattle. J. Range Manage. 19:200-204.
Dom, R.D. 1988. Vascular plants of Wyoming. Mountain West Publ. Cheyenne, Wyo.
Gillen, R.L., W.C. Krueger, and R.F. Miller. 1984. Cattle distribution on mountain rangeland in northestem Oregon. J. Range. Manage. 37:549-553.
Gillen, R.L., W.C. Krueger, and R.F. Miller. 1985. Cattle use of riparian meadows in the Blue Mountains of northeastern Oregon. J. Range Manage. 38205-209.
Herbel, C.H., F.N. Ares, and A.B. Nelson. 1967. Grazing distribution patterns of Hereford and Santa Gertrudis cattle on a southern New Mexico range. J. Range Manage. 20~295-296.
Hicks, C.R. 1973. Fundamental concepts in the design of experiments. Holt, Rinehart and Winston. New York, N.Y.
Hodder, R.M., and W.A. Low. 1978. Grazing distribution of free ranging cattle at three sites in the Alice Springs district, Central Australia. Aust. Range. J. 1:95-96.
Holechek, J.L., R.D. Pieper, and C.H. Herbel. 1989. Range management principles and practices. Prentice Hall, Englewood Cliffs, N.J.
Hunter, R.F. 1962. Hill sheep and their pasture: a study of sheep grazing in southeast Scotland. J. Ecol. 50~651-680.
Mackie, R.J. 1970. Range ecology and relations of mule deer, elk, and cattle in the Missouri River breaks, Montana. Wildl. Monogr. 20.
Martin, S.C., and D.E. Ward. 1970. Rotating access to water to improve semi-desert range near water. J. Range Manage. 23:22-26.
Miller, R.F., and W.C. Krueger. 1976. Cattle use on summer foothill rangelands in northwestern Oregon. J. Range Manage. 29:367-371.
Moorefleld, J.G., and H.H. Hopkins. 1951. Grazing habits of cattle in a mixed-prairie pasture. J. Range Manage. 4151-157.
Mueggler, W.F. 1965. Cattle distribution on steep slopes. J. Range Man- age.. 18:255-257.
Neu, L.W., C.R. Byers, and J.M. Peek. 1974. A technique for analysis of utilization availability data. J. Wildl. Manage. 38:541-545.
Roath, L.R., and W.C. Krueger. 198211. Cattle grazing distribution and behavior on a forested range. J. Range Manage. 35:332-338.
Roath, L.R., and W.C. Krueger. 1982b. Cattle grazing influence on a mountain riparian zone. J. Range Manage. 35:1-&)-IO5
Salter, R.E., and RJ. Hudson. 1980. Range relationships of feral horses with wild ungulates and cattle in western Alberta. J. Range Manage. 33:266-271.
Senft, R.L., M.B. Coughenour, D.W. Bailey, L.R. Rlttenbousc, O.E. Sala, and D.M. Swift. 1987. Large herbivore foranina and ecological hierar- chies. Bioscience 37:789-799. _ -
Senft, R.L., L.R. Rittenhouse, and R.G. Woodmansee. 1985. Factors
influencing selection of resting sites by cattle on shortgrass steppe. J. Range Manage. 38:295-299.
Soil Conservatton Service. 1978. Technical guide, Sections 1 IE. USDA Soil Conserv. Serv., Casper, Wyo. (unnumbered) Major land areas: 10-14” nreciu. zone Hiah Plains southeast. 15-19” me&. zone. Foothills . . , and mountams southeast, and 20” plus precip. zone high mountains.
Squires, V.R. 1978. Distance trailed to water and livestock response. p. 431434. In: Proc. 1st Int. Range Manage. Cong. (ed. D.N. Hyder), Denver, Colo.
Stuth, J.W., and A.H. Winward. 1977. Livestock-deer relations in the lodgepole-pine-pumice region of central Oregon. J. Range Manage. 30:110-116.
Valentine, K.A. 1947. Distance from water as a factor in grazing capacity of rangeland. J. Forest. 45:749-754.
Van Rees, H., and G.D. Huston. 1983. The behavior of free ranging cattle on an alpine range in Australia. J. Range Manage. 36:740-743.
Van Vuren, D. 1982. Comparative ecologyof bison-and cattle in the Henry Mountains. Utah. J.M. Peekand P.D. Dalke. eds. In: Wildlife-Livestock Relationships Symp.: Proc. 10. Univ. Idaho,‘Forest Wildlife and Range Exp. Sta., Moscow.
Wilm, H.G., D.F. Costello, and C.E. Klipple. 1944. Estimating forage yield by the double-sampling method. J. Amer. Sot. Agron. 36:194-203.
Zar, J.H. 1974. Biostatistical analysis. Prentice Hall, Inc., Englewood Cliffs, N.J.