Beyond-mean-field correlations and the
description of superheavy elements
Paul-HenriHeenen1, a,BenjaminBally2,MichaelBender3, andWouterRyssens1
1PNTPM, CP229, Université Libre de Bruxelles, 1050 Bruxelles, Belgium
2ESNT, CEA Saclay, IRFU/Service de Physique Nucléaire, 91191 Gif-sur-Yvette, France 3IPNL, Université Lyon 1, CNRS/IN2P3, 69622 Villeurbanne, France
Abstract.The role of beyond-mean-field correlations from the restoration of broken symmetries and configuration mixing for the description of superheavy elements is illustrated.
1. Introduction
Self-Consistent Mean-Field (SCMF) models are one of the standard approaches to describe a wide range of phenomena in nuclear structure and dynamics [1]. They are the only available microscopic method that at present can be applied in a systematic manner to all bound atomic nuclei irrespective of their mass and their proton-to-neutron ratio. For superheavy elements (SHE) this method is even the only microscopic model presently available for large-scale studies [2–4].
In one way or the other, the product state that provides the solution of the SCMF equations always breaks some symmetries of the nuclear Hamiltonian, for example through deformation of the density distribution or the presence of BCS-type pairing correlations. This feature is at the heart of the predictive and explanatory power of the nuclear SCMF method, as it can be exploited to grasp correlations associated with collective degrees of freedom in an intuitive manner at moderate computational cost. The physical many-body states, however, are eigenstates of angular momentum, parity, proton and neutron numbers, which in general might all be broken by SCMF states. For some applications, however, it is important to restore the states’ quantum numbers within what is usually called a “beyond-mean-field method”. Exact projection on angular momentum, parity, and particle number then ensures that calculated energy spectra and transition moments for electromagnetic and other transitions can be unambiguously compared with experimental data. Similarly, for many nuclei the mixing of states with different intrinsic deformation is necessary for their correct description, for example to describe fluctuations in shape degrees of freedom or the wide-spread phenomenon of shape coexistence. Such mixing can be most easily achieved within the Generator Coordinate Method (GCM), which can be naturally combined with projection into a single framework [5,6].
The beyond-mean-field method that we use has already been applied to many regions of the nuclear chart [7–10]. A complete calculation proceeds in three steps. The first one consists in carrying out a set of mean-field calculations with suitably varied constraints on the shape of the nucleus. The resulting intrinsic wave functions are then projected on particle numbers and
aCorresponding author:[email protected]
-24 -22 -20 -18 -16 -14 -12 -10 -8 -6 -4 -2 0
Edef
(MeV)
140 144 148 152 156 160 164 168 172 176 180 184
static deformation energy
-24 -22 -20 -18 -16 -14 -12 -10 -8 -6 -4 -2 0
Ecorr
(MeV)
140 144 148 152 156 160 164 168 172 176 180 184
dynamic quadrupole correlation energy
Neutron numberN
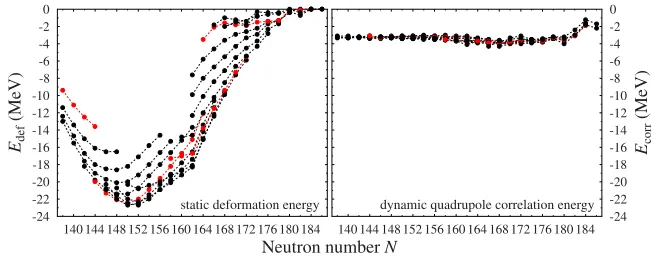
Figure 1.Static and dynamic deformation energies (see text) of heavy and superheavy nuclei around the valley of stability, plotted as a function of their neutron number. Lines connect nuclides within an isotopic chain. Those marked in red correspond toZ=90, 100, 110, and 120, see Fig.2.
angular momentum. Finally, the symmetry restored states are mixed. The final result of such a calculation is a spectrum of states in the laboratory frame of reference. In what follows, we will give a few illustrative results for properties of very heavy and superheavy nuclei obtained at the various stages of such method.
2. Systematic study of even-even SHE
A systematic beyond-mean-field calculation of even-even superheavy nuclei has been carried out under the same conditions as in the earlier study [7] that addressed the properties of
lighter even-even nuclei up toA≈250. The SLy4 parameterisation of the Skyrme EDF is
used throughout. The mean-field configurations are limited to axial shapes with conserved parity, which, after projection on good particle number and angular momentumJ=0, are then mixed within the GCM.
The resulting static and the dynamic deformation energies are plotted in Fig.1. The static deformation energy is defined as the difference between the binding energy obtained for the spherical mean-field configuration and the lowest energy found when allowing for deformed shapes. The dynamic deformation energy is the additional gain obtained for the
J=0+ground state after projection and configuration mixing, see also Ref. [7]. The static deformation energy can reach up to 22.7 MeV and varies quickly from one isotope to the other. By contrast, the variation of the dynamic correlation energy is less structured. As in earlier studies [4,11–13], spherical mean-field ground states are only found in the direct vicinity of the neutron shell closure atN=184, while nuclei with a proton shell closure,
which for SLy4 is at Z=126, are found to be deformed, with deformation energies of a
few MeV. As observed for lighter nuclei in Ref. [7], the dynamic correlation energy plays a crucial role only for transitional nuclei close to spherical shell closures, where it is of the same order or even larger than the static deformation energy. In such case, it might change the topography of energy surfaces and visibly modify binding energy differences [7].
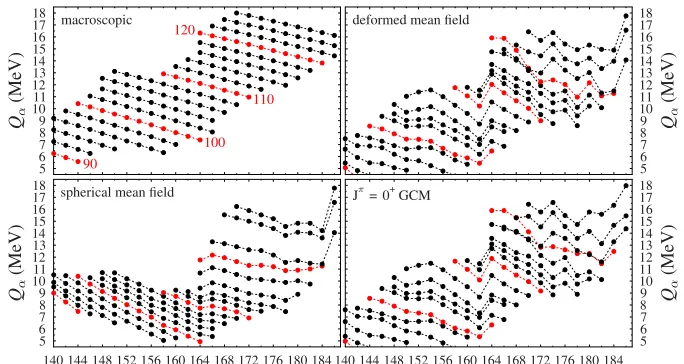
For superheavy nuclei, the most important binding energy difference is theQ value, which often is the first observable that becomes available for newly discovered nuclides. Figure 2 presents results for Q values obtained at four different levels of modelling.
The upper left panel shows Q values obtained from a liquid drop model (LDM) whose
5 6 7 8 9 1011 1213 1415 16 17 18
Q
(MeV)
macroscopic
90
100 110 120
5 6 7 8 9 1011 1213 1415 16 17 18
Q
(MeV)
140 144 148 152 156 160 164 168 172 176 180 184 spherical mean field
5 6 7 89 10 11 12 13 14 15 16 17 18
Q
(MeV)
deformed mean field
5 6 7 89 10 11 12 13 14 15 16 17 18
Q
(MeV)
140 144 148 152 156 160 164 168 172 176 180 184
J = 0+GCM
Neutron numberN
Figure 2. Q values obtained at four different levels of modelling (see text). Lines connect nuclides within isotopic chains. Those drawn in red correspond toZ=90, 100, 110, and 120 as indicated in the upper left panel.
The effect of spherical shell structure can be seen by comparing with the lower left panel that displays theQvalues obtained when imposing spherical symmetry on the mean-field states. When plotted as in Fig. 2, large jumps within an isotopic chain indicate a neutron shell effect, whereas large gaps between the isotopic chains indicate a proton shell effect. Not all of those visible are related to actual shell closures, however. As pointed out in Ref. [15], spherical configurations of superheavy nuclei have the unusual feature that variations in the degeneracy of spherical shells around the Fermi energy, which result from the sequence of high-j and low-j orbits in the spectrum, are sufficient to provide significant extra binding without the appearance of visible shell closures. And indeed, the spreading of the curves representing spherical Q values forZ >114 cannot be correlated to the opening of gaps in the single-particle spectrum, see Fig.3. Instead, it results from the small degeneracy of the low-j orbits around the Fermi energy. Comparing this panel with the upper right one shows the effect of static quadrupole deformation. As most nuclei are deformed, the density of single-particle levels is much more uniform than for spherical shapes. As a result, the
Q values from deformed mean-field calculations are on the average much closer to the
LDM values than to those from spherical mean-field calculations. In the region of nuclei with large deformation energy, the remaining jumps and gaps between the lines indicate deformed neutron (N=150, 162) and proton (Z=108) shell closures, not all of which agree with experiment [3,12,16]. For the heavier transitional nuclei the direct connection between shell structure andQremains less direct. As expected from Fig.1, the dynamic quadrupole correlations obtained from constructing theJ=0 projected GCM ground states only have a minor impact onQvalues, see the lower right panel. Still, compared to the deformed mean-field results, for the heavy transitional nuclei all curves are slightly shifted in a non-uniform
manner, most obviously for theZ=120 chain drawn in red. How these calculated values
compare with experiment has already been discussed in Ref. [4].
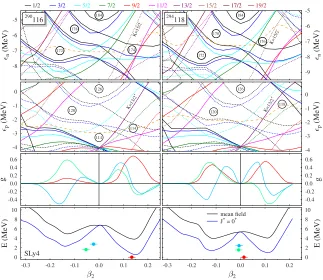
The interplay of single-particle shell structure, ground-state deformation and dynamic quadrupole collectivity in these calculations is illustrated in Fig. 3 for 290116 and294118,
1/2 3/2 5/2 7/2 9/2 11/2 13/2 15/2 17/2 19/2 -8 -7 -6 -5 n (MeV) K=15/2 -290 116 178 184 172 174 -4 -3 -2 -1 0 p (MeV) K=13/2 + 126 114 120 114 -0.4 -0.2 0.0 0.2 0.4 0.6 g 0 2 4 6 8 10 E( M eV )
-0.3 -0.2 -0.1 0.0 0.1 0.2
2 SLy4 -9 -8 -7 -6 -5 n (MeV) K= 15/2 -294 118 178 176 184 172 -4 -3 -2 -1 0 p (MeV) K=1 3/2 + 126 120 118 0 2 4 6 8 10 E( M eV )
-0.3 -0.2 -0.1 0.0 0.1 0.2
2
mean field J+= 0+
-0.4 -0.2 0.0 0.2 0.4 0.6 g
Figure 3.From top to bottom: Nilsson diagrams of neutron (n) and proton (p) single-particle energies,
collective GCM wave functionsgof the three lowest 0+states, and the mean field (black) and angular momentum J=0 projected deformation energy curves obtained for 290116 (left panels) and 294118
(right panels) as a function of the intrinsic axial quadrupole deformation2. For the definition of2
andg(2) see Ref. [7]. Positive (negative)2values indicate prolate (oblate) shapes. The colour of the
levels in the Nilsson diagrams indicates the expectation value of angular-momentum along the nucleus’ symmetry axis. Solid (dotted) lines correspond to levels of positive (negative) parity. The respective Fermi energies are indicated by dashed orange lines. The numbers put into various gaps in the Nilsson diagrams indicate the number of particles that can be put into the levels below. The bottom panel also show the energies of the GCM states drawn at the average deformation of the intrinsic states they are constructed from using the expressions from Ref. [7]. The corresponding wave functionsg(2) in the
panel above are plotted in the same colour.
parameterisation of the Skyrme EDF, both nuclei have soft deformation energy surfaces with slightly deformed minima. Calculations of the full - plane that will be reported elsewhere [19] indicate that the prolate and oblate minima visible for294118 remain separated
by a small barrier indirection, while for290116 the oblate structure is actually a saddle point.
The energy gain from projection on angular momentumJ=0 increases with deformation,
which for294118 inverts the order of the two minima.
1/2−
5/2−
9/2−
13/2−
17/2−
21/2−
25/2−
1/2−
5/2−
3/2−
9/2−
7/2−
13/2−
11/2−
17/2−
15/2−
21/2−
19/2−
25/2−
23/2−
Kπ= 1/2−
7/2− 7/2−
9/2−
11/2−
13/2−
15/2−
17/2−
19/2−
21/2−
23/2−
25/2−
Kπ= 7/2−
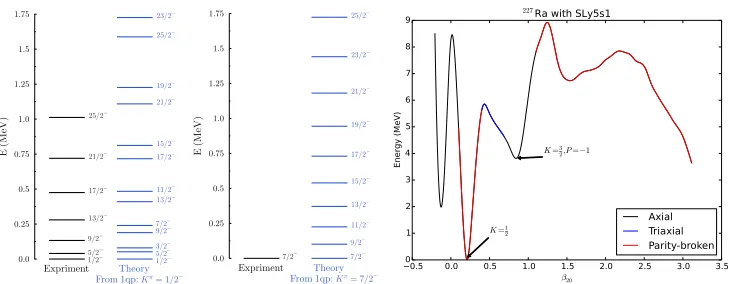
Figure 4. Left: energies obtained after projection on angular momentum and particle numbers of two different one-quasiparticle states of251Md. Right: fission barrier for227Ra constructed from the lowest
one-quasiparticle configuration found at each deformation. Colours indicate the symmetries taken by the solutions found.
of both nuclei are very similar, although there are many small differences in the relative position of the single-particle levels. The main difference relevant for our discussion is the change in position of the Fermi energies that indicate where the smooth distributions of occupation numbers as determined by pairing correlations fall below 1/2. Its shift has two important consequences for configurations around the prolate minimum. Firstly, the up-sloping neutron K=15/2− level originating from the spherical 1j15/2− intruder
sub-shell is still below the Fermi energy for 294118, but far above for 290116. Secondly, the
K=13/2+ proton level from the spherical i
13/2+ intruder sub-shell is next to the Fermi
energy for294118, but much higher up for290116. There are no other intruder levels crossing
the Fermi energy in the range of deformations over which the lowest 0+ states are spread. As a consequence, about the same number of proton and neutron intruder levels has large occupancy on the prolate and the oblate sides for294118, whereas for prolate configurations
of 290116 there are roughly two neutron and proton intruder orbitals less that are occupied
for oblate ones, which leads to two distinct configurations that are only weakly mixed in
290116. Such difference might have a visible impact on thetransition probability; however,
no significant deviation from the empirical relation betweenQvalues and lifetimes is found for the observed transition between both nuclei [17]. A more detailed analysis of these results will be given elsewhere [19].
3. Prospective calculations for odd-mass nuclei
The application of beyond-mean-field methods to odd nuclei is still in its infancy and requires new developments in particular to build effective interactions. The need to block one-quasiparticle states makes their description already much more complicated at the level of SCMF calculations.
As a first application of the projection techniques for odd nuclei that we have recently developed [10] to very heavy nuclei, the left panel of Fig.4shows the spectra obtained from the projection of two different blocked one-quasiparticle HFB configurations obtained for
251Md with the effective interaction SLyMR0 [20]. There is a clear difference between the
spectra obtained from the projection of these two near-axial states with K≈7/2− and
been observed so far [21]; compared to the data, the projected energy spectrum is sligthly too spread out.
Besidesdecay, fission is the overall most important decay mode of superheavy nuclei. While there are many calculations of the fission barriers of heavy even-even nuclei, there are almost none for odd ones. How to follow their fission path is not a trivial problem. Indeed, the one-quasiparticle configuration that provides the lowest energy may change its properties along the fission path, making it much more complicated to ensure that the path is continuous. Non-axial deformations can connect axial configurations with different
K-value, while octupole deformations mix states of opposite parity. The fission barrier of
227Ra as obtained from exploratory blocked HFB calculations [22] with the recent SLy5s1
parameterization of the Skyrme EDF [23] is plotted in the right panel of Fig. 4. At each deformation the energy of the lowest configuration found is given. For the ground state of this nucleus, parity is broken and the lowest quasiparticle corresponds toK=1/2, while at large deformations, the second minimum corresponds toK=3/2−.
Part of the computations were performed using HPC resources from of the MCIA (Mésocentre de Calcul Intensif Aquitain) of the Université de Bordeaux and of the Université de Pau et des Pays de l’Adour. This research has been supported in part by the PAI-P7-12 of the Belgian Office for Scientific Policy.
References
[1] M. Bender, P.-H. Heenen, P.-G. Reinhard, Rev. Mod. Phys.75, 121 (2003). [2] M. Bender and P.-H. Heenen, J. Phys. Conf. Series420, 012002 (2013).
[3] J. Dobaczewski, A.V. Afanasjev, M. Bender, L.M. Robledo, Y. Shi, Nucl. Phys.A944, 388 (2015).
[4] P.-H. Heenen, J. Skalski, A. Staszczak, D. Vretenar, Nucl. Phys.A944, 415 (2015). [5] M. Bender, Eur. Phys. J. ST156, 217 (2008).
[6] J. L. Egido, Phys. Scripta91, 073003 (2016).
[7] M. Bender, G.F. Bertsch, P.-H. Heenen, Phys. Rev. C73, 034322 (2006). [8] M. Bender and P.-H. Heenen, Phys. Rev. C78, 024309 (2008).
[9] J.M. Yao, M. Bender, P.-H. Heenen, Phys. Rev. C87, 034322 (2013).
[10] B. Bally, B. Avez, M. Bender, P.-H. Heenen, Phys. Rev. Lett.113, 162501 (2014).
[11] S. Cwiok, J. Dobaczewski, P.-H. Heenen, P. Magierski, W. Nazarewicz,´
Nucl. Phys.A611, 211 (1996).
[12] T. Bürvenichet al., Eur. Phys. J.A3, 139 (1998).
[13] S. ´Cwiok, P.-H. Heenen, W. Nazarewicz, Nature,433, 705 (2005).
[14] P.-G. Reinhard, M. Bender, W. Nazarewicz, T. Vertse, Phys. Rev. C73, 014309 (2006). [15] M. Bender, W. Nazarewicz, P.-G. Reinhard, Phys. Lett.B515, 42 (2001).
[16] M. Asai, F.P. Heßberger, A. Lopez-Martens, Nucl. Phys.A944, 308 (2015). [17] Yu.Ts. Oganessian and V.K. Utyonkov, Nucl. Phys.A944, 62 (2015). [18] K. Heyde and J.L. Wood, Rev. Mod. Phys.83, 1467 (2011).
[19] M. Bender and P.-H. Heenen, in preparation.
[20] J. Sadoudi, M. Bender, K. Bennaceur, D. Davesne, R. Jodon, T. Duguet, Phys. ScriptaT154, 014013 (2013).
[21] A. Chatillonet al., Phys. Rev. Lett.98, 132503 (2007). [22] W. Ryssens, Thesis, Université Libre de Bruxelles (2016).