70 | P a g e
A STATISTICAL APPROACH TO COGNITIVE
ANALYSIS
Naresh Kumar Kar
1,
H. R. Sharma
2, Asha Ambhaikar
3Rungta College of Engineering and Technology,
Kohka-Kurud Road, Bhilai, (India)
ABSTRACT
Many social media, like Twitter where many people express their thoughts and sentiments in their daily
interaction. One of the biggest challenges in these field, is the classification of their polarity, that is, whether they
carry a positive or negative connotation. For this purpose, statistical methods have been inspired by the
observation that if two words frequently appear together within the same context, they are likely to have the
same polarity. Consequently, the polarity of a word can be determined by calculating its relative frequency
of co-occurrence with special words, called paradigm words, whose polarities are invariantly preserved (e.g.,
“good” and “bad”). Through this way, one can perform classification, for example, a tweet as carrying a
positive polarity, if the majority of its words is more strongly associated with the word “good” than with the word
“bad”. In current statistical approaches, such paradigm words have been selected following different criteria,
without any prior evaluation. Motivated by this observation, we propose to classify tweets via a statistical
method where the paradigm words are selected by means of a genetic algorithm. This algorithm explores a
set of paradigm words to find a subset of such words that leads to a significant improvement of the classification
accuracy.
I.
INTRODUCTION
Many social media, such as Twitter, are regarded as public diaries, where millions of people express themselves, give opinions, and get feedback from other users. These ever-growing subjective data are, undoubtedly, an extremely rich source of information for any kind of decision making process.
To automate the analysis of such data, the area of Sentiment Analysis has emerged. It aims at identifying opinionative data in the Web and classifying them according to their polarity, i.e., whether they carry a positive or negative connotation.
The methods based on this observation most commonly use the statistical measure Point wise Mutual Information (PMI). The PMI between two words u and v is defined as:
PMI(u,v) = (1)
71 | P a g e dependence between the words, while the log of this ratio reveals how much information is conveyed if the words appear near each other.
In this context, the contributions of this paper are threefold:
1)We focus on the polarity classification of tweets, which are messages limited to 140 characters sent on Twitter. To this purpose, we propose their classification by means of a statistical method based on those presented in [3] and [4], which rely on the mutual information between phrases and words, respectively, and paradigm words.
2)We propose to select the paradigm words by means of an evolutionary-based approach. We define a genetic algorithm that effectively explores a set of candidate paradigm words to find a subset of such words that leads to a significant improvement of the classification accuracy.
3)Another point explored in this paper is related to the effectiveness of a fixed set of paradigm words, when classifying data of different domains. Indeed, Turney’s state-of-the-art method [3] behaved differently when classifying different sorts of reviews, using a fixed set of paradigm words. The accuracy on movie reviews, e.g., was about 66%, while, for banks and automobiles, it varied from 80% to 84%. Inspired by these results, we believe that the most appropriate set of paradigm words may vary according to the data domain. For example, paradigm words applied in the classification of tweets in the domain of movies may not be convenient to classify tweets related to products and vice versa.
II.
RELATED WORK
Sentiment classification is the task of determining the senti- ment of subjective text (e.g., user reviews, blogs, micro-blogs, etc). Different scenarios are studied in the literature, such as the classification of: (i) the overall sentiment of a document (e.g., [3]), (ii) individual sentences (e.g., [5]), or even (iii) specific sentiment toward an object or entity (e.g., [6]). The output can be binary (positive or negative), ternary (positive, negative or neutral), or even expressed in finer granularities (e.g., 5-star or 10-star rating).
Machine learning techniques are, in their vast majority, supervised learning strategies, such as classification algorithms (e.g., support vector machines, naive bayes, etc.). Generally speaking, the idea is to learn a classifier based on the characteristics of pieces of text (e.g., reviews), whose polarities are already known. In this so-called training dataset, each piece of text is often represented as a binary feature vector, in which each entry takes value 1 if, e.g., a given word (or unigram) is present in the document and 0, otherwise.
The work proposed by Pang et. al. in [8], which analyzes the performance of different classifiers on movie reviews, has served as a starting point for other supervised techniques, which used their ideas in the classification of text in different domains (e.g., [7], for product reviews).
72 | P a g e are manually labeled (classified) by them, frequently referred to as seed words in the literature. Then, this set of seed words is extended, iteratively, with their synonyms and antonyms (using the lexical resource WordNet [9]), as a means to classify the polarity of the adjectives present in the sentences. The adjectives not found in WordNet are discarded. The dominant polarity of the adjectives is, then, considered as the polarity of the overall sentence.
Note that current studies use different predefined paradigm words, selected in different ways, for different target tasks. The approach presented in this paper is motivated by this observation. It is inspired by the statistical approaches presented in [3], [4] and takes characteristics of the supervised machine learning methods as well, as it also relies on a training dataset. Dictionary-based approaches, such as that in [6], is not suitable for our purpose: as tweets are short informal texts (limited to 140 characters), it is very likely that many words are not recognized by such dictionaries, limiting the number of successfully classified words, which may contribute to a low classification accuracy.
Regarding the analysis of sentiments expressed via tweets, this task has received a lot of attention over the last few years [11]. However, existing methods do not explore statistical measures, as in our approach. Indeed, they are traditional supervised classification methods (e.g., [12], [13]), transfer- learning techniques [14], or labeled propagation strategies [15]. Concerning the usage of evolutionary algorithms in the area of sentiment analysis, we are aware of only one method, presented in [16], which proposes a genetic algorithm for feature selection in the (supervised) classification of movie reviews and web forums. To the best of our knowledge, our work is the first to explore statistical methods and, in particular, an evolutionary-based approach to the classification of tweets.
III TURNEY’S APPROACHES
In this section, we describe in more detail the state-of- the-art methods presented in [3], [4], which have served as inspiration for our work. Both of them use paradigm words in the estimation of the polarities of subjective data. However, while the former focuses on the classification of reviews of different topics (automobiles, banks, movies, and travel destinations) as recommended or not recommended, the latter aims at classifying the polarity of single words (adjectives, adverbs, verbs or nouns).
A. Classifying Reviews
In [3], Turney presents a 3-step technique to classify different sorts of reviews, as follows.
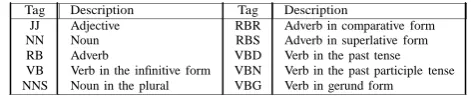
1) Extracting Two-word Phrases: The first step consists in extracting, from each review, two-word phrases that conform to one of the Part-Of-Speech patterns described in Table I (the tags are presented in Table II). The idea is to extract phrases in which one of the words is an adjective or an adverb, as they are acknowledged to be good indicators of subjectivity [17], and the other provides context.
First Word Second Word Third Word (not extracted) JJ
RB, RBR or RBS JJ NN or NNS RB,
RBR or RBS
NN or NNS JJ JJ JJ
VB, VBD, VBN or VBG
anything Not NN, nor NNS Not NN, nor NNS Not NN, nor NNS
anything
73 | P a g e
Tag Description Tag Description
JJ NN RB VB NNS
Adjective Noun Adverb
Verb in the infinitive form Noun in the plural
RBR RBS VBD VBN VBG
Adverb in comparative form Adverb in superlative form Verb in the past tense Verb in the past participle tense Verb in gerund form
Table II Part-Of-Speech Tags
2) Estimating the Polarity of each Phrase: In the second step, for each phrase b, a polarity score, also referred to as semantic orientation, SO(b), is calculated as its PMI (see Equation 1) with the positive paradigm word “excellent” minus its PMI with the negative paradigm word “poor”, as in Equation 2. Since, in the five star review rating system, it is common to define one star as “poor” and five stars as “excellent”, these words were used as paradigm words.
SO(b) = PMI(b, excellent) - PMI(b, poor) (2)
The probabilities P r(b), P r(excellent), P r(poor), nec-
essary to compute the corresponding PMI values, are esti- mated using document hit counts obtained from queries to the search engine Altavista. Analogously, P r(b ∧ excellent) and P r(b ∧ poor), are estimated using the operator of Altavista called NEAR, which constraints the queries to documents that contain both phrase and paradigm word, with at most 10 words from one another. The semantic orientation of each phrase is then estimated with Equation 3 (where hits(query) is the number of returned hits).
SO(b) =
(3)
The phrase has a positive semantic orientation if the result of Equation 3 is positive, being negative, otherwise.
3) Computing the Final Polarity: Finally, the review is classified as recommended if the average semantic orientation of its phrases is positive, and not recommended, otherwise.
This strategy achieved an average accuracy of 74% when evaluated on a corpus of 410 reviews in different domains, namely automobiles, banks, movies, and travel destinations. The accuracy on movie reviews was about 66%, while, for banks and automobiles, that varied from 80% to 84%.
B. Classifying Words
Turney et al. [4] also focused on the calculus of the semantic orientation of any word (adjectives, adverbs, verbs or nouns). The idea was to study the behavior of the strategy previously studied (in [3]) outside any particular application. Differently from the approach in [3], they compute the seman- tic orientation of each word based on a set of seven positive paradigm words, Pos = {“good”, “nice”, “excellent”, “posi- tive”, “fortunate”, “correct”, “superior” }, and a set of seven negative words, Neg = {“bad”, “nasty”, “poor”, “negative”, “unfortunate”, “wrong”, “inferior”}.
More precisely, the semantic orientation of a given word w is defined as the sum of its PMI with all positive words in Pos minus the sum of its PMI with all negative words in Neg, as defined in Equation 4.
74 | P a g e
SO(w) =
(4)
As in [3], the result of Equation 4 is estimated with queries to Altavista, also using the NEAR operator, which boils down to Equation 5 after some algebraic manipulation.
SO(w) =
(5)
The word w has a positive semantic orientation if the result of Equation 5 is positive, being negative, otherwise.
Regarding the experiments, the authors use a dataset with 3,596 words (including verbs, adjectives, adverbs and nouns) manually labeled as positive (1,614) and negative (1,982). The method achieves an accuracy of 82.8%.
I
IVV
CLASSIFICATION OF TWEETS
Inspired by the statistical methods proposed by Turney et al. [3], [4], we propose to classify the polarity of tweets by means of a 3-step strategy, as follows.
Extracting Tweets’ Features
Tweets are classified based on their features, namely the unigrams and phrases that compose them. For each tweet t to be classified, such features are extracted in the following way:
1) Tokenization: Tweet t is first tokenized. Tokens which are (i) stopwords1 (e.g., “the”, “is” and “at”) or (ii) Twitter specific tokens (usernames, hashtags, links and emoticons) are discarded. Each remaining token is then classified according to their Part-of-Speech. For this purpose, we use the Part-of- Speech tagging tool2 , presented in [18], which consists of a specific Part-of-Speech tagset for Twitter with an accuracy of 90%.
2) Extraction: Afterwards, we extract two-word phrases from the tokens, following the same strategy proposed by Turney [3] (see Subsection III-A). However, since tweets are limited to only 140 characters, it may be that no such pattern is found. An example tweet is “@someone In NY this weekend! It’s great!”. After the previous step, there is no two-word phrases to be extracted. As a solution to this problem, we opted to extract not only word phrases, but also unigrams. Here, a unigram is any word that has not formed a two-word phrase with any other two-word. The following unigrams would then be extracted from the example tweet: “weekend”, “great”. As suggested by Turney in [3], “NY” is discarded, since it is a proper noun.
Analogously, “In”, “this”, and “It’s” are also discarded as they are considered stopwords.
75 | P a g e
V
CANDIDATE PARADIGM WORDS
The paradigm words to be explored by the proposed GA are derived from SentiWordNet [20], which is a lexical resource for the English language. In this dictionary, each entry refers to a group of words of the same Part-of-Speech and with the same sense (meaning). Each group is associated to three sentiment numerical scores, which describe how positive, negative, or neutral the words contained in it are. Such scores range from 0.0 to 1.0, and their sum is 1.0 for each group. The word “excellent”, e.g., is only categorized as adjective, and has a positive score of 1.0. The word “cold”, in turn, has a negative score of 0.75, in the sense of “having a low or inadequate temperature” (adjective), and a negative score of 0.125, in the sense of “a mild viral infection” (noun). Some words may also have both positive and negative scores, such as the adjective “fragile”, in the sense of “vulnerably delicate”, with 0.25 and 0.375 as positive and negative scores, respectively.
The candidate paradigm words are then selected with the following criteria:
1) As adjectives are already acknowledged as being good indicators of subjectivity [17], we first select the words that have more senses as adjectives.
2) Then, for each word w selected in the previous step, we compute its weighted average positive score (weight- edPt(w)) as well as its weighted average negative score (weightedNg(w)), considering all its senses as adjectives. More precisely, to each score is assigned a weight of 1/i , where i is the rank position of the corresponding sense. The final weighted average score of w, Pol(w), is then defined as in Equation 6.
Pol(w) = weightedPt(w) - weightedNg(w) (6)
Since the idea of methods based on word co-occurrences is to use paradigm words with positive and negative connotations, those words whose Pol ranges from 0.7 to 1.0 (words with significant positive connotation) or from -1.0 to -0.7 (words with significant negative connotation) are then selected.
3) We also consider the frequency of the words selected in the previous step. We compute the document hit counts of each word w, defined as hits(w), and then compute its weighted frequency, with Pol(w) as the weight, as shown in Equation 7. The hit counts are gathered by a search engine under 50 million Web pages, as explained in detail in Subsection VII-B.
weightedFreq(w) = hits(w) × Pol(w) (7)
76 | P a g e Positive paradigm words Negative paradigm words
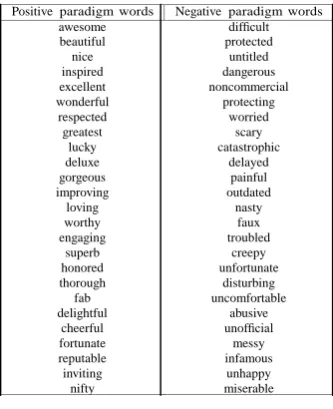
awesome beautiful nice inspired excellent wonderful respected greatest lucky deluxe gorgeous improving loving worthy engaging superb honored thorough fab delightful cheerful fortunate reputable inviting nifty difficult protected untitled dangerous noncommercial protecting worried scary catastrophic delayed painful outdated nasty faux troubled creepy unfortunate disturbing uncomfortable abusive unofficial messy infamous unhappy miserable
Table III. Candidate Paradigm Words
VI THE GENETIC ALGORITHM
It explores a search-space consisting of subsets of the paradigm words presented in Table III and aims at finding an appropriate subset which leads to a significant improvement of the classification accuracy, when classifying the polarity of tweets. For a detailed review of GAs in general, we refer the reader to [21].
A. Initial Population
The proposed GA begins by constructing the initial popu- lation with N randomly generated individuals (chromosomes). Then, these individuals are evaluated w.r.t their quality, that is, their fitness values.
B. Reproduction
During the reproductive phase, chromosomes are selected from the current population and recombined to produce off- spring: the algorithm selects N/2 pairs of chromosomes with the roulette wheel method [22], in which each chromosome is selected with a probability proportional to its fitness value.
1) Crossover: The chromosomes of each selected pair (par- ents) are combined with a crossover method with likelihood of pc to generate two new chromosomes (children). We adopted one-point crossover as follows: the parents are split into two parts, namely the positive and negative parts. The positive parts of the parents are combined via one-point crossover by randomly generating the crossover point. The same is performed with the negative parts. The two children are then constructed with the resultant positive and negative parts.
77 | P a g e 3) Repair: Upon crossover and mutation, it may be that the number of positive and negative words present in the positive and negative parts of a child C , respectively, is not the same. This makes C an invalid solution. In this case, we say that C has a smallest part (where fewer words are present) and a biggest part (where more words are present). To fix this, the GA applies the following repair operator: let l and h be the number of paradigm words present in the smallest and biggest part of C , respectively. First, the operator randomly chooses whether to fix the smallest or biggest part of C . If the former option is chosen, (h - l) randomly chosen words are included in its smallest part. Otherwise, (h - l) randomly chosen words are removed from its biggest part.
C. New Generations and Stop Criterion
The fitness values of the offspring constructed during the reproduction phase are computed and they are included in the current population. The new generation of chromosomes is then constructed in an elitist way, that is, it is composed by the N fittest chromosomes of the current extended population. Reproduction is repeated I times, and the subset of paradigm words represented by the fittest chromosome in the I th generation is then returned as the answer of the GA. The population size N , the number of generations I , and the probabilities pc and pm for crossover and mutation, respectively, used in the conducted experiments are
reported in the next section.
VII EXPERIMENTS
This section presents the computational results obtained by our approach, referred to hereafter as the Statistical and Evolutionary approach (SE approach). Having tweets as the subjective data to be classified, the conducted experiments aimed to answer three main questions:
1) Does a more flexible way to select the set of paradigm words to be used in the classification process outperform the idea of working with a predefined set, as is frequently done in the literature (e.g., [2], [3], [4])? 2) Does the proposed approach outperform the supervised machine learning algorithms that are commonly used for the task of sentiment classification (e.g., the work proposed in [8], [12], [13])?
3) Does the most appropriate set of paradigm words depend on the domain of the data being classified?
A. Datasets
1) Stanford (STD): This dataset was made available by the authors of [12]4 , who constructed it by searching the Twitter (with its API) with queries arbitrarily chosen from different subjects. Table IV presents such subjects, and the total number of corresponding tweets, positive tweets, and negative tweets.
Domain #Tweets #Positive #Negative Company
Misc Person Product Movies Location Events
119 67 65 63 19 18 8
33 26 48 47 16 4 8
86 41 17 16 3 14 0
Total 359 177 182
78 | P a g e 2) Health Care Reform (HCR): This dataset was con- structed by the authors of [15] and is composed of tweets about the health care reform from early 2010, in the USA. The authors divided it into three datasets: HCR-Dev, HCR- Train and HCR-Test. Their characteristics are presented in Table V, namely their total number of tweets, positive tweets and negative tweets.
Dataset #Tweets #Positive #Negative HCR-Dev
HCR-Train HCR-Test
636 614 658
172 213 154
464 401 504
Total 1908 539 1369
Table V. Characteristics of the Dataset HCR
B. Results
1) Fixed Set of Paradigm Words vs. SE: To answer the questions previously presented, especially, the first question, we compared the classification accuracies achieved by two dif- ferent approaches, when classifying the tweets in the datasets STD and HCR-Test, as follows:
a) Statistical and Evolutionary (SE): This is the ap- proach proposed in this paper. Here, the tweets in the labeled datasets are classified via the strategy described in Section IV. The accuracy achieved on the dataset STD is computed as the ratio between the number of correctly classified tweets to the total number of tweets after a 10-fold cross validation. To compute the accuracy on the HCR- est, the SE approach is first executed on the dataset HCR-Train in order to select an appropriate set of paradigm words. The selected words are then used in the classification of the tweets in the HCR-test. The accuracy is computed as the ratio between the number of correctly classified tweets in the dataset HCR-Test to its total number of tweets.
b) Fixed Set of Paradigm Words (Fixed-Set): With this approach, the tweets in the labeled datasets are classified via the strategy described in Section IV, but using a fixed set of paradigm words instead of choosing the most appropriate ones with a genetic algorithm. We took the 14 predefined words proposed by Turney and Littman in [4] as the fixed set of paradigm words (see Subsection III-B), since it has served as a starting point for subsequent statistical classification methods. As this approach uses a fixed set of paradigm words, i.e., it does not “learn” the set of paradigm words to be used in the classification process, it does not require a training phase. Therefore, a cross validation process is not necessary for its evaluation. The classification accuracies are simply computed as the ratio between the number of correctly classified tweets to the total number of tweets, for both STD and HCR-Test.
79 | P a g e Dataset MNB SVM MaxEnt Fixed-Set SE
STD HCR-Test
72.7% 63.8%
69.9% 74.7%
70.7% 65.6%
68% 74.6%
77.2% 75.5%
Table VI. Accuracies Achieved By the Fixed-Set and Se
Approaches on the Datasets STD and HCR-Test.
Table VII presents the accuracies achieved with each supervised method (second, third, and fourth columns) on the datasets STD and HCR-Test (first column). Observe that the SE approach (sixth column) outperformed all supervised machine learning methods on both datasets. Furthermore, the Fixed- Set approach (fifth column) had the worse performance on the dataset STD. This result contributes to showing that a more flexible way to select the paradigm words is advantageous.
Table VII. Accuracies Achieved By The Supervised Machine Learning Methods, The
Fixed-Set Approach, And The Se Approach On The Datasets STD And HCR-Test.
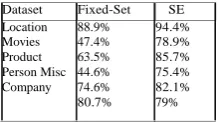
In addition to the analysis of the selected paradigm words w.r.t the different data domains, we compared the accuracies achieved with both SE and Fixed-Set approaches, when classifying each of the groups of tweets in the dataset STD. For the evaluation of the SE approach, we performed a leave- one-out cross validation to compute the accuracies achieved on the groups Location and Movies, as they have less than 20 tweets each (we do not consider the group Events, as it does not contain any negative tweet). For the other datasets, we performed a 10-fold cross validation, as in the previous experiments. Table VIII presents the obtained results. Note that the accuracies obtained with the SE approach were again higher than those achieved with the Fixed-Set approach (except on Company, with a small difference), which strengthens the idea that a more flexible way to select the paradigm words is beneficial. Also, the performance of the Fixed-Set approach seemed to be more sensitive to the data domain being
Table VIII. Accuracies Achieved By the Approaches Fixed-Set and Se on the Different
Domains of the Dataset Std.
VIII CONCLUSIONS
Statistical methods for polarity classification are most com- monly based on the mutual information between document features (e.g., single words or phrases) and polarity-preserved words, where the mutual information is computed using statistics gathered by a search engine or from large corpora. Such polarity-preserved words, often called paradigm words, have been selected in different ways in the literature, without any prior
Dataset Fixed-Set SE
STD 68% 77.2%
HCR-Test 74.6% 75.5%
Dataset Fixed-Set SE Location
Movies Product Person Misc Company
88.9% 47.4% 63.5% 44.6% 74.6% 80.7%
80 | P a g e evaluation. In this paper, we propose to classify tweets via a statistical method, where the paradigm words are selected by means of a genetic algorithm. When classifying the polarity of tweets, our experiments showed that a more flexible way to select the paradigm words to be used in the classification process outperforms the idea of working with a predefined set, as is frequently done in the literature. In addition, we demonstrated that it may be advantageous to vary the set of paradigm words according to the data domain. Indeed, tweets of different subjects were more accurately classified with different paradigm words in our experiments. For future work, we intend to investigate the effect of different genetic operators on the final classification results.
REFERENCES
[1] P. Chaovalit and L. Zhou, “Movie review mining: A comparison between supervised and unsupervised classification approaches,” in Proc. of the 38th Annual Hawaii Int. Conf. on System Sciences, 2005.
[2] J. Read and J. Carroll, “Weakly supervised techniques for domain- independent sentiment classification,”
in Proc. of the Int. CIKM Work- shop on Topic-sentiment Analysis for Mass Opinion, 2009, pp. 45–52.
[3] P. Turney, “Thumbs up or thumbs down? semantic orientation applied to unsupervised classification of reviews,” in Proc. of the 40th ACL, 2002, pp. 417–424.
[4] P. D. Turney and M. L. Littman, “Measuring praise and criticism: Inference of semantic orientation from association,” ACM Trans. and Inf. Systems, vol. 21, no. 4, pp. 315–346, 2003.
[5] H. Yu and V. Hatzivassiloglou, “Towards answering opinion questions: Separating facts from opinions and identifying the polarity of opinion sentences,” in Proc. of EMNLP, 2003, pp. 129–136.
[6] M. Hu and B. Liu, “Mining and summarizing customer reviews,” in Proc. of the 10th ACM SIGKDD, 2004, pp. 168–177.
[7] K. Dave, S. Lawrence, and D. M. Pennock, “Mining the peanut gallery: Opinion extraction and semantic classification of product reviews,” in Proc. of the 12th ACM WWW, 2003, pp. 519–528.
[8] B. Pang, L. Lee, and S. Vaithyanathan, “Thumbs up?: sentiment classification using machine learning techniques,” in Proc. of EMNLP,2002, pp. 79–86.
[9] G. A. Miller, “Wordnet: A lexical database for english,” Communica- tions of the ACM, vol. 38, pp. 39–41, 1995.
[10] V. Hatzivassiloglou and K. R. McKeown, “Predicting the semantic orientation of adjectives,” in Proc. of
the 8th Conf. on European Chapter of the Association for Computational Linguistics, 1997, pp. 174–181.
[11] S. Kumar, F. Morstatter, and H. Liu, Twitter Data Analytics. New York, NY, USA: Springer, 2013. [12] A. Go, R. Bhayani, and L. Huang, “Twitter sentiment classification using distant supervision,”
Stanford, Tech. Rep. CS224N, 2009.
[13] A. Pak and P. Paroubek, “Twitter as a corpus for sentiment analysis and opinion mining,” in Proc. of the
81 | P a g e [14] P. H. Calais Guerra, A. Veloso, W. Meira, Jr., and V. Almeida, “From bias to opinion: A transfer-learning approach to real-time sentiment analysis,” in Proc. of the 17th ACM SIGKDD, 2011, pp. 150– 158.
[15] M. Speriosu, N. Sudan, S. Upadhyay, and J. Baldridge, “Twitter polarity classification with label propagation over lexical links and the follower graph,” in Proc. of the 1st EMNLP Workshop on
Unsupervised Learning in NLP, 2011, pp. 53–63.
[16] A. Abbasi, H. Chen, and A. Salem, “Sentiment analysis in multiple languages: Feature selection for opinion classification in web forums,” ACM Trans. and Inf. Systems, vol. 26, no. 3, pp. 12:1–12:34, 2008.
[17] V. Hatzivassiloglou and J. M. Wiebe, “Effects of adjective orientation and gradability on sentence subjectivity,” in Proc. of the 18th Conf. on Computational Linguistics, 2000, pp. 299–305.
[18] K. Gimpel, N. Schneider, B. O’Connor, D. Das, D. Mills, J. Eisenstein, M. Heilman, D. Yogatama, J. Flanigan, and N. A. Smith, “Part-of- speech tagging for twitter: annotation, features, and experiments,” in
Proc. of the 49th ACL: Human Language Technologies: short papers- Volume 2, 2011, pp. 42–47.
[19] L. Polanyi and A. Zaenen, “Contextual valence shifters,” in Computing attitude and affect in text: Theory
and applications, 2006, pp. 1–10.
[20] S. Baccianella, A. Esuli, and F. Sebastiani, “Sentiwordnet 3.0: An enhanced lexical resource for sentiment analysis and opinion mining,” in Proc. of the 7th LREC, 2010.
[21] D. E. Goldberg, Genetic Algorithms in Search, Optimization and Machine Learning, 1st ed. Addison-Wesley Longman Publishing Co., Inc., 1989.
[22] J. H. Holland, Adaptation in Natural and Artificial Systems. University of Michigan Press, Ann Arbor, 1975.