Registration of high-frequency waves on the surface by the
interference methods
Anastasia Shmyrova1*, Andrey Shmyrov1, Irina Mizeva1 and Alexey Mizev1
1Institute of Continuous Media Mechanics UB RAS, Perm, Russia
Abstract. Capillary waves are frequently used to measure the surface tension of liquids. However, this approach has not found wide application in the manufacture of modern commercial tensiometers because of the limitations imposed by capillary wave excitation techniques and the labor input associated with its practical implementation. In this paper we introduce a modified version of the capillary wave method which allows one to avoid the existing limitations and disadvantages. The distinguishing features of the proposed technique are as follows: acoustic wave generation and application of an interferometry technique for 3D surface profile reconstruction. A dynamic speaker with controlled vibration frequency and amplitude is used to produce acoustic vibrations. Application of a conventional Fizeau interferometer and the spatial phase shifting method makes it possible to perform surface form measurements with a high accuracy. For calculating wavelengths and the damping co-efficient, the surface profile is fitted with a decaying cylindrical wave equation. The accuracy of surface tension measurement by the modified capillary wave technique is 0.3 %. Owing to the non-contact way of wave generation and the small amounts of the examined fluid, the proposed method can be used in different studies.
1 Introduction
It has long been known that the characteristics of waves emerging on the liquid surface can be used to study the properties of the interface. The wavelength of commonly applied capillary waves is less than 2πa, where a is the capillary Laplace constant. As was shown in [1], the shape of the interface subjected to periodic perturbations can be described by the dispersion relation, which connects the time and spatial frequency of the traveling wave with density and surface tension of the liquid. Specifying the frequency of the wave and measuring its length and damping coefficient, it is possible to calculate the surface tension and viscosity. More accurate results seem to be obtainable when the viscosity [2] and depth [3] of the fluid are taken into account. In the presence of the adsorbed surfactant layers at the interface, additional dissipative forces appear, which is associated with the surface viscosity and elasticity of the layer. The study of these forces makes it possible to investigate the viscoelastic properties of surface layers [4].
Nowadays, application of the capillary wave method is limited by the difficulties that arise during its practical implementation. For instance, the theoretical studies described in [1-3] concern plane waves. On the one hand, this simplifies the form of the relations by eliminating one of the principal radii of curvature. On the other hand, such a formulation significantly complicates the laboratory implementation. The oscillating plate used to generate a plane wave has a finite size. Due to the end effects, the wave from such a
flat source can be considered only at a distance significantly shorter than the length of the plate. This imposes restrictions on making measurements far from the source. To reduce error in wavelength measurements, to which the method is sensitive, it is necessary to make measurements at long distances from the source.
The methods of wave generation and registration are also area where many questions arise. Using these methods, a wave is excited mechanically by a partially immersed body, which makes it possible to obtain oscillations in the limit of gravitational or capillary-gravitational waves. The body comes into contact with a liquid, which can lead to uncontrolled contamination of the surface. In [5], the authors describe the method of surface deformation under the action of a highly inhomogeneous electric field. This non-contact excitation method is suitable for measurements in the high-frequency range. However, the use of this technique in the systems with ionic surfactants and in conductive media may lead to electroconvection.
2 Experimental setup
An instantaneous relief of the surface was registered by the optical interference method, which has high sensitivity and spatial resolution. It is based on interference of two coherent beams. The beams have been obtained by dividing the original laser beam using a semitransparent mirror. The first, a supporting beam, usually has a plane wave front. The second, a subject wave, passes through the considered inhomogeneity and has a complicated wave front shape that carries information about the sample being probed.
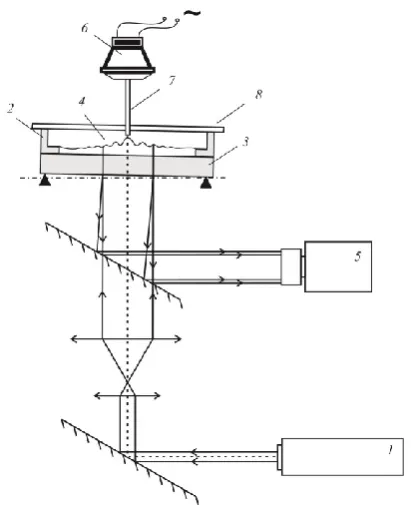
The scheme of the Fizeau interferometer we use here is given in Fig.1. The collimated beam of 1 cm in diameter from He-Ne laser 1 passes through the beam-splitter and falls on the experimental cuvette 2. It is sequentially reflected from the bottom of the cell 3
(plane-parallel glass plate of high optical quality) and the free surface of the liquid layer 4 of the liquid under examination. The superposition of the two reflected beams forming the interference pattern observed with the help of the Baumer TXG50 camera 5. Field of view of the camera 5 is 1 cm and matrix resolution is 2500 to 2000 pix, which ensures spatial resolution of 5 μm/pix. The ADC of the camera is operated in 12 bit regime, which allows us to increase the sensitivity by several times in comparison with the 8 bit ADC. The frame exposition time is 4 μs, which excludes traveling wave image blurring in the entire frequency range. The camera has not supplementary cooling, which significantly reduces the theoretically achievable value of the signal-to-noise ratio. As the sensitivity of the interferometer is high, the details of the relief can be detected with a spatial resolution of a few nanometres. PC was used to record the profile image.
The reference plate 3 and the interface form the angle of approximately 30', which allows us to observe the interface deformation in the interference fringes of constant thickness. Such approach makes it possible to apply the spatial phase shifting technique for more precise reconstruction of the interface relief.
Two measurement cells 2 cm and 9 cm in diameter are used in the experiments. To estimate the influence of the layer dimensions on the characteristics of the excited waves, the depth of the liquid layer varied in the range of 0.2–3.0 mm. The small measurement cell was filled with a liquid up to the sharp rim (Fig. 1) to minimize the influence of the meniscus. In the large measurement cell, the meniscus was rather far so that it had no effect on the interface shape at the center of the cuvette.
The capillary wave was excited by periodical pressure pulsations induced by the local acoustic impact on the interface. The acoustic wave were generated by the miniature speaker 6 connected to the AC generator. The thin steel tube 7 (0.8 mm in diameter and 25 mm length) was used as a waveguide. The face of the tube located at a 0.1 mm distance from the liquid surface was installed through the hole in the top cover 8, which served to prevent the liquid evaporation and contamination.
The modified capillary wave method was tested with n-decane and with high purity water, the surface of
which was additionally cleaned. The method was tested by studying the water surface covered with an oleic acid (Alfa Aesar, Germany) monolayer. The surfactant was previously dissolved in n-hexane in the ratio of 1:10000 and then a known amount of the solution was spread by a micro syringe onto the water surface in a drop-wise manner. A homogeneous monolayer remained at the interface after complete evaporation of the solvent.
The measurements of surface tension were performed by the Wilhelmy plate method using a Sigma 701 tensiometer (KSV Instruments Ltd, Finland). The temperature of the examined liquids was 25.0±0.5° C.
3
Data processing
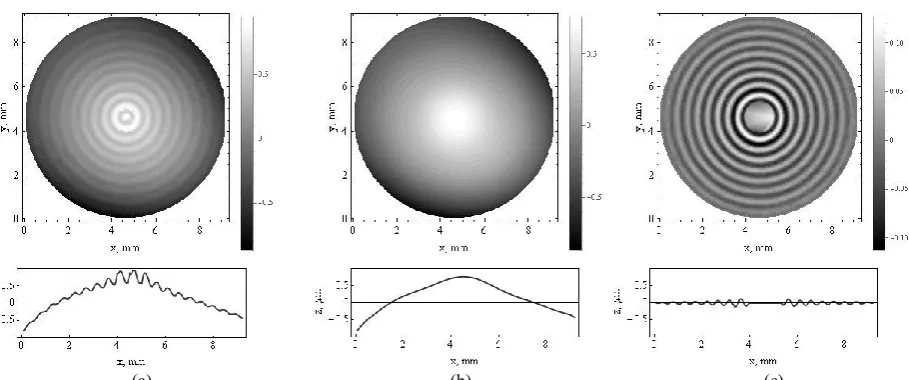
The resultant interferograms were processed in three steps. First, a 3D interface profile was reconstructed from the interferogram using the IntelliWave (ESDI, USA) software, which was further exploited to preprocess maps. The instantaneous surface profile is the superposition of a large scale relief and a running cylindrical capillary wave with high spatial frequency and low amplitude (Fig. 2a). The large scale relief is formed from the constant meniscus profile with large-scale oscillations caused by external vibrations which occur in the absence of an additional vibration protection system. This part of the signal is parasitic and it does not contain any useful information. Therefore, it was approximated by the fifth order Zernike polynomial function (Fig. 2b) and subtracted from the measured relief. Such an approximation allows one to reproduce a profile of the damped cylindrical wave (Fig. 2c), which was approximated by the following function:
( , ) 0 [ ( k r)]
r
r i t
z
z x y e e (1)
where z0 is the wave amplitude, ω=2πν is the excitation frequency, t is the time, r is the radius vector from the point of wave excitation, k is the wave vector, and β is the damping coefficient (Fig. 3).
The wave damping coefficient splits into two parts: the first ~1/√r is due to the cylindrical geometry, and the second ~ r
e is caused by fluid viscosity and the viscoelastic properties of the surface layer. The described experimental data processing procedure was applied to series images (5 interferograms), and then the measured wave characteristics were averaged.
Knowing the wave number k determined in the present approximation, the density of the considered substance ρ and the depth of the layer H, we calculate the surface tension σ by the formula:
2 2
1 3
4
-( ) k
k th kH g
(2)
This formula cannot be used to evaluate the influence of liquid viscosity η. For this purpose, we apply the following formula [9]:
3 2
2
1 6 4k
k
(3)
where σk is the Kelvin equation [3]:
2 2
3 4k g
k
k (4)
Computations were performed with Mathematica 9.0 (Wolfram research). The accuracy of determination of k
was 0.1%.
4
Results and discussion
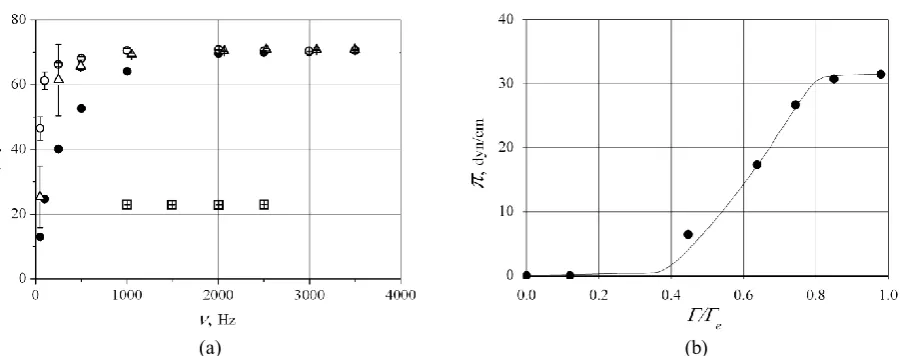
The dependence of surface tension on excitation frequency obtained in the experiments with different parameters is presented in Fig. 4a. For water in the cuvette 9 cm in diameter and the layer thickness of 0.2 mm, the value of σ was determined taking into account (●) and without taking into account (○) the depth of the liquid layer according to formulas (2) and (4), respectively. Comparison shows that the results for σ1 and σk for ν≤1000 Hz differ significantly. Formula (3), which does not take into account the depth of the liquid layer, gives underpredictable values at the frequencies less than 500 Hz .This is probably associated with the growth of the viscosity effect on the surface profile as the capillary wave length increases. In the high frequency range (>1500 Hz), all the experimental data coincide and are close to the table values of the surface tension of water (71.8±0.1 dyn/cm for t=26° C) and n-decane (23.3±0.2 dyn/cm for t=26° C) obtained by the Wilhelmy plate method.
The results for the cell of a larger radius and in the cuvette 2 cm diameter with 0.4 mm layer thickness (Δ) were compared as well. The analysis of the results has
Fig. 3. Fluid profile approximation: points ¬ experimental data, solid line ¬ the result of approximation by function (1). Vertical black lines limit the central region of the experimental points, which are not used in the approximation.
(а) (b) (c)
revealed that the size of the experimental cell can also affects the results obtained in the low-frequency region. Hence,it can be concluded that the dynamic frequency range for water within which the surface tension was measured without systematic errors is ν≥1500 Hz. The n-decane data (□) obtained with ν=1000 Hz indicate that the dynamic frequency range for the liquid having a lower surface tension can be extended.
The experimental study demonstrates that in the frequency range higher than 1 kHz, the amplitude of parasitic oscillations is smaller compared to those of capillary waves, and the wavelength of capillary waves in this frequency range is less than the layer depth, and therefore the data can be described by Kelvin's equation without taking into account the finiteness of the layer depth. For more accurate definition of surface tension in the high frequency range, it is essential to take into account liquid viscosity because its contribution increases as the frequency rises.
On this basis, we also measured the surface pressure π of the oleic acid film on the water surface for different concentration values using the capillary wave method and the Wilhelmy plate method. The results are presented in Fig. 4b. It is known that the surface pressure is the difference between the surface tension of a pure liquid and that of the liquid with surfactant. Our experiments were performed in a water system consisting of the cuvette 2 cm in diameter and the liquid layer of thickness 0.3 cm. The surface tension was measured by the capillary wave method. Tests were conducted at the 2500 Hz frequency. Using formula (3), we calculated surface tension in the case when the liquid viscosity was considered. The graph provides evidence that the data obtained by the capillary wave method (●) and the data obtained by the conventional Wilhelmy plate method are good agreement.
5 Conclusion
In this paper, the well-known capillary wave method of measuring surface tension has been significantly
modified. We have developed a new noninvasive method for wave excitation, 3D surface profiles registration with application of interferometry and original field post-processing algorithms. The 3D surface profiles registration significantly increases the accuracy of determining the wave number in comparison with the local measurements. The wavelength error at one realization is 0.01%. The dynamic frequency range in which the method yields reliable results is determined. It is shown that the high frequency range (higher than 1 kHz for water) is the most appropriate range for this method. At such frequencies, the method is not sensitive to the depth and viscosity of the liquid layer, which makes it possible to ignore these parameters and to use formula (3) for calculations. One more advantage of the modified method is the small volume of the working fluid (~0.1 cm3). This advantage is essential to perform biophysical and physicochemical studies, in which the test substances are often limited or they are rather expensive. The described advantages of the method can be decisive in the problems where the measure of the surface tension in a force field, for example a magnetic field, is required. Such systems are liquid crystals, for which the anisotropy of surface tension in a certain phase state is assumed, and magnetic fluids, for which the question regarding the effect of an external field on the interfacial tension remains open.
A disadvantage of the capillary wave method is the liquid viscosity. Due to high viscosity, the waves exhibit fast attentuation and the parts of the surface relief are below the instrument precisin. If this limitation is taken into account, reliable results can be obtained.
In our opinion, the advantages of the modified capillary wave technique will favor its use in particular tasks.
The work was supported by the RFBR-ra (project 17-41-590095).
(a) (b)
References
1. W. Thomson, Phil. Mag. 42, 448 (1871)
2. R.S. Hansen, J. Ahmad, Progress in Surface and Membrane Sci., 4, 1 (1971)
3. L.D. Landau, E.M. Lifshitz, Fluid Mechanics Theoretical Physics: Vol. 6 (3dеd. М.: Science. physmath. lit., 1986)
4. E.H. Lucassen-Reynders, J. Lucassen, Advances in Colloid and In. Sci., 2, 347 (1970)
5. F. Behroozi, B. Lambert, B. Buhrow, Applied Physics Letters, 78, 2399 (2001)
6. B.A. Noskov, Interfacial rheology (Leiden: Brill Publ.; 2009)
7. C.H. Sohl, K. Miyano, J.B. Ketterson, Review of Scientific Instruments, 49, 1464 (1978)
8. N. Mucic, A. Javadi, N.M. Kovalchuk, E.V. Aksenenko, R. Miller, Advances in Colloid and Interface Science, 168, 167 (2011)