Continuous Integration service at Fermilab
VitoDi Benedetto1∗,VladimirPodstavkov1,MicheleFattoruso1,BrunoCoimbra1 1Fermi National Accelerator Laboratory, Batavia, IL, 60510 USA
Abstract.This paper describes the current architecture of Continuous Integra-tion (CI) service developed at Fermilab, encountered successes and difficulties,
as well as future development plans. The current experiment code has hundreds of contributors that provide new features, bug fixes, and other improvements. Version control systems help developers to collaborate in contributing software for their experiments, while the CI system helps developers keep their code healthy. The Fermilab CI service allows experiments and projects to test and validate their offline production and analysis code on the supported platforms.
It is built on top of Jenkins, designed to be set up from a configuration file that provides implementation for each phase of the CI workflow, and able to validate experiment code through grid jobs. This CI service provides a dash-board for easy access to logs and statistical graphs. Since the CI service has been adopted by Fermilab experiments/projects, it proved to be very useful to
intercept issues in their code early on and get them fixed before running it in production. Currently the CI service is in use by the ArgoNeuT, DUNE, g-2, LArIAT, MINERvA, mu2e, NOvA, SBND and uBooNE experiments and by the following projects: ART and LArSoft software suites, GENIE, and Glidein-WMS. The CI service is under active development and planning to support code profiling.
1 Introduction
Fermilab Continuous Integration (CI) service aims to provide a common framework for all Fermilab experiments1and software projects2to build and test their software.
Adopting the CI development practice, experiments ensure that well tested code is put into production which reduces eventual waste of computing and human resources.
This service offers an access to comprehensive testing from unit tests to physics validation through regression test on multiple platforms/compiler/optimization that are supported by code developers. This CI system is based on the open source Jenkins toolkit [1] and it offers a powerful tool for testing complex software. It has a dedicated database and a web based dashboard to monitor the status of the code.
The CI dashboard clearly indicates issues and provides a quick overview of the code status to release managers and developers. It provides easy access to logs to identify issues
∗e-mail: [email protected]
1currently onboarded experiments are: ArgoNeuT, DUNE, ICARUS, LArIAT, MicroBooNE, MINERvA, Mu2e,
g-2, NOvA, SBND
and clearly reports the code revisions used in the CI build to easily track down the commit that caused the issue.
The CI system collects statistics about resource usage from regression tests and physics validation jobs running on the grid. Those statistics are useful to monitor how memory usage and run-time change while features on the tested code are added/updated. If the resource usage delta is too high the CI raises a warning and the release manager is notified so (s)he can follow up on it.
This service implements a notification that, when the CI build is completed, i.e. the code is built and tested, it reports, through an email and/or a Slack [2] notification, the final status of the CI build (i.e. successful, warning, failure), and, if it is not successful, there are few details about what was wrong.
2 CI workflow configuration
The CI service is used by a wide variety of experiments and projects that come with different development tool solutions and the CI needs to be able to handle all of them:
• They use different build systems: CMake[3], Make[4], and custom ones (MRB[9], SRT, SCons[10]). Each build system can have its own way to define the compiler to use and related compiler optimization.
• They use different Version Control Systems: CVS[5], SVN[6], GIT[7], Mercurial[8]. • They have repositories hosted on Fermilab Redmine, GitHub, HEPForge, and eventually
more.
• They develop and run the code on different platforms SL6/7, Mac OSXs.
• The CI system needs to be able to cooperate with all those development tools and platforms. This is achieved by using a CI workflow configuration file that uses the INI format. The workflow configuration allows the user to run an “almost” arbitrary procedure by providing the instruction that are needed to accomplish each workflow step. This makes the workflow configuration file fairly easy to set up.
A workflow consists of multiple steps or phases executed sequentially. Typical workflow phases are: environment setup, code checkout, build, unit tests, install, regression tests and validation tests. Some phases can execute tasks in parallel to optimize the use of build node resources and get results quicker.
The flexibility of the INI file paradigm allows to combine the phase name with the specific action to perform for that phase. For each phase the user can define the following items: the working directory; initialization and finalization procedures; the command to execute the task; logs to report; how to filter logs sent by the final report.
Beside a standard workflow configuration used by default CI builds, there are workflows to update the reference files used by regression tests, and validation workflows. The valida-tion workflow has its own dedicated configuravalida-tion file that defines stages of the validavalida-tion workflow, provides resource requirement for the grid job, and more.
3 CI system architecture
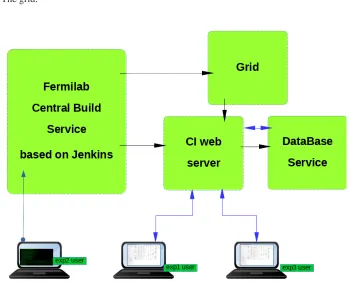
The CI system has five major components as shown in Figure 1: • The central build server based on Jenkins,
and clearly reports the code revisions used in the CI build to easily track down the commit that caused the issue.
The CI system collects statistics about resource usage from regression tests and physics validation jobs running on the grid. Those statistics are useful to monitor how memory usage and run-time change while features on the tested code are added/updated. If the resource usage delta is too high the CI raises a warning and the release manager is notified so (s)he can follow up on it.
This service implements a notification that, when the CI build is completed, i.e. the code is built and tested, it reports, through an email and/or a Slack [2] notification, the final status of the CI build (i.e. successful, warning, failure), and, if it is not successful, there are few details about what was wrong.
2 CI workflow configuration
The CI service is used by a wide variety of experiments and projects that come with different development tool solutions and the CI needs to be able to handle all of them:
• They use different build systems: CMake[3], Make[4], and custom ones (MRB[9], SRT, SCons[10]). Each build system can have its own way to define the compiler to use and related compiler optimization.
• They use different Version Control Systems: CVS[5], SVN[6], GIT[7], Mercurial[8]. • They have repositories hosted on Fermilab Redmine, GitHub, HEPForge, and eventually
more.
• They develop and run the code on different platforms SL6/7, Mac OSXs.
• The CI system needs to be able to cooperate with all those development tools and platforms. This is achieved by using a CI workflow configuration file that uses the INI format. The workflow configuration allows the user to run an “almost” arbitrary procedure by providing the instruction that are needed to accomplish each workflow step. This makes the workflow configuration file fairly easy to set up.
A workflow consists of multiple steps or phases executed sequentially. Typical workflow phases are: environment setup, code checkout, build, unit tests, install, regression tests and validation tests. Some phases can execute tasks in parallel to optimize the use of build node resources and get results quicker.
The flexibility of the INI file paradigm allows to combine the phase name with the specific action to perform for that phase. For each phase the user can define the following items: the working directory; initialization and finalization procedures; the command to execute the task; logs to report; how to filter logs sent by the final report.
Beside a standard workflow configuration used by default CI builds, there are workflows to update the reference files used by regression tests, and validation workflows. The valida-tion workflow has its own dedicated configuravalida-tion file that defines stages of the validavalida-tion workflow, provides resource requirement for the grid job, and more.
3 CI system architecture
The CI system has five major components as shown in Figure 1: • The central build server based on Jenkins,
• The CI web server,
• The CI dashboard, • The CI DataBase, • The grid.
Figure 1.CI system architecture schema
The central build server based on Jenkins provides build nodes with different versions of SL and Mac OSX platforms. A CI build job can be triggered in different way:
• on demand by users that need to test a feature branch (s)he is working on, • by a commit in the develop branch of one of the monitored repositories, • by a cron job that runs nightly, weekly.
When a CI build job is triggered, Jenkins takes the request and starts the job on the selected platforms. The first step of the job is to parse the configuration file that describes the CI workflow. Now the job knows the required actions and it can run the associated commands. For each phase the CI collects the status, logs and statistics that are sent to the CI web sever through a dedicated API. All that information is processed and sent to the CI DataBase to be stored. The phase status can be success or failure, but for regression tests there is also a warning status. The warning status is used to describe the status of a test that successfully executes the command and produces the required output, but eventually the output is different from the reference, or resources usage are outside a predefined range. In this case the code is able to run properly, but it could use some attention from developers, for example to make sure that the output differences compared to the reference are expected.
like the code revision used in the test, the compiler together with its optimization, a link to the Jenkins workspace, a link to the CI dashboard to have a quick look at the overall status of the code. In case some regression test are reported with warning or failure, they are listed in a table that provides a link to the logs and the reason of the warning/failure. This helps developers to have a quick diagnosis of issues.
When a new release is ready to be distributed the release manager can trigger a CI build on demand that runs, among the standard unit test and regression tests, also validation tests. Usually validation tests require more resources than regression tests, for this reason validation tests are executed on the grid.
While validation jobs run they use a dedicated API to update their status on the CI dash-board. This allows the user to have a global view of the status of the validation workflow. When jobs that produce data are completed, the CI submits a job that processes the data and extracts out of them relevant information for validation results. This information is organized in plots that are stored in the CI DataBase to be shown through the CI dashboard. The CI system provides the possibility to overlay validation results from different code versions and compare the results providing aχ2 that describes how good results from the current code
version matches the reference.
4 CI dashboard
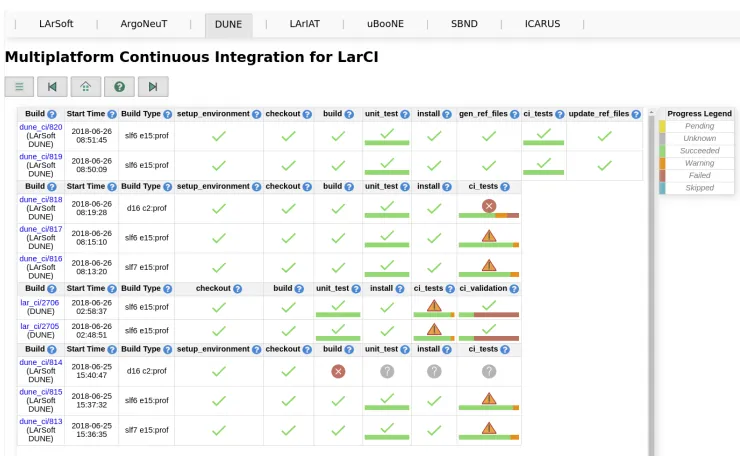
One of the key component of the CI service is the CI dashboard. This is the tool used by release managers and developers to check the status of their code, and, in case of issues, the place where they can find detailed information about the issue. The main view of CI dashboard is shown in Figure 2.
Figure 2.CI dashboard
like the code revision used in the test, the compiler together with its optimization, a link to the Jenkins workspace, a link to the CI dashboard to have a quick look at the overall status of the code. In case some regression test are reported with warning or failure, they are listed in a table that provides a link to the logs and the reason of the warning/failure. This helps developers to have a quick diagnosis of issues.
When a new release is ready to be distributed the release manager can trigger a CI build on demand that runs, among the standard unit test and regression tests, also validation tests. Usually validation tests require more resources than regression tests, for this reason validation tests are executed on the grid.
While validation jobs run they use a dedicated API to update their status on the CI dash-board. This allows the user to have a global view of the status of the validation workflow. When jobs that produce data are completed, the CI submits a job that processes the data and extracts out of them relevant information for validation results. This information is organized in plots that are stored in the CI DataBase to be shown through the CI dashboard. The CI system provides the possibility to overlay validation results from different code versions and compare the results providing aχ2 that describes how good results from the current code
version matches the reference.
4 CI dashboard
One of the key component of the CI service is the CI dashboard. This is the tool used by release managers and developers to check the status of their code, and, in case of issues, the place where they can find detailed information about the issue. The main view of CI dashboard is shown in Figure 2.
Figure 2.CI dashboard
Each row in the CI dashboard is associated to a CI build job, while each cell is associated to a specific phase that ran in that CI build. The status of the phase is reported by a check-mark that uses different shape and color depending on the status. The user can easily identify
phases with issues and, by clicking on the check-mark, they can access logs and statistics that helps to identify the cause of the issue.
The checkout check-mark gives access to the list of code revisions for all repositories used in the CI build and it also provides a link to the repository that shows the revision history up to the tested commit.
The unit test check-mark gives access to the list of unit tests executed in the CI build with individual status. If there are failed unit tests they are shown at the top of the list and they provide a link to the associated logs.
The CI tests check-mark gives access to a variety of information about each regression test. There is information about memory usage, %CPU usage, run-time and a normalized run-time to take into account that build nodes are different and eventually with different load. All those statistics can be visualized as time series, this allows the user to check how those statistics change as the code gets improved and extended with new features, and, eventually, they show some anomalies that require attention.
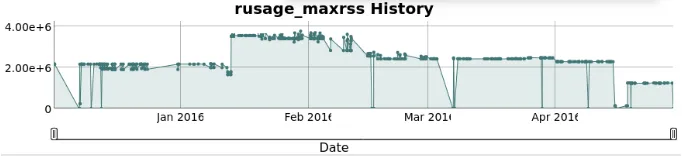
Figure 3.CI regression test memory usage
As an example, Figure 3 shows the memory usage trend for a regression test over time. The jump occurred in mid January 2016 was due to the integration in the experiment code of a tool to improve the simulation accuracy of cosmic rays on their detector. Then, after few months of work to improve the code, while looking at a more efficient resources usage, the memory footprint was lower than before, while they got improved results for their Physics studies.
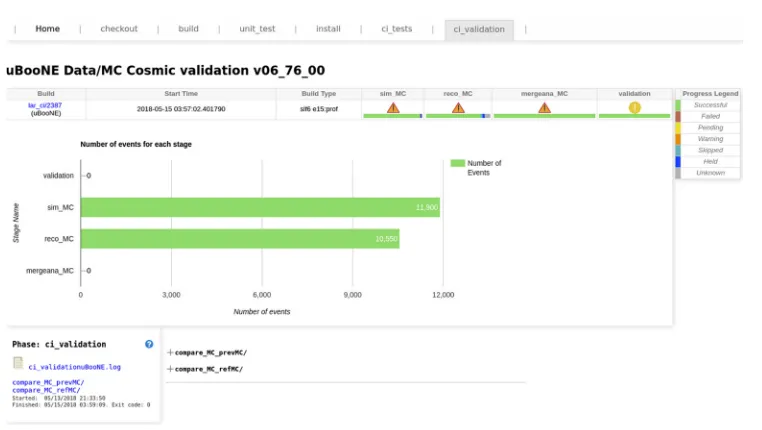
The CI validation check-mark gives access to a dedicated dashboard that shows informa-tion about many aspects of the validainforma-tion workflow. An example of the validainforma-tion dashboard is shown in Figure 4.
This dashboard provides information for each stage of the experiment validation work-flow. Stage check-marks provide an overview of the grid jobs status, the user can get more detailed information by hovering the mouse on each stage check-mark. When the validation workflow is completed, validation results, in form of plots, pdf reports or text files, are sent to the CI DataBase. Then the release manager can access those validation results through the CI validation dashboard. Plots and documents can be organized in folders that, by default, are collapsed to have a cleaner interface. For each stage the user can also access a set of plots with statistics about grid job resource usage. When the CI Validation workflow is completed, the CI sends a summary report through Slack to notify the release manager that validation results are available.
Figure 4.CI validation dashboard
5 Summary
The Fermilab CI service provides a comprehensive framework for Fermilab experiments and projects to test and validate their offline production and analysis code on the supported platforms. It allows to validate experiment code through grid jobs. This service provides a dashboard for easy access to logs and statistical graphs. Currently the CI service is used by ArgoNeuT, DUNE, g-2, ICARUS, LArIAT, MINERvA, mu2e, NOvA, SBND and uBooNE experiments and by following projects: ART and LArSoft software suites, GENIE, GlideinWMS and Rivet. This service has proved to be very useful to intercept issues in ex-periments code early on and get it fixed before running production jobs. Future development plans for this project includes: enhanced physics validation features and support for code profiling.
Acknowledgments
This manuscript has been authored by Fermi Research Alliance, LLC under Contract No. DE-AC02-07CH11359 with the U.S. Department of Energy, Office of Science, Office of High Energy Physics. The U.S. Government retains and the publisher, by accepting the article for publication, acknowledges that the U.S. Government retains a non-exclusive, paid-up, irrevocable, world-wide license to publish or reproduce the published form of this manuscript, or allow others to do so, for U.S. Government purposes.
References
[1] Jenkins project, “Jenkins” [software] version 2.120, 2018. Available from https://github. com/jenkinsci/jenkins/releases/tag/jenkins-2.120
[2] Slack project, “Slack” [software] version 3.2, 2018. Available from https://slack.com [3] K. Martin and B. Hoffman, IEEE SoftwareVol. 24 Issue 1, 46-53 (2007)
[4] GNU Make, “Make” [software] version 3.81, 2006. Available from http://ftp.gnu.org/ gnu/make/make-3.81.tar.gz
[5] CVS Project, “CVS” [software], version 1.11.23, 2008. Available from http://ftp.gnu.org/ non-gnu/cvs/source/stable/1.11.23/cvs-1.11.23.tar.bz2
[6] Subversion Project, “Subversion” [software] version 1.6.11, 2010. Available from https: //archive.apache.org/dist/subversion/subversion-1.6.11.tar.gz
[7] GIT Project, “git” [software], version 2.15.2, 2018. Available from https://github.com/ git/git/releases/tag/v2.15.2
[8] Mercurial Project, “Mercurial” [software], version 4.2.3, 2017. Available from https:// www.mercurial-scm.org/release/mercurial-4.2.3.tar.gz
[9] MRB Project, “MRB” [software], version 1.16.02, 2018. Available from https://cdcvs. fnal.gov/redmine/projects/mrb/repository?rev=v1_17_02