Forecasting Foreign Direct Investment Inflows into India
Using ARIMA Model
Dr.K.Nithya Kala & Aruna.P.Remesh,
1Assistant Professor, PSGR Krishnammal College for Women, Coimbatore, Tamilnadu, India
2PhD Research Scholar (FT), PSGR Krishnammal College for Women, Coimbatore, Tamilnadu,
India
ABSTRACT
The aim of this research is to forecast the inflows of foreign direct investment into India for twelve months. For that purpose ARIMA (Auto Regressive Integrating Moving Average) model is used. This study covers 17 years monthly FDI inflow data of India. Before forecasting the value of FDI inflows it is essential to test the stationarity of the data series. The data set is found to be non-stationary at level and is non-stationary at first differencing. The study results shows that the total inflow value during July 2017 to July 2018 is 163899.64million US dollars and the average inflow value during these periods is 12607.66million US dollars. The predicted average percentage of increase in the inflows will be 7.69%.
Keywords: FDI, Augmented Dicky Fuller Test, ARIMA, Forecasting, Time series.
INTRODUCTION
FDI is an important source of finance for all developing countries especially in India .Need
investment rate in any country. Foreign Direct investment acts as a bridge to fulfil the gap between investment and saving. In the process of economic development foreign capital helps to cover the domestic saving constraint and provide access to the superior technology that promotes efficiency and productivity of the existing production capacity and generate new production opportunity.
To forecast the foreign direct investment inflows using ARIMA model.
REVIEW OF LITERATURE
Salah (2011): He forecasted the inflow value of FDI in Jordan for a period of twenty years. The tools used for analysis were Minitab and E-Views3.1.He found out that the expected FDI inflow will be 29207.06 during the year 2030 with a growth rate of 3.2%.
Prasanna (2015): Forecasted the FDI inflow value of Srilanka between 2014-2064.For forecasting the data he used ARIMA (1, 1, 6) and ARIMA (1, 0, 6) had been used. The results of the study found out that Srilanka would receive more than 2 billion dollars during the forecasted periods.
RESEARCH METHODOLOGY
To forecast the inflow values of FDI, data for a period of 17 years (April 2000 to June 2017) have been taken from RBI website(Reserve Bank of India), DIPP (Department Of Industrial Policy And Promotion) website. The data series consists of 207 observations. So for getting more reliable result logarithmic values of FDI inflows are also used. All the values are in US dollar million. Analysis has been done by using E-views 7.
Steps in ARIMA modelling
The following are the steps in ARIMA Modelling
1) Identify model 2) Estimate Parameters 3) Diagnostic checking 4) Forecasting
Hypothesis
Null hypothesis, Ho=Variable is not stationary.
Alternate hypothesis, H1=Variable is stationary.
ANALYSIS AND INTERPRETATION
Before forecasting the inflow values, the time series values must be checked for stationarity. In time series analysis stationarity of data can be checked by using Augmented Dicky Fuller Test (ADF) test. So in ADF test it is essential to check the stationarity of the variable at level and at first or second order differencing. If it stationary at first order difference it can be represented as I (1).If it is stationary at second order difference it can be represented as I (2).The results of Augmented Dicky Fuller Test as follows.
The table no: 1 shows that FDI inflow values are non-stationary at level. But they are found to be stationary at their first differencing. ARIMA MODEL FORECASTING
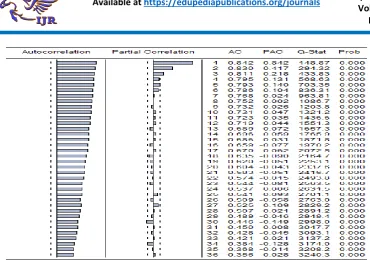
The first and foremost step in forecasting is model identification with the help of a correlogram
<Insert Figure No: 1 here>
From figure no: 1, it is found that the model for forecasting is AR (1), because the number of spikes decays after first lag.
Now the second step is to estimate the parameters.
<Insert Table No: 2 here>
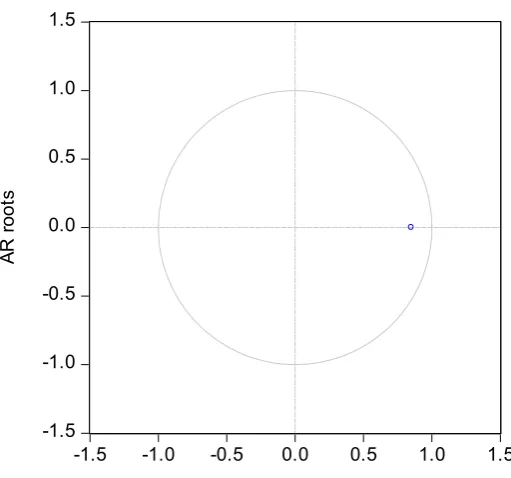
From table no: 2 it is found that the variable is statistically significant. Because the probability value is less than 0.05%.Now the third step is diagnostic checking. Ie, statistically checking whether the model is fit for forecasting or not. The diagnostic checking can be done with the help of ARIMA graph and a table.
< Insert Figure no: 2 here> < Insert Table no: 3 here>
From figure no 2 and table no: 3 it is found that the model is good fit. This model satisfies
model satisfies all the requirements of forecasting.
RESULTS OF ARIMA FORECATING
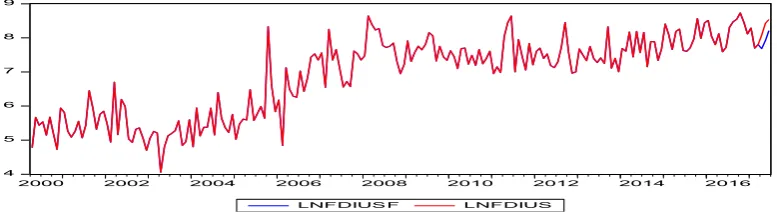
< Insert Table no: 4 here> < Insert Figure no: 3 here>
The above graph shows the FDI inflows after forecasting. The red line in the graph shows the actual data and the blue line in the graph shows the forecasted value of FDI inflows. LNFDIUSF stands for the log(FDI) inflow values in us dollars million after forecasting and LNFDIUS stands for log(FDI) values in us dollars million .
CONCLUSION
The forecasting result shows an increasing trend. The policy makers of India and the foreign investors of other countries can plan their investment strategies based on this results. They can formulate better policy decisions for the next coming months of investment.
REFERENCES
Journals
1) Abhijit Biswas,” Forecasting Net Foreign Direct Investment Inflows in India: Box-Jenkins ARIMA Model”,
International Journal of Management &Business Studies, Vol5, Issue-3, July-Sep-2015, ISSN no: 2230-9519(online)/ISSN no: 2231-2463(print), pp: 49-58
2) Prasanna Perera, W.L.,” Forecasting Foreign Direct Investment (FDI) in Srilanka for the period from year 2014-2064”,International Journal of Arts and Commerce, Vol4, Issue-1,January 2015,
ISSN no:1929-7106,pp-34-44.
3) Salah .T.Al-rawashdeh, Jaafar H. Nsour, Rafat.S. Salameh,” Forecasting Foreign Direct Investment in Jordan For the years (2011-2030)”, International Journal of Business and Management”, Vol6, Issue-10, October2011, ISSN no: 1833-3850, pp-138-154.
Websites
1) Department Of Industrial Policy And Promotion (DIPP), www.dipp.nic.in
2) Reserve Bank of India (RBI), Bulletin,
www.rbi.org.in
APPENDIX
Table 1: Results of Unit Root Testing Using Augmented Dicky Fuller Test
FDI Inflow values at level
FDI Inflow values at first differencing ADF test Statistics -1.815180 -11.18630
p-value 0.3724 0.0000
Source: Author compilation using E-views
Source: Author compilation using E-views
Table no: 2
Variable Coefficient Std. Error t-Statistic Prob.
C 7.006229 0.281887 24.85474 0.0000
AR(1) 0.850407 0.036406 23.35882 0.0000
R-squared 0.727867
Mean dependent var 6.902424
Adjusted R-squared 0.726533 S.D. dependent var 1.150917
S.E. of regression 0.601861 Akaike info criterion 1.832080
Sum squared resid 73.89621 Schwarz criterion 1.864389
Log likelihood -186.7042 Hannan-Quinn criter. 1.845147
F-statistic 545.6347 Durbin-Watson stat 2.738534
Prob(F-statistic) 0.000000
Inverted AR Roots .85
Source: Author compilation using E-views
Source: Author compilation using E-views
Table no: 3
AR Root(s) Modulus Cycle
0.850407 0.850407
No root lies outside the unit circle. ARMA model is stationary.
Source: Author compilation using E-views
Table no: 4
MONTH&YEAR FORECASTED
VALUE(in us dollar million)
FORECASTED VALUES IN %
JULY-2017 5746.527 3.50
AUGUST-2017 6450.98 3.94
SEPTEMBER-2017 7241.791 4.41
OCTOBER-2017 8129.546 4.96
NOVEMBER-2017 9126.128 5.57
-1.5 -1.0 -0.5 0.0 0.5 1.0 1.5
-1.5 -1.0 -0.5 0.0 0.5 1.0 1.5
A
R
r
oo
ts
DECEMBER-2017 10244.88 6.25
JANUARY-2018 11500.78 7.01
FEBRUARY-2018 12910.63 7.87
MARCH-2018 14493.31 8.85
APRIL-2018 16270.02 9.92
MAY-2018 18264.52 11.14
JUNE-2018 20503.53 12.50
JULY-2018 23017.01 14.04
TOTAL 163899.64 99.96
AVERAGE 12607.66 7.69
Source: Author compilation using E-views
Figure no: 3(ARIMA FORECASTED GRAPH)
Source: Author compilation using E-views
4 5 6 7 8 9
2000 2002 2004 2006 2008 2010 2012 2014 2016