Available online: https://edupediapublications.org/journals/index.php/IJR/ P a g e | 2625
A Study on Performance of IPOs in Indian Stock Market
Umang Mehta*
Abstract
One of the biggest investment opportunity which is considered by investors is Initial Public Offer
(IPO) for which many investors wait to invest in. This paper attempts to study the performance
of IPO over short and long term (one year) that how IPOs generate return over a period of time.
And whether investors should invest in IPOs just for speculation that is to take listing gains or
they should hold the shares over a period of time to earn fair enough amount of return. Raw
Returns, Market Adjusted Excess Returns(MAER) are calculated and Result revealed that nine
IPOs studied performed well not only at the time of listing but also investment in the IPOs for
long term generated around double digit profits for the investors.
Keyword: -IPO, investors, Raw Returns, MAER.
*Assistant Professor Prestige Institute of Management and Research, Indore
INTRODUCTION
An initial public offering (IPO) is a key in signpost in a company’s growth. A strong IPO market
is essential for many reasons. IPOs provide the emerging companies liquidity for their funds. An
IPO brings in new investors for a company, which facilitates the company’s access to future
development capital. And once public also reduces the costs of raising future capital by
stimulating the supply of information from the investment population. The cost of external equity
capital for companies going public depends not only upon the transaction costs incurred in going
public but also upon the returns that investors receive in the aftermarket(Ritter 1991).
IPO’s are time and again looked upon as a speculative outlook to earn abnormal profits on the
Available online: https://edupediapublications.org/journals/index.php/IJR/ P a g e | 2626 which demands to focus more on short term profits rather than long-term growth. The actions of
the company's management also become gradually more scrutinized as investors constantly eye
for rising profits.
There are numerous reasons why the long-run performance of initial public offerings is of
importance.But from an investor's point of view the presence of price patterns may provide
opportunities for trading to generate superior returns. Also the returns of IPOs were predicted
with the number of times the issue got the subscription (Shah 1995). For long-run
underperformance for Indian IPOs, factors like under pricing (listing day return), offer size,
timing of issue, age of IPO Company, and rate of subscription, promoter retention, and
price-to-book value are considered (Sahoo & Rajib 2010).
The performance of IPO can be measured in two ways the short-run and long-run performance.
The short-run performance is usually measured over a period of a few days to a month upto an
year after an IPO, while the long-run performance is investigated looking at periods longer than a
year.This paper attempts to evaluate performance of IPOs up to a period of 12 months including
the listing day.
REVIEW OF LITERATURE
Ritter (1984) examined over 5000 IPOs from 1960 to 1982 and reports initial return of 18.8%
higher than the offering price shortly after listing. In addition, during the 15-month period, the
mean return of common stocks purchased at the offer price and sold at the closing bid price on
the first day of public trading was 48.4%. This is in distinction to a mean return of 16.3% during
the remainder of the 6-year period 1977 through 1982.
Shah (1995) in the study of 2056 IPOs from the period of January 1991 to May 1995 recognized
a exceptionally 105.6% higher return over the offer price of the IPOs. Nevertheless, this study
provided confirmation on the short run performance only.
Rajan & Servaes (1997)developed a simple model in their work in which two market conditions
Available online: https://edupediapublications.org/journals/index.php/IJR/ P a g e | 2627 conditions partially explain the three anomalies associated with the IPO market under pricing,
windows opportunity for new issues and long-term underperformance. The model is tested using
a sample of company’s IPOs over the period of 1975-1987.
Banu Durukan (2002) studied IPO from 1990 to 1997 listed on Istanbul Stock Exchange found
that the initial abnormal returns of IPOs is due to overvaluation of share done by the investors on
listing.
Ritter & Welch (2002) confirmed, with some concern, the initial evidence of long-term IPO
underperformance and examined IPO underperformance using 6249 IPOs in the United States
over the period from 1980 to 2001 and found that the number of IPOs varies from year to year,
and that their shares were underpriced by an average of 18.8%.
Sahoo & Rajib (2010) evaluated the price performance of IPOs for short-run under pricing and
long-run underperformance for 92 Indian IPOs for the period 2002-2006 up to a period of 3 years
including the listing day. The result revealed that on an average the Indian IPOs are underpriced
to the tune of 46.55% on the listing day compared to the index performance in the same duration.
Kumar (2010) studied the performance of IPOs issued through the book building process on NSE
in India during the year 1999 to 2006. The sample comprises of 156 company IPOs and found
thhat the IPOs in Indian market were underpriced as they offered positive returns on listing day
and this continued upto two year period but later they underperform the market.
Poornima & Haji & Deepha (2016) in their study said that IPOs perform well when they are hold
for a considerable duration of time of a year.
OBJECTIVE OF STUDY
Available online: https://edupediapublications.org/journals/index.php/IJR/ P a g e | 2628
RESEARCH METHODOLOGY
The Sample
To analyze the performance of IPO the sample of 9 companies whose IPO’s got listed on the
National Stock Exchange (NSE) along with issue size more than 1000 crore has been selected
during the time period of July 2015-Dec 2016.
Tools for data collection
Secondary data of opening and closing prices of shares was collected from National Stock
Exchange website along with the offer documents of companies studied were consultated for
dates and prices of shares offered.
Tools for data analysis
Various statistical techniques have been applied to analyze the secondary data.Data was analyzed
using MS Excel to find out Initial return, Quarterly gains, Average return, Annualizing return,
Market adjusted excess return.
The return on the listing day (R) short term return is calculated by using the formula:
R = (P1 –P0) /P0* 100 ………. Eq. (i)
Where, P1 = Price of share on the listing day
P0 = Issue price
To measure the raw return of IPOs, whether an investor gained or lost by buying the share during
the IPO on offer date and selling at the prevailing price on the opening day the following formula
was used
Ri = (P2-P0)/P0* 100 ………. Eq. (ii)
Where,
Ri = subscribers initial return
P2 = closing price on the first day of trading
Available online: https://edupediapublications.org/journals/index.php/IJR/ P a g e | 2629
Market adjusted excess returns (MAER)
The initial returns would be valid in a perfect market, where there is no time gap between the
application closing date and first day of trading. On the other hand in India there was time gap
between this and a major macro and mico changes could occur in market. Due to this the prices
observed in the market on the listing day may be different from the offer price therefore there is
need to compute market adjusted returns of the IPOs for the same period. Therefore, the initial
return is adjusted for market return as under:
MAER=[(P1-P0)/P0 – (M1-M0)/M0] * 100………. Eq. (iii)
Where,
P1 = closing price on the first day of trading
P0 = offer price
M1 = market index on the first day of trading
M0 = market index on the offer date
MAER = market adjusted excess return
Annualizing factor
Since for different companies, the time taken to list the shares varies, so as to normalize,
annualized returns are calculated by multiplying Raw Return and MAER by the following factor
Annualizing factor = 365/ aftermarket trading lead time
To evaluate long-term performance of Indian IPOs, long-term returns (including initial returns)
has been measured. These figures were compared with the market index (nifty50) in order to
calculate long term MAERs. The following formula has been applied for this purpose.
Rit = [{Pit/Pio}-1] x 100
Rmt = [{Nmt/Nmo}-1] x 100
MAER = Rit – Rmt
Where, Pit = price of the share of firm i at time t
Available online: https://edupediapublications.org/journals/index.php/IJR/ P a g e | 2630 Nmt = nifty at time t
Nmo = nifty on the offer day
Rit = raw return of firm i at time t
Rmt = return on market index during period t
MAER = market adjusted excess returns
As mentioned earlier, annualized long run returns (including initial returns) have been calculated
by taking into consideration annualizing factor.
Annualized Raw Return = Rit*Annualized Factor
Annualized MAER = MAER*Annualized Factor
RESULTS AND FINDINGS
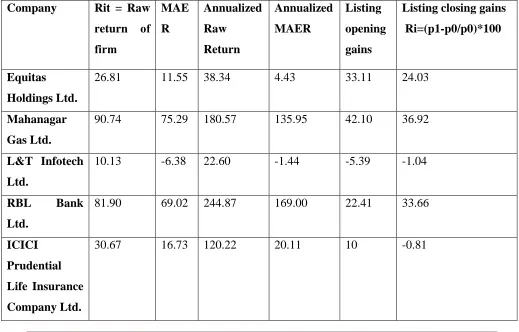
Table I IPO performance calculations using Ri, Rit , MAER Annualized MAER ,Averages, Listing Gains along with mean and standard deviation.
Company Rit = Raw
return of
firm MAE R Annualized Raw Return Annualized MAER Listing opening gains
Listing closing gains
Ri=(p1-p0/p0)*100
Equitas
Holdings Ltd.
26.81 11.55 38.34 4.43 33.11 24.03
Mahanagar
Gas Ltd.
90.74 75.29 180.57 135.95 42.10 36.92
L&T Infotech
Ltd.
10.13 -6.38 22.60 -1.44 -5.39 -1.04
RBL Bank
Ltd.
81.90 69.02 244.87 169.00 22.41 33.66
ICICI
Prudential
Life Insurance
Company Ltd.
Available online: https://edupediapublications.org/journals/index.php/IJR/ P a g e | 2631
Endurance
Technologies
Ltd.
69.59 52.41 347.93 182.34 22.48 38.52
PNB Housing
Finance Ltd.
57.16 35.35 385.81 136.37 14.66 18.82
Varun
Beverages Ltd.
9.72 -10.88 66.85 -7.27 -2.27 4.43
Laurus Labs
Ltd.
10.41 -18.70 316.51 -59.18 15 12.76
Mean 43.01 24.93 191.52 64.47 16.9 18.58
Standard
Deviation
32.33 34.92 138.48 90.45 15.32 15.75
Findings of the research showed highest 33.11% of listing gains in Equitas Holdings Ltd. against
lowest of -5.39% in L&T Infotech. Seven out of nine IPOs studied showed double digit short
term positive return on listing which reflect investor’s interest in IPOs may be to tap this gain as
all IPOs provided positive raw return and with more than 22% of annualized raw return in all
IPOs.
Also listed IPOs continued to provide double digit return on their listing day closing with loss in
only one IPO of less than a percent which strengthens investors trust over the performance of
IPOs and denied the general market thought that IPOs were merely speculative opportunities.
Mahanagar gas Ltd provided 75.29% of MAER followed by RBL bank Ltd 69.02%. Three IPOs
Laurus Labs Ltd., Varun Beverages Ltd., L&T Infotech Ltd. fail to beat the index as they showed
negative MAER and Annualized MAER provides the Endurance Technologies Ltd. with 182.34
% became the highest performing IPO followed by RBL bank ltd with 169%. Along with the
following results IPOs performance is concluded that the returns are the high when the shares are
bought in the primary market and sold in the secondary market and this performance continued
till a year.
Available online: https://edupediapublications.org/journals/index.php/IJR/ P a g e | 2632 The study done is broadly in thought of line that near the peak of the market they are trending in.
When analyzing long-run performance using MAER; IPOs do not underperform over one year,
in fact the IPOs showed over performance. Upon Listing IPOs on an average offered positive
short and long term (one year) return but findings are not conclusive over a one year period of
time as above one year IPOs performance is not analyzed. These results suggest that one must be
careful in concluding whether IPOs underperform or over perform over Long term.
REFERENCES
Banu Durukan, M. (2002). The relationship between IPO returns and factors influencing IPO
performance: case of Istanbul Stock Exchange. Managerial Finance, 28(2), 18-38.
Kumar, S. S. S. (2007). Short and long run performance of book built IPOs in India.
International Journal of Management Practices & Contemporary Thoughts, Volume 2, No.2,
July-December
Ritter, J. R. (1991). The long‐run performance of initial public offerings. The journal of
finance, 46(1), 3-27.
Poornima, S., Haji, A. J., & Deepha, B. (2016). A Study on the Performance of Initial Public
Offering of Companies Listed in NSE , INDIA & Gulf Base GCC Index. International Journal
of Research in Finance and Marketing (IJRFM), 1-17.
Ritter, J. R. (1984). The" hot issue" market of 1980. Journal of Business, 215-240.
Ritter, J. R., & Welch, I. (2002). A review of IPO activity, pricing, and allocations. The journal
of Finance, 57(4), 1795-1828.
Rajan, R., & Servaes, H. (1997). Analyst following of initial public offerings. The Journal of
Finance, 52(2), 507-529.
Sahoo, S., & Rajib, P. (2010). After market pricing performance of initial public offerings
(IPOs): Indian IPO market 2002–2006. Vikalpa, 35(4), 27-44.
Shah, A. (1995). The Indian IPO market: empirical facts. Social Science Research Network,