Western University Western University
Scholarship@Western
Scholarship@Western
Electronic Thesis and Dissertation Repository
4-7-2017 12:00 AM
Multimorbidity Among Adult Primary Health Care Patients In
Multimorbidity Among Adult Primary Health Care Patients In
Canada: Examining Multiple Chronic Diseases Using An Electronic
Canada: Examining Multiple Chronic Diseases Using An Electronic
Medical Record Database
Medical Record Database
Kathryn Nicholson
The University of Western Ontario
Supervisor
Dr. Amardeep Thind
The University of Western Ontario Joint Supervisor Dr. Amanda Terry
The University of Western Ontario
Graduate Program in Epidemiology and Biostatistics
A thesis submitted in partial fulfillment of the requirements for the degree in Doctor of Philosophy
© Kathryn Nicholson 2017
Follow this and additional works at: https://ir.lib.uwo.ca/etd
Part of the Epidemiology Commons, and the Family Medicine Commons
Recommended Citation Recommended Citation
Nicholson, Kathryn, "Multimorbidity Among Adult Primary Health Care Patients In Canada: Examining Multiple Chronic Diseases Using An Electronic Medical Record Database" (2017). Electronic Thesis and Dissertation Repository. 4483.
https://ir.lib.uwo.ca/etd/4483
Abstract
Introduction: The coexistence of multiple chronic diseases within an individual, also known as
multimorbidity, is an ongoing challenge for patients, caregivers and primary health care (PHC)
providers. An enhanced understanding of the burden of multimorbidity in Canada is needed.
Objectives: This research had two main objectives. Objective One aimed to understand the
prevalence of multimorbidity among adult PHC patients, as well as the patterns of unordered and
ordered clusters of multiple chronic diseases. Objective Two aimed to determine the natural
progression of multimorbidity over time, as well as the patient-, provider- and practice-level
predictors of progressing into more complex clinical profiles.
Methods: Data were derived from the Canadian Primary Care Sentinel Surveillance Network
(CPCSSN) electronic medical record (EMR) database. For Objective One, descriptive and
computational analyses were conducted and for Objective Two, multilevel survival analyses
were conducted to account for clustering. Patients with at least one encounter recorded in their
EMR and who were at least 18 years of age at their first encounter were included in the analyses.
Chronic disease diagnoses were identified using the International Classification of Diseases, 9th
Revision (ICD-9) and a list of 20 chronic disease categories identified patients with
multimorbidity.
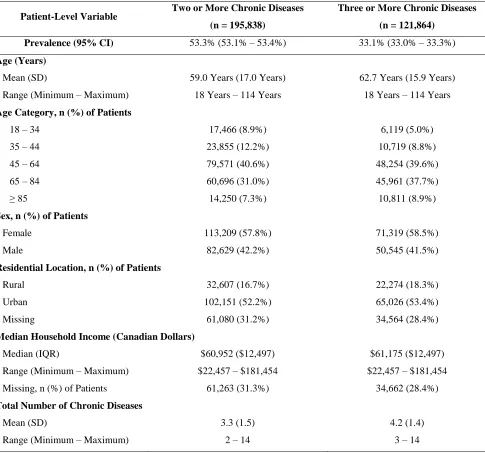
Results: Overall, 53.3% and 33.1% of adult PHC patients were living with at least two and at
least three chronic diseases, respectively. Patients with at least two chronic diseases had a mean
setting (52.2%). Among female patients with multimorbidity, 6,095 unique combinations and
14,911 unique permutations were found. Among male patients with multimorbidity, 4,316
unique combinations and 9,736 unique permutations were detected. The multilevel survival
analysis indicated that several patient-level (patient age, patient sex and total number of chronic
diseases), provider-level (provider age) and practice-level (EMR type and practice location)
variables predicted time until subsequent chronic disease diagnosis.
Conclusion: This research explored the prevalence, characteristics, patterns and natural
progression of multimorbidity over time among a large cohort of adult PHC patients. When
carefully assessed, these findings will help to create a more nuanced understanding of the burden
of multimorbidity.
Keywords
Multimorbidity, primary health care, electronic medical records, chronic disease, prevalence,
Acknowledgments
The completion of this research could not have been possible if not for five specific groups of
individuals. I am fortunate to have support and encouragement from many facets in my life.
To begin, I would like to gratefully acknowledge the members of my doctoral supervisory
committee: Dr. Amardeep Thind, Dr. Amanda Terry, Dr. Martin Fortin and Dr. Tyler
Williamson. As a graduate student, a supervisory committee will ideally push you to your
academic limits and provide the support and encouragement that is necessary for you to grow as
a young academic researcher. This is what my committee provided for me throughout my
doctoral research, creating a wonderful balance of expectation and patience. These four
respected researchers were steadfast and excellent examples of how to collaborate effectively
and respectfully within a multidisciplinary team. I would like to thank each of you for your time
and commitment to myself and my work.
Next, I would like to acknowledge other important mentors who have been present throughout
my graduate work. These mentors included: Dr. Moira Stewart, Dr. Bridget Ryan, Dr. Heather
Maddocks, Dr. Margaret Steele, Dr. Greta Bauer, Dr. GY Zou, Dr. Janet Martin, Dr. Kathy
Speechley, Dr. Mark Speechley, Dr. Kelly Anderson and Dr. Michael Bauer. However, this is
certainly not an exhaustive list. I believe this is a testament to the outstanding training
environment of the Department of Epidemiology & Biostatistics, as well as the Centre for
I have been lucky to know many young, passionate graduate students who are currently
completing their research at academic institutions across Canada and abroad. Based on the
collaborative and supportive environment in which I was trained, I have been able to begin to
build a network of relationships within academia. I feel that these graduate students represent
the future of health research in Canada, and I am excited to collaborate with these great minds
moving forward.
Not only have I been able to build strong relationships in academia, but I am also continuously
thankful for the support and love from my partner, Drew, as well as my family. As a graduate
student, it is difficult to fully articulate how much it means to have a partner and family who are
both genuinely understanding and interested in your work. This has been an incredible source of
strength and motivation for me, and it will not soon be forgotten. I know that I am very fortunate
to be able to complete this doctoral degree, but your love made the journey much more enjoyable
and rewarding.
Finally, I would like to dedicate this work to the two most important people in my life: my Mom
and Dad. Not only have you provided me with the ambition and confidence to strive towards
this achievement, but you have constantly provided the unwavering love and emotional
sustenance that anyone would be lucky to have. You are both amazing individuals and parents
Table of Contents
Abstract ... ii
Acknowledgements ... iv
Table of Contents ... vi
List of Tables ... xi
List of Figures ... xviii
List of Appendices ... xx
List of Abbreviations ... xxv
Chapter 1 Introduction... 1
Chapter 2 Literature Review ... 2
2.1 Primary Health Care ... 2
2.1.1 Definition of Primary Health Care ... 2
2.1.2 Primary Health Care in Canada ... 4
2.1.3 Chronic Disease Management in Primary Health Care ... 7
2.2. Electronic Medical Records ... 10
2.2.1 Definition of Electronic Medical Records ... 10
2.2.2 Adoption and Use of Electronic Medical Records in Canada ... 12
2.2.3 Use of Electronic Medical Records in Epidemiological Research ... 14
2.3 Multimorbidity ... 17
2.3.1 Concept of Multimorbidity ... 17
2.3.2 Operationalization of Multimorbidity ... 18
2.3.3 Measurement of Multimorbidity ... 20
2.3.5 Prevalence of Multimorbidity in Clinical Populations ... 25
2.3.6 Burden of Multimorbidity on Health Care System ... 27
2.3.7 Burden of Multimorbidity on Primary Health Care Providers ... 28
2.3.8 Burden of Multimorbidity on Patients and Caregivers ... 30
2.3.9 Natural History and Progression of Multimorbidity ... 32
2.3.10 Clusters and Patterns of Multimorbidity ... 33
2.4 Summary ... 34
Chapter 3 Research Objectives ... 37
3.1 Objective One ... 37
3.2 Objective Two ... 38
Chapter 4 Methodology ... 40
4.1 Canadian Primary Care Sentinel Surveillance Network Database ... 40
4.2 CPCSSN Data Procedures ... 47
4.2.1 CPCSSN Database Management ... 47
4.2.2 CPCSSN Data Cleaning ... 47
4.3 CPCSSN Data Elements ... 48
4.3.1 Primary Health Care Practice Characteristics ... 48
4.3.2 Primary Health Care Provider Characteristics ... 48
4.3.3 Primary Health Care Patient Characteristics ... 49
4.3.4 Primary Health Care Encounter Characteristics ... 51
4.4 Identifying Sample of CPCSSN Patients ... 52
4.5 Identifying Patients with Multimorbidity ... 53
4.7 Objective One ... 59
4.7.1 Patient Sample ... 59
4.7.2 Study Design ... 59
4.7.3 Data Analyses ... 60
4.7.3.1 Research Question 1 – Prevalence of Multimorbidity ... 60
4.7.3.2 Research Question 2 – Characteristics of Adult PHC Patients with Multimorbidity ... 63
4.7.3.3 Research Question 3 – Most Frequent Clusters of Multiple Chronic Diseases... 64
4.8 Objective Two ... 66
4.8.1 Patient Sample ... 66
4.8.2 Study Design ... 67
4.8.3 Data Analyses ... 72
4.8.3.1 Research Question 1 – Time Until Multimorbidity ... 72
4.8.3.2 Research Question 2 – Time Until Advancing Multimorbidity ... 75
4.8.3.3 Research Question 3 – Predicting Time Until Subsequent Chronic Disease ... 75
4.8.3.4 Conceptual Model for Multilevel Variables ... 78
4.8.3.5 Univariate Analyses ... 80
4.8.3.6 Bivariate Analyses ... 81
4.8.3.7 Creation and Interpretation of Final Survival Analysis Model ... 82
4.9 Summary ... 82
5.1 Objective One ... 84
5.1.1 Overall Patient Sample Characteristics ... 84
5.1.2 Objective One, Research Question 1 – Prevalence of Multimorbidity ... 89
5.1.3 Objective One, Research Question 2 – Characteristics of Adult PHC Patients with Multimorbidity ... 104
5.1.4 Objective One, Research Question 3 – Most Frequent Clusters of Multiple Chronic Diseases ... 115
5.2 Objective Two ... 172
5.2.1 Patient Sample Characteristics ... 172
5.2.2 Objective Two, Research Question 1 – Time Until Multimorbidity ... 177
5.2.3 Objective Two, Research Question 2 – Time Until Advancing Multimorbidity ... 185
5.2.4 Objective Two, Research Question 3 – Examining Patient-, Provider- and Practice-Level Predictors of Time Until Subsequent Chronic Disease ... 187
Chapter 6 Discussion ... 196
6.1 Summary of Key Findings from Objective One ... 196
6.1.1 Prevalence and Characteristics of Patients with Multimorbidity ... 196
6.1.2 Most Frequently Occurring Clusters of Multimorbidity ... 202
6.2 Summary of Key Findings from Objective Two ... 211
6.2.1 Time Until Multimorbidity ... 211
6.2.2 Time Until Advancing Multimorbidity ... 213
6.2.3 Predicting Time Until Subsequent Chronic Disease ... 215
6.3.1 Strengths of Research ... 217
6.3.2 Limitations of Research ... 218
6.4 Implications... 220
6.4.1 Clinical and Policy Implications ... 220
6.4.2 Research Implications ... 222
6.5 Future Directions ... 223
Chapter 7 Conclusion ... 224
References ... 225
Appendices ... 255
List of Tables
Chapter 2 Literature Review
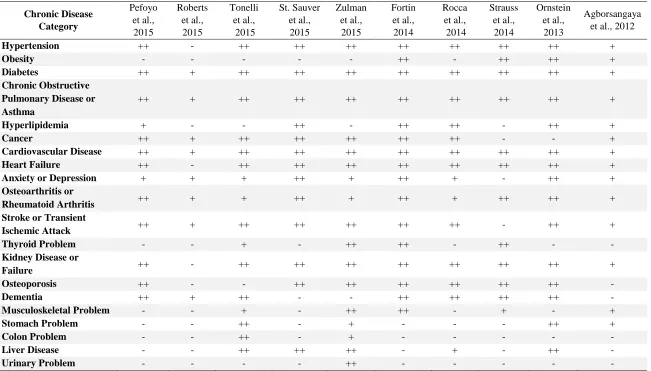
Table 2.1 Comparison of multimorbidity chronic disease lists from publications in
multimorbidity literature and the current list of twenty chronic disease categories ... 35
Chapter 4 Methodology
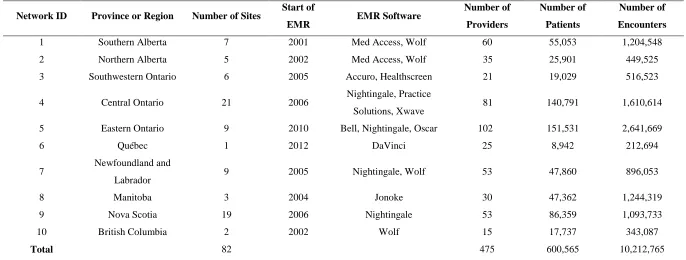
Table 4.1 Characteristics of ten practice-based research networks participating in CPCSSN
as of Q3-2013 data extract ... 46
Table 4.2 List of twenty chronic disease categories and abbreviated ICD-9 disease codes
... 56
Table 4.3 Prevalence of multimorbidity (defined as patients with two or more chronic
diseases), stratified by source of diagnostic code information ... 59
Table 4.4 Details of search terms to identify prevalence and characteristics of adults with
multimorbidity in the published literature ... 62
Table 4.5 Characteristics of all variables included in Objective Two analyses ... 81
Table 4.6 Summary of methodological elements for Objective One and Objective Two ... 83
Chapter 5 Results
Table 5.1 Patient-level variables for all eligible adult PHC patients (N = 367,743) ... 85
Table 5.2 Provider-level variables for all eligible adult PHC patients (N = 367,743) ... 86
Table 5.4 Patient-level variables, stratified by total number of chronic diseases, among
final adult patient sample (N = 367,743) ... 91
Table 5.5 Prevalence of multimorbidity, defined as two or more and three or more chronic
diseases, and corresponding patient-level characteristics for Objective One ... 93
Table 5.6 Prevalence of multimorbidity, defined as two or more and three or more chronic
diseases, and corresponding provider-level characteristics for Objective One ... 94
Table 5.7 Prevalence of multimorbidity, defined as two or more and three or more chronic
diseases, and corresponding practice-level characteristics for Objective One ... 95
Table 5.8 Key methodological elements and prevalence estimates from multimorbidity
literature (defined as two or more chronic diseases), as compared to elements and
prevalence from current research ... 97
Table 5.9 Key methodological elements and prevalence estimates from multimorbidity
literature (defined as three or more chronic diseases), as compared to elements and
prevalence from current research ... 101
Table 5.10 Key methodological elements and sample characteristics from multimorbidity
literature (defined as two or more chronic diseases), as compared to elements and
prevalence from current research ... 106
Table 5.11 Key methodological elements and sample characteristics from multimorbidity
literature (defined as three or more chronic diseases), as compared to elements and
Table 5.12 Prevalence of individual chronic disease diagnoses among all adult patients and
those with multimorbidity, defined as two or more and three or more chronic diseases .. 120
Table 5.13 Total number of combinations, stratified by patient age category and patient
sex, among patients with multimorbidity... 129
Table 5.14 Most frequently occurring combinations of multimorbidity, stratified by total
number of chronic diseases, among all eligible female patients with multimorbidity (n =
47,381) ... 134
Table 5.15 Most frequently occurring combinations of multimorbidity, stratified by total
number of chronic diseases, among eligible female patients aged 18 – 34 years with
multimorbidity (n = 5,565) ... 135
Table 5.16 Most frequently occurring combinations of multimorbidity, stratified by total
number of chronic diseases, among eligible female patients aged 35 – 44 years with
multimorbidity (n = 6,747) ... 136
Table 5.17 Most frequently occurring combinations of multimorbidity, stratified by total
number of chronic diseases, among eligible female patients aged 45 – 64 years with
multimorbidity (n = 18,426) ... 137
Table 5.18 Most frequently occurring combinations of multimorbidity, stratified by total
number of chronic diseases, among eligible female patients aged 65 – 84 years with
Table 5.19 Most frequently occurring combinations of multimorbidity, stratified by total
number of chronic diseases, among eligible female patients aged 85 years and older with
multimorbidity (n = 3,824) ... 139
Table 5.20 Most frequently occurring combinations of multimorbidity, stratified by total
number of chronic diseases, among all eligible male patients with multimorbidity (n =
30,478) ... 144
Table 5.21 Most frequently occurring combinations of multimorbidity, stratified by total
number of chronic diseases, among eligible male patients aged 18 – 34 years with
multimorbidity (n = 2,624) ... 145
Table 5.22 Most frequently occurring combinations of multimorbidity, stratified by total
number of chronic diseases, among eligible male patients aged 35 – 44 years with
multimorbidity (n = 3,583) ... 146
Table 5.23 Most frequently occurring combinations of multimorbidity, stratified by total
number of chronic diseases, among eligible male patients aged 45 – 64 years with
multimorbidity (n = 12,372) ... 147
Table 5.24 Most frequently occurring combinations of multimorbidity, stratified by total
number of chronic diseases, among eligible male patients aged 65 – 84 years with
multimorbidity (n = 9,652) ... 148
Table 5.25 Most frequently occurring combinations of multimorbidity, stratified by total
number of chronic diseases, among eligible male patients aged 85 years and older with
Table 5.26 Total number of permutations, stratified by patient age and patient sex, among
patients with multimorbidity ... 152
Table 5.27 Most frequently occurring permutations of multimorbidity, stratified by total
number of chronic diseases, among all eligible female patients with multimorbidity (n =
47,381) ... 156
Table 5.28 Most frequently occurring permutations of multimorbidity, stratified by total
number of chronic diseases, among eligible female patients aged 18 – 34 years with
multimorbidity (n = 5,565) ... 157
Table 5.29 Most frequently occurring permutations of multimorbidity, stratified by total
number of chronic diseases, among eligible female patients aged 35 – 44 years with
multimorbidity (n = 6,747) ... 158
Table 5.30 Most frequently occurring permutations of multimorbidity, stratified by total
number of chronic diseases, among eligible female patients aged 45 – 64 years with
multimorbidity (n = 18,426) ... 159
Table 5.31 Most frequently occurring permutations of multimorbidity, stratified by total
number of chronic diseases, among eligible female patients aged 65 – 84 years with
multimorbidity (n = 12,819) ... 160
Table 5.32 Most frequently occurring permutations of multimorbidity, stratified by total
number of chronic diseases, among eligible female patients aged 85 years and older with
Table 5.33 Most frequently occurring permutations of multimorbidity, stratified by total
number of chronic diseases, among all eligible male patients with multimorbidity (n =
30,478) ... 166
Table 5.34 Most frequently occurring permutations of multimorbidity, stratified by total
number of chronic diseases, among eligible male patients aged 18 – 34 years with
multimorbidity (n = 2,624) ... 167
Table 5.35 Most frequently occurring permutations of multimorbidity, stratified by total
number of chronic diseases, among eligible male patients aged 35 – 44 years with
multimorbidity (n = 3,583) ... 168
Table 5.36 Most frequently occurring permutations of multimorbidity, stratified by total
number of chronic diseases, among eligible male patients aged 45 – 64 years with
multimorbidity (n = 12,372) ... 169
Table 5.37 Most frequently occurring permutations of multimorbidity, stratified by total
number of chronic diseases, among eligible male patients aged 65 – 84 years with
multimorbidity (n = 9,652) ... 170
Table 5.38 Most frequently occurring permutations of multimorbidity, stratified by total
number of chronic diseases, among eligible male patients aged 85 years and older with
multimorbidity (n = 2,247) ... 171
Table 5.39 Patient-level characteristics of the two groups of adult patients (those with one
Table 5.40 Characteristics of providers caring for the two groups of adult patients (those
with one or more and two or more chronic diseases) for Objective Two ... 175
Table 5.41 Characteristics of practices caring for the two groups of adult patients (those
with one or more and two or more chronic diseases) for Objective Two ... 176
Table 5.42 Time (in days) until subsequent chronic disease diagnosis, stratified by patient
age category (years), patient sex and total number of chronic diseases ... 180
Table 5.43 Time (in days) until multimorbidity, stratified by patient age category (years),
patient sex and index chronic disease ... 181
Table 5.44 Results of univariate and bivariate analyses between independent variables and
dependent variable (time until subsequent chronic disease diagnosis) among adult patients
with one or more chronic diseases (n = 238,237) ... 191
Table 5.45 Results of multilevel, recurrent event survival analyses for time until
subsequent chronic disease diagnosis among adult patients with one or more chronic
List of Figures
Chapter 2 Literature Review
Figure 2.1 Conceptual diagram of the terms comorbidity and multimorbidity (adapted from
Boyd and Fortin, 2010) ... 20
Chapter 4 Methodology
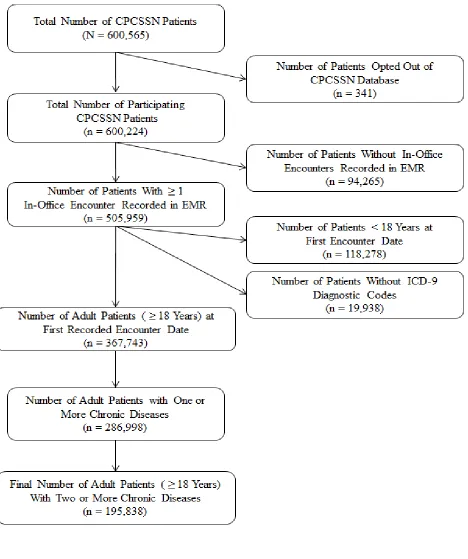
Figure 4.1 Patient inclusion flowchart to create the final sample of adult patients with at
least one in-office encounter recorded during the data extraction period ... 55
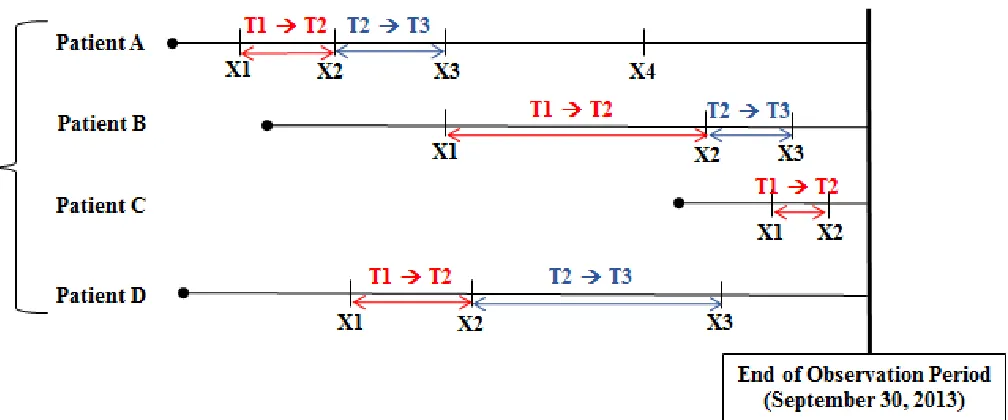
Figure 4.2 Depiction of time elapsing (in days) between chronic disease diagnoses, as well
as the corresponding start and end of observation periods, among separate subgroups of
patients with at least one chronic disease diagnosis ... 70
Figure 4.3 Distribution of time elapsing until subsequent chronic disease diagnoses among
female patients with multimorbidity ... 71
Figure 4.4 Distribution of time elapsing until subsequent chronic disease diagnoses among
male patients with multimorbidity ... 71
Figure 4.5 Time elapsing (in days) between first and second chronic disease diagnoses, as
well as second and third chronic disease diagnoses, among adult patients with at least one
chronic disease diagnoses ... 73
Figure 4.6 Time elapsing (in days) until subsequent chronic disease diagnoses, stratified by
index chronic disease type among adult patients with at least one chronic disease diagnoses
Figure 4.7 Conceptual model depicting the patient-, provider- and practice-level variables
used to predict mean time until subsequent chronic disease diagnosis ... 80
Chapter 5 Results
Figure 5.1 Crude prevalence estimates of multimorbidity (defined as two or more chronic
diseases) among all ten regional networks of the CPCSSN database ... 89
Figure 5.2 Type of chronic disease diagnoses among patients with multimorbidity,
stratified by patient sex, all ages ... 121
Figure 5.3 Type of chronic disease diagnoses among patients with multimorbidity,
stratified by patient sex, aged 18 – 34 years ... 122
Figure 5.4 Type of chronic disease diagnoses among patients with multimorbidity,
stratified by patient sex, aged 35 – 44 years ... 123
Figure 5.5 Type of chronic disease diagnoses among patients with multimorbidity,
stratified by patient sex, aged 45 – 64 years ... 124
Figure 5.6 Type of chronic disease diagnoses among patients with multimorbidity,
stratified by patient sex, aged 65 – 84 years ... 125
Figure 5.7 Type of chronic disease diagnoses among patients with multimorbidity,
stratified by patient sex, aged ≥ 85 years ... 12
Figure 5.8 Kaplan-Meier curves indicating time (in days) until subsequent chronic disease
diagnosis (event) among female patients, stratified by patient age category ... 194
Figure 5.9 Kaplan-Meier curves indicating time (in days) until subsequent chronic disease
List of Appendices
Appendix A. Multilevel structure of the CPCSSN data and relevant CPCSSN data
elements ... 255
Appendix B. CPCSSN Letter of Permission for secondary data source access ... 256
Appendix C. Ethics approval notice from research ethics board (#104705) ... 257
Appendix D. Data dictionary of original and created CPCSSN data elements ... 258
Appendix E. Example data entries of patient-level socioeconomic characteristics ... 260
Appendix F. First character of forward sortation area (FSA) and corresponding province, territory or major region... 261
Appendix G. Complete list of chronic disease categories and corresponding International Classification of Disease, 9th Revision (ICD-9) disease codes, for the identification of adult primary health care patients with multimorbidity* ... 262
Appendix H. Multimorbidity Cluster Analysis Toolkit ... 271
Appendix I. Identifying “First Occurrence” Chronic Disease Diagnoses ... 284
Appendix K: Most frequently occurring combinations of multimorbidity, stratified by total
number of chronic diseases, among female patients of all ages with multimorbidity (n =
113,209) ... 291
Appendix L: Most frequently occurring combinations of multimorbidity, stratified by total
number of chronic diseases, among female patients aged 18 – 34 years with multimorbidity
(n = 11,507) ... 292
Appendix M: Most frequently occurring combinations of multimorbidity, stratified by total
number of chronic diseases, among female patients aged 35 – 44 years with multimorbidity
(n = 14,756) ... 293
Appendix N: Most frequently occurring combinations of multimorbidity, stratified by total
number of chronic diseases, among female patients aged 45 – 64 years with multimorbidity
(n = 44,712) ... 294
Appendix O: Most frequently occurring combinations of multimorbidity, stratified by total
number of chronic diseases, among female patients aged 65 – 84 years with multimorbidity
(n = 33,264) ... 295
Appendix P: Most frequently occurring combinations of multimorbidity, stratified by total
number of chronic diseases, among female patients aged 85 years and older with
multimorbidity (n = 8,970) ... 296
Appendix Q: Most frequently occurring combinations of multimorbidity, stratified by total
number of chronic diseases, among male patients of all ages with multimorbidity (n =
Appendix R: Most frequently occurring combinations of multimorbidity, stratified by total
number of chronic diseases, among male patients aged 18 – 34 years with multimorbidity
(n = 5,959) ... 298
Appendix S: Most frequently occurring combinations of multimorbidity, stratified by total
number of chronic diseases, among male patients aged 35 – 44 years with multimorbidity
(n = 9,098) ... 299
Appendix T: Most frequently occurring combinations of multimorbidity, stratified by total
number of chronic diseases, among male patients aged 45 – 64 years with multimorbidity
(n = 34,856) ... 300
Appendix U: Most frequently occurring combinations of multimorbidity, stratified by total
number of chronic diseases, among male patients aged 65 – 84 years with multimorbidity
(n = 27,430) ... 301
Appendix V: Most frequently occurring combinations of multimorbidity, stratified by total
number of chronic diseases, among male patients aged 85 years and older with
multimorbidity (n = 5,279) ... 302
Appendix W: Most frequently occurring permutations of multimorbidity, stratified by total
number of chronic diseases, among female patients of all ages with multimorbidity (n =
113,209) ... 303
Appendix X: Most frequently occurring permutations of multimorbidity, stratified by total
number of chronic diseases, among female patients aged 18 – 34 years with multimorbidity
Appendix Y: Most frequently occurring permutations of multimorbidity, stratified by total
number of chronic diseases, among female patients aged 35 – 44 years with multimorbidity
(n = 14,756) ... 305
Appendix Z: Most frequently occurring permutations of multimorbidity, stratified by total
number of chronic diseases, among female patients aged 45 – 64 years with multimorbidity
(n = 44,712) ... 306
Appendix AA: Most frequently occurring permutations of multimorbidity, stratified by
total number of chronic diseases, among female patients aged 65 – 84 years with
multimorbidity (n = 33,264) ... 307
Appendix AB: Most frequently occurring permutations of multimorbidity, stratified by
total number of chronic diseases, among female patients aged 85 years and older with
multimorbidity (n = 8,970) ... 308
Appendix AC: Most frequently occurring permutations of multimorbidity, stratified by
total number of chronic diseases, among male patients of all ages with multimorbidity (n =
82,622) ... 309
Appendix AD: Most frequently occurring permutations of multimorbidity, stratified by
total number of chronic diseases, among male patients aged 18 – 34 years with
multimorbidity (n = 5,959) ... 310
Appendix AE: Most frequently occurring permutations of multimorbidity, stratified by
total number of chronic diseases, among male patients aged 35 – 44 years with
Appendix AF: Most frequently occurring permutations of multimorbidity, stratified by
total number of chronic diseases, among male patients aged 45 – 64 years with
multimorbidity (n = 34,856) ... 312
Appendix AG: Most frequently occurring permutations of multimorbidity, stratified by
total number of chronic diseases, among male patients aged 65 – 84 years with
multimorbidity (n = 27,430) ... 313
Appendix AH: Most frequently occurring permutations of multimorbidity, stratified by
total number of chronic diseases, among male patients aged 85 years and older with
multimorbidity (n = 5,279) ... 314
Appendix AI: Time (in days) until subsequent chronic disease diagnosis (including zero
days elapsing between diagnoses), stratified by patient age category (years), patient sex
and total number of chronic diseases ... 315
Appendix AJ: Results of multilevel, single event survival analyses among adult patients
List of Abbreviations
ACG Adjusted Clinical Groups
AHRQ Agency for Health Care Research and Quality
BMI Body Mass Index
CBPHC Community-Based Primary Health Care
CCHS Canadian Community Health Survey
CI Confidence Interval
CIHR Canadian Institutes of Health Research
CIRS Cumulative Illness Rating Scale
CPCSSN Canadian Primary Care Sentinel Surveillance Network
DELPHI Deliver Primary Health Care Information
EMR Electronic Medical Record
FSA Forward Sortation Area
HRQOL Health-Related Quality of Life
ICD-10 International Classification of Disease, 10th Revision
ICD-9 International Classification of Disease, 9th Revision
ICD-9-CM
International Classification of Disease, 9th Revision, Clinical
Modification
ICPC International Classification of Primary Care
ICPC-2 International Classification of Primary Care, 2nd Edition
ICPC-2-R International Classification of Primary Care, 2nd Edition, Revised
IQR Interquartile Range
MeSH Medical Subject Heading
MM Multimorbidity
NPS National Physician Survey
PACE in MM Patient-Centered Innovations for Persons with Multimorbidity
PHAC Public Health Agency of Canada
PHC Primary Health Care
SD Standard Deviation
Chapter 1
1 Introduction
The coexistence of multiple chronic diseases within an individual, also known as
multimorbidity, has been deemed the “norm rather than the exception” in primary health care
(PHC) by both researchers and health care providers for many years. Beyond being recognized
as the “norm”, multimorbidity in fact represents one of the most complex issues in modern
medicine; an increasingly common issue that requires a more effective clinical approach to
respond to this complexity. To contribute towards the knowledge base in the area of
multimorbidity, as well as to address notable gaps in the existing multimorbidity literature, this
thesis aimed to achieve three main areas of understanding: 1) to identify the prevalence and
common characteristics of multimorbidity among adult PHC patients within a pan-Canadian
database; 2) to determine the patterns (both unordered clusters and ordered clusters) of multiple
chronic disease occurrence among adult PHC patients with multimorbidity; and 3) to understand
the natural progression of adult PHC patients as they moved to more complex clinical profiles
over time, as well as the patient-, provider- and practice-level variables that may predict the time
until an additional chronic disease diagnosis. The use of a national, longitudinal, de-identified
electronic medical record (EMR) database from the Canadian Primary Care Sentinel
Surveillance Network (CPCSSN) has allowed for this research to be possible. This exploration
of a complex issue in health care, using a complex set of electronic medical record data, has
provided insight that can contribute to the efforts of the international community that is working
Chapter 2
2 Literature Review
This chapter will introduce the three interrelated pillars of this doctoral research: primary
health care, electronic medical records and multimorbidity. While each pillar is presented
separately, the interrelatedness of these concepts creates the basis for this thesis.
2.1 Primary Health Care
2.1.1 Definition of Primary Health Care
According to Health Canada, the term “primary health care” refers to an approach to
health and a spectrum of services that go beyond the traditional health care system (Health
Canada, 2012). Primary health care serves a dual function in the broader health care system: 1)
to direct provision of first-contact services by health care providers such as family physicians
and nurse practitioners; and 2) to integrate and coordinate patients in need of more specialized
services such as those provided by specialists or through in-patient hospital care (Health Canada,
2012; Hutchison et al., 2011; Starfield et al., 2005). The range and configuration of PHC
services that are available varies from community to community, but often focusses on the
prevention and treatment of common diseases and injuries, basic emergency services, referrals
and coordination with other levels of care, mental health care, health promotion, maternity and
early-life care, as well as palliative and end-of-life care (Health Canada, 2012). The concept of
“primary care” is the element within PHC that focusses on the delivery of these health care
services to achieve health promotion, illness and injury prevention (both acute and chronic
International Conference in 1978 and reports from the Institute of Medicine (IOM) defined
primary care as “the provision of integrated, accessible health care services by clinicians who are
accountable for addressing a large majority of personal health care needs, developing a sustained
partnership with patients and practicing in the context of family and community” (WHO, 1978;
IOM, 1978). As well, this definition of primary care has been used to measure four main
features of primary care services: 1) first-contact access for each new need; 2) long-term
person-focussed care (not disease-person-focussed care); 3) comprehensive care for most health needs; and 4)
coordinated care when it must be sought elsewhere (Starfield et al., 2005; McWhinney and
Freeman, 2009). The term “primary health care” is used herein and refers to the definition of all
aspects of both “primary health care” and “primary care”, as defined above. Indeed, a strong
primary health care system is required to address the marked disparities or inequities in health
across populations and evidence of the substantial influence of a strong patient-centered PHC
system has been accumulating (Stewart et al., 2014; Kelley et al., 2014; Starfield et al., 2005).
In Canada, family physicians and nurse practitioners who see patients in a PHC setting
(e.g., in-office clinic, walk-in clinic or emergency department) provide the first point of contact
between a patient who is in need of health services and the health care system. This first-point
access is distinct from secondary health care services (e.g., medical specialist or in-patient
hospitalization) in which a referral or admission order is typically first required before receiving
these specialized services. The ways in which PHC services are organized and delivered have
been the focus of much debate. In fact, numerous studies have emphasized the importance of
PHC reform, including the Romanow Report published in 2002 (Hutchison et al., 2011;
Romanow, 2002). Explained further in the next section, the key feature of PHC reform was the
robust teams of health care providers who work together to deliver multidisciplinary and
comprehensive services to their patients or clients (Hutchison et al., 2011; Health Council of
Canada, 2007; Starfield et al., 2005). This shift occurred based on the increasing evidence that a
team of professionals working as partners could achieve positive health outcomes, as well as
improved access to services, more efficient use of resources and higher satisfaction of both
patients and providers (Health Canada, 2012; Hutchison et al., 2011; Health Council of Canada,
2007). In fact, a team-based approach to PHC has become the focus in Canada and helps to
ensure that each health service is provided by the most appropriate professional, at the most
appropriate time and in the most appropriate location.
2.1.2Primary Health Care in Canada
Canada has thirteen provincial and territorial health care systems that operate separately,
but are united under the legislative framework of the 1984 Canada Health Act. In 2010, 71% of
Canada’s health spending was publicly funded, but the delivery of care was largely private
(Hutchison et al., 2013). This means that most providers are independent contractors who are
then reimbursed by the provincial or territorial governments. In the early 2000s, despite the
country’s universal health care coverage, the Canadian PHC system experienced a period of
lagging behind other high-income countries on many PHC access and quality indicators
(Blendon et al., 2001; Hutchison et al., 2011). In an international survey examining PHC quality
among five high-income countries (Australia, Canada, New Zealand, United Kingdom and
United States), 61% of Canadian family physicians (the highest among all five participating
countries) were “very concerned” that their quality of care would decline in the future (Blendon
PHC reform in Canada. Although the goals and objectives of the provinces and territories for
PHC and its reform differ, common themes included focus on improved access to PHC services;
better coordination and integration of care; expansion of team-based approaches and
partnerships; improved quality of care, with an emphasis on patient engagement and
self-management; and the implementation and utilization of electronic records and other health
information management systems (Hutchison et al., 2011). Since this transition, several PHC
reform initiatives have been implemented broadly in one or more jurisdictions to advance the
quality of care received by PHC patients. For example, Family Health Teams and Community
Health Centres serve as the main interprofessional models in Ontario, while Family Medicine
Groups (Groupes de medicine de famille) are the main delivery models in Québec (Hutchison et
al., 2011).
A common criticism of PHC is the degree of “generalism” that this field of medicine
provides to their patients (McWhinney and Freeman, 2009; Stange and Ferrer, 2009). This
criticism is often referred to as the “paradox of primary health care”. This includes two
interrelated observations: 1) that PHC providers deliver poor quality of care for specific diseases,
as compared to specialists; and 2) that PHC is associated with higher value health care for the
whole person, resulting in better overall health, greater equity, lower health care costs and better
quality of care for the broader population (Stange and Ferrer, 2009). Quality of care is
commonly measured by the application of disease-specific, evidence-based process-of-care
guidelines, where PHC tends to require a more generalist approach to delivering services. To
date, family physicians and (increasingly) nurse practitioners are the principal sources of primary
medical care in Canada. As such, the term “primary health care provider” will be used herein
providers, these professionals deliver ongoing, accessible care to their patient population and
build relationships with their patients to enhance the effectiveness of preventive and therapeutic
interventions over time (Martin et al., 2014; McWhinney and Freeman, 2009; van Weel, 2005).
Indeed, primary health care has been promoted as the building block of a high-value health care
system and should be supported to achieve its goals of providing quality care to its patients
(Stange and Ferrer, 2009; Chan, 2008; Rowan et al., 2007; Starfield et al., 2005).
A recent study conducted by Stewart and Ryan (2015) provided a Canadian synthesis of
health care use at the population level. This study examined health care needs and health care
use among provincial jurisdictions using the 2007 Canadian Community Health Survey (CCHS).
This database provided a large sample size of over 100,000 respondents from the ten Canadian
provinces (territories were excluded due to small sample sizes). The “ecology of health care”
was assessed by province, after age-sex standardization per 1,000 individuals for those who were
15 years of age and older (Stewart and Ryan, 2015). This study measured visits with family
physicians, visits with specialist physicians, visits with nurses and hospitalizations, as well as the
presence of chronic diseases. In Canada, a total of 243 contacts were reported to a family
physician per month per 1,000 people (Stewart and Ryan, 2015). This represented the most
frequent number of contacts per month, as there were only 70 contacts per month to a specialist
physician and 8 contacts per month that involved a hospitalization (both per 1,000 people).
Notable variation was observed from province-to-province. In fact, monthly contacts with
family physicians per 1,000 people ranged from as low as 158 contacts in Québec to as high as
295 contacts in British Columbia (Stewart and Ryan, 2015). Interestingly, the monthly rate of
having at least one chronic condition ranged from 524 per 1,000 people in Québec to 638 per
geographic location (Stewart and Ryan, 2015). This study indicates the demand placed on the
primary health care system at the population-level in Canada. When these PHC services are
integrated, interdisciplinary and focused on the evolving health care needs of their patients, this
system is well positioned to provide the important facets of chronic disease prevention and
management to the populations they serve over time. Furthermore, these PHC providers can
deliver ongoing care to their patients, developing relationships that are beneficial to achieving
better health outcomes.
2.1.3 Chronic Disease Management in Primary Health Care
According to the 2014 WHO Global Status Report on Noncommunicable Diseases,
noncommunicable or chronic diseases are of a long duration and generally demonstrate slow
progression (WHO, 2014). These are health issues that require ongoing management over a
period of years or decades (WHO, 2014). The definition of “chronicity” proposed by O’Halloran
et al. (2004) is a disease lasting at least six months, having a documented pattern of recurrence or
deterioration, as well as an impact on an individual’s quality of life. Individuals living with
chronic diseases (and particularly those with multiple chronic diseases) often manage complex
treatment regimens that can include multiple appointments, multiple medications, regular
monitoring and adherence to different treatment and management protocols (Moffat and Mercer,
2015; Onder et al., 2015; Mercer et al., 2014; Smith et al., 2012; Sinnott et al., 2013; Fortin et al.,
2007; Boyd et al., 2005). For patients who are living with chronic diseases, access to regular and
effective PHC services can be highly desirable and associated with better health outcomes
In Ontario, almost two-thirds of respondents to the 2014 Commonwealth Fund
International Health Policy Survey of Older Adults who were living with chronic diseases
reported that they had easy access to a professional who could help with medical questions
between visits (Health Quality Ontario, 2015). Similarly, the 2011 Commonwealth Fund Survey
of Sicker Adults found that 96% of respondents with a chronic disease had access to a regular
medical doctor (Health Council of Canada, 2011). The vast majority (95.1%) of adults aged 40
years and older in the four western Canadian provinces (British Columbia, Alberta,
Saskatchewan and Manitoba) indicated they had access to a regular medical doctor (Weaver et
al., 2014). Generally, these results indicate that many Canadians with a disease that is of long
duration and generally slow progression are able to access their PHC provider. However, there
is a need to provide a complement of health care professionals in order to achieve the most
successful health outcomes for these patients (Rudland and Macey, 2013; Smith et al., 2007;
Hemmelgarn et al., 2007; Noël et al., 2007). This includes the involvement of health
professionals like dietitians, pharmacists, social workers, physiotherapists and occupational
therapists, many of which are now actively recruited into team-based settings. Even further,
these teams may involve specialist physicians, such as a psychiatrist or a geriatrician. This
increasingly diverse set of professionals will help to address the multidimensional needs of many
individuals who are living with chronic disease.
As stated by Barbara Starfield (2011), “Neither morbidity nor multimorbidity is randomly
distributed in populations. People and populations differ in their overall vulnerability to illness
and resistance to threats to their health; some have more than their share of illness and some have
less”. To date, a clear and comprehensive understanding of why “people and populations differ
certain individuals. Indeed, this life course approach to understanding the occurrence of
individual chronic diseases, as well as multiple chronic diseases, is a large area of complex and
longitudinal research. More specifically, it is unclear how patients accumulate one disease after
another, as compared to other patients who remain unhindered by disease throughout their
lifetime (van den Akker et al., 2006). Extensive research has been conducted examining the
aetiology of individual chronic diseases (Ben-Shlomo et al., 2016; Non et al., 2014; Kamphuis et
al., 2013; Braveman and Barclay et al., 2009; Lynch and Smith, 2005; Barker 2004; Kuh et al.,
2004), however, a small subset of studies has examined the aetiology of multiple pathologies or
general disease susceptibility for multimorbidity, using a life course approach (Wister et al.,
2016; Vos et al., 2015; Pavela and Latham, 2015; Tomasdottir et al., 2015; Tucker-Seeley et al.,
2011). An article published more than twenty years ago by van den Akker et al. (1996)
identified the need for causal explanations or description of general susceptibility for disease in
observed patterns of chronic disease accumulation. Not only did this publication identify the
need for a differentiation between comorbidity and multimorbidity, but it signified the need to
understand the occurrence of multiple diseases in more detail.
Some patients may be more vulnerable to the co-occurrence of chronic diseases due to
genetic and immunological factors, the environment in which they live and work, lifestyle
behaviours and their level of adaptive or coping capacities (van den Akker et al., 1996).
Individual patient characteristics, such as stressful life events, vulnerability to stress,
(mal)adaptive approaches to illness and personal locus of control could be influential factors in
disease accumulation (van den Akker et al., 1996). Moreover, some chronic diseases may have a
common aetiology, common predisposing characteristics or a shared pathogenesis. For example,
systems can lead to increased general vulnerability for disease (van den Akker et al., 1996). As
well, some health care providers may be more aggressive in diagnosing, treating and managing
symptoms presented by their patients, due to personal or contextual influences on clinical care
behaviours (Vos et al., 2015). Finally, and particularly with the use of electronic records for
research, the potential influence of “detection bias” may result in increased chronic disease
burden. This detection bias refers to the fact that patients who have already been diagnosed with
one disease will contact the health care system more often than those who are relatively healthy.
As such, these patients will likely be examined more frequently and more extensively than their
healthy counterparts (van den Akker et al., 1996). Consequently, these patients are more likely
to be diagnosed with additional diseases, and may be more alert in recognizing or presenting
with symptoms for examination (van den Akker et al., 1996). The time elapsing between
diagnoses indicates an important period to either detect further pathophysiology or to avoid the
potential for overdiagnosis. While clinical judgement is intrinsic to family medicine, this
represents a point of intervention to avoid further disease progression. Therefore, the
management of chronic diseases over time and the assessment of variables that may influence the
accumulation of chronic diseases over time is an important, yet fairly unexamined, area of
research for those patients living with multiple chronic diseases.
2.2 Electronic Medical Records
2.2.1 Definition of Electronic Medical Records
Computer-based technology and the associated digital infrastructure, such as an
electronic medical record (EMR), can be particularly useful in facilitating the delivery and
information, which is securely stored and readily accessible to authorized users. These
electronic records represent an important shift from traditional paper-based records and their
primary purpose is to support continuous, comprehensive, efficient and high quality health care
(Manca, 2015; Canada Health Infoway, 2013; Health Council of Canada, 2011; Schoen et al.,
2009; Hayrinen et al., 2008). Several elements can be documented within an electronic record
including patient demographics, lifestyle behaviours, presenting complaints or symptoms, past
medical history, family history, physical examination findings, clinical diagnoses, laboratory
tests and corresponding results, diagnostic imaging, medication administration, allergies,
immunizations, referrals, hospital admission and discharge notes (Canada Health Infoway, 2013;
Tu et al., 2015).
Health care systems are also increasingly offering patients the ability to access and
manage their health information through their own personal health record or through companion
applications such as health-related mobile applications or patient portals (Manca, 2015; Zulman
et al., 2015b; Goldzweig et al., 2013). Patient portals, in particular, are designed to give patients
secure access to health information (such as appointment and laboratory test results) and allow
secure methods for communication and information sharing between patients and their PHC
provider (Goldzweig et al., 2013). In comparison, an EMR is only accessible to an authorized
health professional or health organization (Canada Health Infoway, 2013). For example, within
a single PHC organization, those with access to the EMR system can be family physicians, nurse
practitioners, nurses, medical trainees (e.g., residents and medical students), administrative staff
and (in some cases) allied health professionals.
These EMR software programs can hold thousands of individual patient records, but
structured or “drop-down” data recording vs. highly unstructured or “free-text” data recording).
These EMR systems can also be integrated with other software that manages activities such as
billing and appointment scheduling. Canada Health Infoway is working towards the goal of one
electronic medical record system for all Canadians. However, since health care is organized at
the provincial and territorial level, each jurisdiction has its own EMR adoption program and
policies (Tu et al., 2015). This has had three important consequences: 1) there are multiple
vendors or companies that develop and sell EMR software programs to health care organizations,
such as PHC practices and hospitals; 2) there are no consistent or enforced guidelines for
recording clinical information within these electronic records; and 3) there is not a single
repository in Canada that automatically collects all of this clinical information. The United
Kingdom and its Clinical Practice Research Datalink is an excellent example of a country that
has recorded health-related data for every person registered with the National Health Service,
from birth to death, within a singular clinical database (Clinical Practice Research Datalink,
2016). The Canadian Primary Care Sentinel Surveillance Network (CPCSSN), which will be
described further in the next chapter, was established to address this notable gap in the Canadian
EMR landscape (Birtwhistle and Williamson, 2015; CPCSSN, 2016; Birtwhistle, 2011).
2.2.2 Adoption and Use of Electronic Medical Records in Canada
A systematic review conducted by Chang and Gupta (2015) indicated that the rates of
adoption of EMRs in Canada have increased from about 20% of physicians in 2006 to an
estimated 62% of physicians in 2013. This study found substantial regional variation in adoption
rates ranging from 40% of physicians in New Brunswick and Québec to more than 75% of
becomes increasingly common in PHC settings throughout Canada, it is important that these
EMR systems are used as effectively and efficiently as possible to maximize benefits and
improve quality of care (Terry et al., 2014; Canada Health Infoway, 2013). A recent study by
Paré et al. (2015) assessed the EMR use patterns of 331 family physicians in Québec and
determined that EMR systems “as-used” vary substantially from one family physician to another
in terms of the system capabilities that are actually mobilized in day-to-day clinical care. The
group of family physicians that were most impacted by their EMR system were those who had
the longest usage experience and consciously made the most use of their system’s capabilities
(Paré et al., 2015). However, many EMR adopters use only a fraction of their software’s
available functions and perceive the enhanced use of EMR systems as a substantial and
underused opportunity (Paré et al., 2015; Chang and Gupta, 2015). User-cited benefits of the
adoption of an EMR system into clinical care include time savings, improved record keeping,
heightened patient safety and confidence in the retrieved data when EMRs are used efficiently
(Chang and Gupta, 2015). In comparison, user-cited barriers to EMR adoption included
financial and time constraints (particularly for initial adoption of an EMR system), lack of
knowledgeable support personnel, lack of interoperability with hospital and pharmacy systems
and lack of integration with other allied health professionals (Chang and Gupta, 2015).
A recent study conducted by Zulman et al. (2015b) demonstrated that from the
perspective of patients living with multiple chronic diseases, the presence of an EMR can
markedly alleviate challenges and create opportunities for enhanced support. In a similar sense,
EMR use can support improved interactions and communications among members of the health
care team, as well as between providers and patients (Canada Health Infoway, 2013). The
(e.g., trending of test results over time), availability of information in real-time to facilitate
decision-making and options for patients and providers to communicate via secured messaging
(Manca, 2015; Canada Health Infoway, 2013). In contrast, the use of EMRs may introduce
challenges in building rapport between patients and providers, such as the distraction of entering
information electronically during the encounter or the unsuitable placement of the computer in
the examination room (Canada Health Infoway, 2013). To date, a balance between the benefits
and challenges of EMR use has not been consistently achieved.
2.2.3 Use of Electronic Medical Records in Epidemiological Research
Structured electronic records provide the potential to access point-of-care data to inform
clinical practice and to conduct academic research. With meaningful use, including standard and
consistent data entry in specific fields, EMR data can provide valuable practice-level information
(Manca, 2015). Epidemiological studies and public health assessments that measure population
morbidity often rely on the development and administration of surveys, which can capture
self-reported morbidity among a sample of the target population of interest. An alternative approach
is to utilize information and diagnoses recorded during routine consultations in a clinical setting,
particularly in a PHC setting. An advantage of PHC consultation data is that encounter-level
information is collected longitudinally or at multiple time points. This information is recorded at
individual encounters between the patient and their PHC provider when the patient presents for a
clinical visit. This is distinct from typical population-level surveys, which are specifically
designed for a one-time or cyclic administration.
However, it is important to recognize that these PHC consultations and their
population, as many of the symptoms or morbidities (e.g., conditions or diseases) a patient may
be living with are not brought to the attention of the PHC provider. As well, a patient may be
living with a morbidity that remains undetected by the PHC provider. In a study completed by
Barber et al. (2010), the estimated population burden of multiple chronic diseases was actually
very similar between a population-level survey and an electronic medical record and was more
consistent for diseases with clear diagnostic features, such as diabetes mellitus. Electronic
medical records provide data that can reflect the entire care experience and can be analyzed for
entire populations receiving care (e.g., entire PHC practices and potentially in an ongoing and
real-time basis). This source of data can also improve the depth and breadth of information
available for research based on the longitudinal and patient-level data that are recorded.
Other sources of data, such as administrative data recorded for billing purposes, can be
used to capture real-world clinical information from a large population of patients (e.g., even
whole provinces such as Ontario or Alberta). These data, which can be held and analyzed by the
Canadian Institutes for Health Information, can be very valuable for clinical and policy purposes.
However, these data do not cover the breadth of clinical information from the PHC perspective
and are limited to patients who appear in the administrative database after receiving adjudicated
claims (e.g., prescriptions or hospital visits). In comparison, primary data collection, such as
surveys, allow researchers the ability to structure data collection to capture specific variables of
interest. This is particularly valuable for information that is not typically collected or contained
within a medical chart or an administrative database, such as patient socioeconomic
characteristics, experiences of disease or satisfaction with clinical care. The challenges of
primary data collection (e.g., surveys) include the time and resources that are required to recruit a
Electronic medical records offer great potential for research, enabling the rapid
identification of patients in the context of primary health care. EMRs use a combination of
structured data and unstructured (or free text) data (CIHI, 2013; Orueta et al., 2012; Terry et al.,
2010). The balance between these two components varies across different record systems with
some EMRs consisting primarily of coded data and others are a combination of coded and free
text fields. The accuracy of a diagnostic code within an electronic record depends on two steps:
whether the code accurately reflects the provider’s clinical opinion and whether that diagnosis
was correct (Coleman et al., 2015; Nicholson et al., 2011). A valid diagnostic code indicates that
a provider believes that: 1) a patient has a specific symptom, condition or disease; 2) this clinical
diagnosis is correct; and 3) this diagnosis code is accurately recorded within the patient’s EMR.
Occasionally, a code may be entered in error and not corrected (Greiver, 2015; Nicholson et al.,
2011). Alternatively, a provider may make a diagnosis, but not record it (Tu et al., 2015;
Weiskopf et al., 2013; Thiru et al., 2003). The practice of recording diagnostic codes is yet to be
fully understood and requires further research (Coleman et al., 2015; Orueta et al., 2012). At
present, the extent of accurately identified and non-missing cases in an electronic record database
can be estimated by comparison of prevalence rates obtained from within the database with those
from external sources, such as administrative datasets or population-based estimates.
Increasingly, the data contained within EMRs are being used for research purposes.
Although not collected for research purposes, these records contain rich, longitudinal and
individual-level data for each patient visiting their PHC provider. When the quality of these data
can be ensured, researchers using a PHC EMR database often have access to more robust clinical
data, when compared with self-reported surveys or administrative data. For example,
an electronic record. Work is needed to enhance the coding practices of PHC providers, as well
as the technologies that are used by the PHC community, so that all data recorded in these EMRs
can be put to better use in clinical and epidemiological research, health services planning and
health care policy decisions (Terry et al., 2014; Hayrinen et al., 2008; Lobach and Detmer, 2007;
Thiru et al., 2003).
2.3Multimorbidity
2.3.1 Concept of Multimorbidity
The issue of multimorbidity (that is, multiple chronic diseases occurring within the same
individual) is among the 21st century’s major emerging health issues and poses a myriad of
challenges for public health, primary health care and community care (Afshar et al., 2015;
Mercer et al., 2014; Parekh and Goodman, 2013). Moving beyond the health challenges and
economic burden of individual chronic diseases, the emerging prevalence of multimorbidity will
potentially lead to a substantial increase in demands on our society in the near future (Stewart et
al., 2013). The construct of “comorbidity” dates back to 1970, when Alvin Feinstein used the
term in addressing the functional effects of comorbid conditions on the patient, as well as the
combined effects of these comorbid conditions on the patient’s clinical profile (Feinstein, 1970).
Feinstein first defined the term “comorbidity” as “any distinct additional clinical entity that has
existed or that may occur during the clinical course of a patient who has the index disease under
study” (Feinstein, 1970). This definition implies that the index disease under study is of
principal importance and is the main focus for the health care provider. Although used
interchangeably in the past by many authors, there are important distinctions between the terms
“coexistence of two or more chronic diseases in the same individual”, in which no one disease is
designated the index disease or primary focus for the health care provider (van den Akker et al.,
1996; Boyd and Fortin, 2011). This conceptual difference between the terms comorbidity and
multimorbidity (Boyd and Fortin, 2011) has been adapted in this thesis and can be seen in
Figure 2.1. In this adapted figure, the patient becomes ancillary to the co-occurring chronic
diseases in the concept of comorbidity, as compared to the concept of multimorbidity, which
facilitates a more holistic and patient-centered approach.
2.3.2 Operationalization of Multimorbidity
To date, there is no internationally accepted list of chronic diseases that define or capture
patients with multimorbidity (Almirall and Fortin, 2013; Stewart et al., 2013; Diederichs et al.,
2011). Researchers must therefore create a list that is suitable for their research purposes and
corresponding data source. For this research, a list of twenty chronic disease categories and
corresponding diagnostic codes were used. Based on previous international literature that
examined the burden of multimorbidity among PHC patients using comprehensive national
electronic health records, this list of twenty chronic diseases was created (Mercer et al., 2014;
Barnett et al., 2012; Diederichs et al., 2011; George et al., 2006; Bayliss et al., 2005; Byles et al.,
2005; Crabtree et al., 2000; Greenfield et al., 1993; Charlson et al., 1987). This final list was
compared with more recently published definitions of multimorbidity (those studies that have
published the list of individual chronic diseases), to assess consistency in diseases and disease
categories that were captured. The comparison among lists is presented in Table 2.1.
Perhaps one of the reasons for the varying definitions and conceptualizations of
means to examine the multidimensional concept of “multimorbidity”. For example, part of the
problem in choosing an appropriate measure of multimorbidity is due to the abstract nature of the
concept of multimorbidity and how it relates to other concepts, such as disease burden and
patient complexity (Huntley et al., 2012; Valderas et al., 2009). The methodology used to
measure multimorbidity is based on the underlying elements of multimorbidity that are important
for research work (e.g., count numbers of chronic diseases, burden on distinct body systems,
treatment burden, health system burden).
The definition of multimorbidity indicates the presence of multiple health issues within
an individual. The use of the terms disease, illness or condition are often used interchangeably
to describe these “health issues” of patients. The term disease refers to a defined pathological
process with a characteristic set of signs and symptoms, while the term illness is frequently used
as a synonym for disease, but in many cases it refers to the patients’ personal experience of their
disease (McWhinney and Freeman, 2009). In comparison, the term condition is a broader term
that includes the concept of disease, as well as other health issues that fall outside of the
traditional disease model (McWhinney and Freeman, 2009). For example, health issues like
obesity or hypertension may be seen as pre-existing conditions and a preceding risk factor to
subsequent diseases. Alternatively, they may be seen as their own chronic disease entity. In a
recent study examining the various terms that have been used in research to describe multiple
coexistent diseases, it was noted that the terms disease and condition were overwhelmingly used
in the definition of multimorbidity and seem to be more appropriate for describing the
coexistence of multiple health issues in a patient, particularly when no one disease has been
identified as the index disease (Almirall and Fortin, 2013). Therefore, the term disease was used