Available online: https://edupediapublications.org/journals/index.php/IJR/ P a g e | 3464
Impact of Micro Finance on Empowerment of Women: A case study of
Himachal Pradesh
Ms Kavita Kumra
Assistant Professor
Rajiv Gandhi Govt. Degree College
Chaura Maidan, Shimla-4
Email:
kumra.kavita@gmail.com
Dr. Vijay Kumar Sharma
Professor, Department of Commerce
Himachal Pradesh University, Shimla-5
Email: vk_hpu@yahoo.co.in
Abstract
The terms ‘empowerment’ and ‘microfinance’ (or microcredit) have become common household words in recent years. Empowerment is defined as the process by which women take control and ownership of their lives through expansion of their choices. Thus, it is the process of acquiring the ability to make strategic life choices in a context where this ability has previously been denied. Micro finance is defined as provision of thrift, credit and other financial services and products of very small amounts to the poor in rural, semi-urban and semi-urban areas so as to enable them to raise their income levels and improve their living standard. One form of micro credit, popular in India, is given through the self help groups promoted by national and state governments and NGOs. SHGs are formed as micro-credit networks for promoting the socio-economic betterment of women as well as their capacity building. SHGs bring out the supremacy of women in moulding the community in the right perspective and explore the initiative of women taking up entrepreneurial ventures. The participation of poor women in SHGs has not only enabled women to meet their credit needs, but also resulted in general awareness, capacity building, self-confidence and courage which can be translated into empowerment. In this paper an attempt has been made to explore the relationship between microfinance and women empowerment.
Keywords: women empowerment, microfinance, SHGs, impact
1. Introduction
The financial institutions that focus on providing small loans have a high proportion of loans that are provided to women, often accounting for more than 80 percent of total loans advanced. Most of the institutions are targeting women as an instrument to both empower them and to alleviate poverty. It is argued that channelling credit to women is likely to improve nutrition, health and educational attainment. Moreover, micro finance programmes also focus on lending to women because their repayment rates have proved to be higher[1].
Available online: https://edupediapublications.org/journals/index.php/IJR/ P a g e | 3465 beneficiaries, Factor Analysis has been applied to
extract the factors from nine variables depicting the impact of microfinance on women empowerment.
2. Sampling Procedure
Multistage sampling has been used for collecting primary data from the respondents of the research work. At the first stage, two districts namely Shimla and Kinnaur (non-tribal and tribal) have been selected out of twelve districts keeping in view their representation to various demographic features by using Purposive Sampling. At the second stage, two administrative blocks from each district have been selected considering maximum number of SHGs in these blocks. Thus, Mashobra and Theog from district Shimla and Nichhar and Kalpa from district Kinnaur have been included in the sample. In the third stage, the number of respondents was chosen on the basis of the sample design given as under:
Table 1 Sample Design District No of
SHGs
Block No. of Respond ents
Total
Shimla (Non-tribal)
3410 Mashobra 250 500
Theog 250
Kinnaur (Tribal
329 Nichhar 25 50
Kalpa 25
Total 550
Since the number of SHGs in district Shimla is almost 10 times (3410/329 = 10.3) the number of SHGs in Kinnaur district, therefore, 50 respondents from Kinnaur district (25 from each block) and 50*10 = 500 respondents from Shimla district (250 from each block) have been included in the sample on the basis of quota and random sampling.
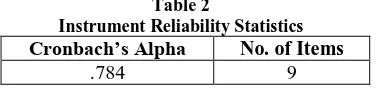
3. Instrument Reliability
As a part of data analysis it is necessary to check the internal reliability of results in order to verify the credibility of findings from the study and for this Cronbach’s Alpha has been used. In other words, Cronbach’s Alpha helps to check whether or not respondents’ scores on one barometer tend to be related to their scores on the other barometer. Cronbach’s Alpha also computes internal consistency and reliability among a group of variables combined to form a single scale.
Table 2
Instrument Reliability Statistics
Cronbach’s Alpha No. of Items
.784 9
For checking the reliability of all the variables, Cronbach’s Alpha is used in summarized form in Table 2. The value of Cronbach’s Alpha ranges from 0 to 1. Zero denoting no internal reliability and 1 denoting a perfect internal reliability. The results indicate that in total the questionnaire is a reliable instrument as the overall Cronbach’s Alpha value is 0.784 which is more than the acceptable lower limit of 0.70.
4. Kaiser-Meyer-Olkin Measure of
Sampling Adequacy and Bartlett’s Test
of Sphericity
KMO measure of sampling adequacy is a statistical measure which indicates the proportion of variance in our variables which may be a common variance, i.e. the proportion of variance which might be caused by underlying factors. High value of KMO measure indicates (close to 1) generally indicates that a factor analysis may be useful with the given data. If the value is less than 0.50 the result won’t be useful for further analysis. Bartlett’s Test of Sphericity signifies whether a co-relation matrix is an identity matrix or not, as the identity matrix indicates that the variables are not related to each another. The significance level gives the result of the test. Small values (less than 0.5) indicates that the null hypothesis of co-relation matrix is an identity matrix and has to be rejected, as it is good for further factor analysis.
Table 3 KMO and Bartlett’s Test
Kaiser-Meyer-Olkin Measure of Sampling Adequacy
0.828
Bartlett’s Test of Sphericity
Approx. Chi-Square
1309.336
df 36
Sig. 0.000
Source : Primary Probe
Available online: https://edupediapublications.org/journals/index.php/IJR/ P a g e | 3466 Bartlett’s Test of Sphericity is 0.000 suggesting
that the variables are appropriate for further analysis.
5. Communalities
Table 4 Communalities
Sr. No.
Variables Initial Extraction
1 Increased Share in Family Employment/ Economic activities have been pursued
1.000
0.635
2 Share in total household Savings has increased
1.000
0.614
3 There is now Recognition in family/Involvement in decision making
1.000
0.783
4 There is ownership in assets jointly with males
1.000
0.529
5 There are lesser incidents of domestic violence
1.000
0.560
6 There is Social Recognition
1.000
0.783
7 There is improvement in social status
1.000
0.759
8 Confidence Level has increased
1.000
0.686
9 It has lead to 1.000 0.525
development of skills and abilities/talents
Source : Extraction Method using Principal Component Analysis
The sum of the squared factor loadings for all factors for a given variable, is the variance in that variable accounted for all the factors. This is known as Communalities. It measures the presence of variance in a given variable explained by all the factors jointly. In this study we use Principal Component Analysis, so the initial value of the Communality will always be 1 and the extraction value is the proportion of explained variance of each variable by the principal component.
Table 4 presents the communalities of different variables. Initial value of all the variables is 1 and the extracted value of these variables is greater than 0.50. A high extraction value (above 0.50) of these variables authenticates the suitability of the data analysis.
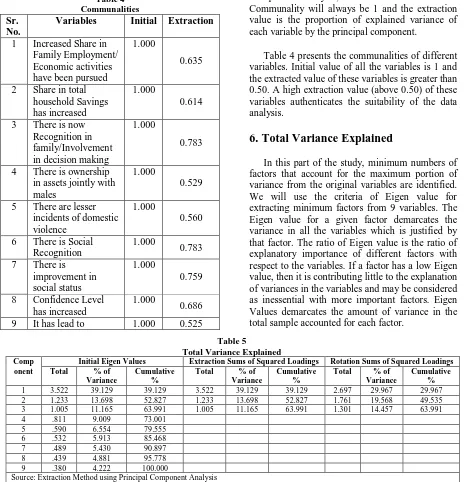
6. Total Variance Explained
In this part of the study, minimum numbers of factors that account for the maximum portion of variance from the original variables are identified. We will use the criteria of Eigen value for extracting minimum factors from 9 variables. The Eigen value for a given factor demarcates the variance in all the variables which is justified by that factor. The ratio of Eigen value is the ratio of explanatory importance of different factors with respect to the variables. If a factor has a low Eigen value, then it is contributing little to the explanation of variances in the variables and may be considered as inessential with more important factors. Eigen Values demarcates the amount of variance in the total sample accounted for each factor.
Table 5
Total Variance Explained Comp
onent
Initial Eigen Values Extraction Sums of Squared Loadings Rotation Sums of Squared Loadings
Total % of
Variance
Cumulative %
Total % of
Variance
Cumulative %
Total % of
Variance
Cumulative %
1 3.522 39.129 39.129 3.522 39.129 39.129 2.697 29.967 29.967
2 1.233 13.698 52.827 1.233 13.698 52.827 1.761 19.568 49.535
3 1.005 11.165 63.991 1.005 11.165 63.991 1.301 14.457 63.991
4 .811 9.009 73.001
5 .590 6.554 79.555
6 .532 5.913 85.468
7 .489 5.430 90.897
8 .439 4.881 95.778
9 .380 4.222 100.000
Source: Extraction Method using Principal Component Analysis
Available online: https://edupediapublications.org/journals/index.php/IJR/ P a g e | 3467 Component Analysis so the Initial Eigen Values
and Extraction Sums of Squared loadings are the same. But the values of Rotation Sums of Squared Loadings will differ from Initial and Extracted Eigen Values as this column represents the Eigen
Value and Variance after Rotation though their cumulative variance for the last extracted factor which will be the same. In the present study three factors have been extracted from all the 9 variables that are depicting an impact on women empowerment. These three factors have the Eigen value greater than 1 and account a cumulative variance of 63.991%. It is also presented in the table that 1st to 3rd factors accounted for 29.967%,
19.568 and 14.457% of variance respectively. Remaining variable have the Eigen value less than 1 and have a very low percentage of variance so they are not significant for further analysis.
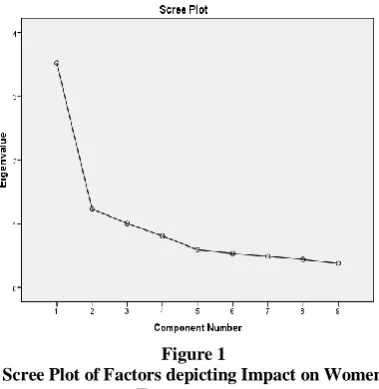
7. Scree Plot
In Principal Component Analysis, Scree Plot graphically represents those factors or components that explain most of the variability in the data. With the help of Scree Plot only those factors or components are retained that are on steep curve before the first point that starts the flat line trend.
Basically the Eigen values of all the variables are shown in a graphical form under a Scree Plot.
Figure 1
Scree Plot of Factors depicting Impact on Women Empowerment
Figure 1 presents the Eigen values of all the variables that are causing an impact on women empowerment and shows that three factors out of the total nine variables explain most of the variability as they are on steep curve and the
remaining Eigen values less than 1 makes the curve more flatten as they explains a very small portion of the variability and hence insignificant.
8. Rotated Component Matrix
With the help of Rotated Component Matrix those variables are examined that are attributed to a particular factor. Extracted factors with the different factors loadings are the key output of Principal Component Analysis. It represents the co-relation between each of the variable and the extracted factors. Varimax Rotation has been used to identify each variable with a single factor having a high factor loading. The factor analysis has clubbed 9 variables into 3 main factors which have a significant factor loading.
Table 6
Rotated Component Matrix
Variables Components
1 2 3
Increased Share in Family Employment/ Economic activities have been pursued
.782 .116 .096
Share in total household Savings has increased
.770 .045 .136
There is now Recognition in family/Involvement in decision making
.755 .301 .092
There is ownership in assets jointly with males
.646 .181 .281
There are lesser incidents of domestic violence
.630 .404 .011
There is Social Recognition
.186 .864 .034
There is improvement in social status
.230 .836 .082
Confidence Level has increased
.037 .029 .827
It has lead to
development of skills and abilities/talents
.139 .107 .703
Source: Primary Data
Extraction Method: Principal Component Analysis Rotation Method: Varimax with Kaiser Normalization
With the help of Rotated Component Matrix following factors have been extracted:
Available online: https://edupediapublications.org/journals/index.php/IJR/ P a g e | 3468 It can be analysed from Table 6 that the factor
of Empowerment at Household Level has emerged as a key factor in empowering women with the variable of Share in Family Employment having the highest loading factor of 0.782. Other variables loaded under this factor are: Share in Household Savings (factor loading 0.770), Recognition in Family/Participation in decision making (factor loading 0.755), Ownership in Assets with males (factor loading 0.646) and Lesser Incidents of Domestic Violence (factor loading 0.630).
It can be observed from the above results that microcredit scheme through SHG’s has given women a greater role in household decision-making and increased their intra-household bargaining power. They have gained control over employment and economic resources. The economic self reliance has helped in lifting their status at the household level. It was also observed during the study that women could decide on spending their own income and thus having greater control over finances. Married women in backward areas are also subject to domestic violence and are dominated by their husbands in respect of financial matters. In this context microfinance programme is playing a great role in empowering women by providing them an opportunity to participate in economic activities, thereby reducing the frequency of domestic violence against them.
Factor 2 Empowerment at Community Level
The second factor of Empowerment at Community Level is another area of women empowerment. Under this factor two variables of social recognition (factor loading 0.864) and improvement in social status (factor loading 0.836) are loaded. Thus, it can be inferred that women have gained respect and recognition in society. Their social status has improved and their interaction with members of the community has also increased. It has also been observed that participation of women in political field has also increased. In 1991, constitutional provision for 33 percent reservation for women in the number of seats in Gram Panchayats in our country came into effect. In the beginning, the process of participation of women in political sphere was slow. Gradually, their participation in social and political process started increasing. Involvement of women in economic activities brings a change in perception and shift in attitude of society towards women in general.
Factor 3 Empowerment at Personal Level
In India, men tend to dominate political and community decisions. Women also remain excluded because of their preoccupation with household duties. It has been observed that even when women become members of committees, men still tend to dominate. As women are an important part of the community, empowering them is essential. One measure by which this can be achieved is by assigning specific responsibilities to women’s groups like the SHG’s.
Empowerment at Personal Level is another major area affecting women empowerment. Increased level of confidence (factor loading 0.827) has emerged as a key variable under this factor. The second variable loaded under this factor is development of skills and abilities (factor loading 0.703). It can be observed in the above analysis that microfinance schemes have been instrumental in creating general awareness, capacity building, self-confidence and courage among women. This can be translated into empowerment at personal level. The women have gained self-confidence and can speak freely in front of large groups of people. These schemes have also helped them in improving access to information which has had a positive impact on their self-worth and personal enrichment. It has also provided them an opportunity to improve their hidden talents. One of the major reasons behind this is the exposure of women to training on issues like women’s rights, social and political issues and skill development.
It can be concluded from the above discussion that microfinance through SHGs has made a lasting impact on the lives of women. Empowerment is reflected in women’s elevated status within the household, community and village, and at personal and political level. This has enhanced the status of women as participants, decision-makers, and beneficiaries in the democratic, economic, social and cultural spheres of life.
9. Descriptive Statistics
In this part, the impact level of various variables on women empowerment is studied by showing the value of sample mean and standard deviation of each variable. Following rules are applied to know the impact level of various variables.
Mean values which are less than 1.5 shows that the variables have a very low impact.
Available online: https://edupediapublications.org/journals/index.php/IJR/ P a g e | 3469 Mean values ranging from 2.5 to 3.5
shows that the variables have a moderate impact.
Mean values from 3.5 to 4.5 shows that the variables have a high impact.
Mean values more than 4.5 shows that the variables have a very high impact.
Table 7 Descriptive Statistics
Sr. No.
Variables Mean Standard
Deviation 1 Increased Share in
Family Employment/ Economic activities have been pursued
3.77 .965
2 Share in total household Savings has increased
3.69 .881
3 There is now Recognition in family/Involvement in decision making
3.53 .884
4 There is ownership in assets jointly with males
3.70 .821
5 There are lesser incidents of domestic violence
3.09 1.090
6 There is Social
Recognition 4.01 .872 7 There is
improvement in social status
3.93 .969
8 Confidence Level
has increased 3.66 .893 9 It has lead to
development of skills and abilities/talents
3.17 .959
Source: Primary Probe
Present analysis has been designed to study the factors which cause an impact on women empowerment. The descriptive statistics of the different variables causing an impact on the participants has been presented in Table 7 In the first factor i.e. Empowerment at Household Level, the variable of share in family employment has the highest impact level with Mean Value of 3.77 and standard deviation of 0.965. All other remaining variables i.e inclusion in decision making process, share in household savings, ownership in assets jointly with males and decrease in incidents of domestic violence have the Mean values of 3.53, 3.69, 3.70, and 3.09 respectively. In this factor four
variables showed high impact and one variable showed moderate impact of microfinance. This is an indication that membership in SHGs benefit women by empowering them economically which helps a great deal in uplifting their status within the household. In the second factor i.e Empowerment at Community Level, the variable of social recognition has the highest impact level with a Mean value of 4.01 and standard deviation of 0.872. This indicates that exposure of women to SHG working makes them socially recognized. The other variable i.e improvement in social status has a Mean value of 3.93 and standard deviation of 0.969. This again indicates a high impact of microfinance in uplifting the social status of women. In the third factor i.e Empowerment at Personal Level, three variables namely increased confidence level, development of skills and abilities and increased knowledge and awareness are included. The variable of increased confidence level has the highest impact level with Mean Value of 3.66 and standard deviation of 0.893 showing a high impact. The other two variables have the mean values of 3.17 and 3.13 which show a moderate impact of microfinance on development of skills and abilities and increase in knowledge and awareness. From the above study it is concluded that the overall impact of microfinance on empowerment of women is either high or moderate.
Our results bring out the significance of microfinance schemes in empowering women. For this purpose factor analysis has been proved useful in extracting the three significant factors/areas of women empowerment from a total of nine variables. The analysis revealed that the impact is more significant in the area of empowerment at household level. This is an indication that membership in SHGs benefit women by empowering them economically which helps a great deal in uplifting their status within the household. The role of SHGs in empowering women in also prominent in uplifting their status in the community and in their personal development by creating awareness and exposing them to training programmes. It can, therefore, be concluded from the above analysis that microfinance through SHGs has made a lasting impact on the lives of women. Empowerment is reflected in women’s elevated status within the household, community and village. This has enhanced the status of women as participants, decision-makers, and beneficiaries in the economic, social, cultural and political spheres of life.
Available online: https://edupediapublications.org/journals/index.php/IJR/ P a g e | 3470 changes in the living standards of SHG members
have taken place in terms of increase in income levels, asset building, savings, borrowing capacity and income generating activities[2]. It has been observed that the overall impact of micro-financing is effective in combating poverty, unemployment and empowerment of women.
References
[1] Khander, Shahidur R. (1995). Fighting Poverty with Micro credit: Experience in Bangladesh, London: Oxford University Press.
[2] Sharma, K.C. (2001). Micro Financing through Self Help Groups, Indian Journal of Agricultural Economics, Vol. 56(3), 460-61.
[3] Hair, J., Anderson, R., Tatham, R. and Black, W. (1995). Multivariate Data Analysis. 4th Edition, New
Jersey, Prentice-Hall Inc.
[4] Tabach, B.G. and Fidell, L.S.(2007). Using Multivariate Statistics. Boston, Pearson Education Inc.
[5] Yong, A.G. and Pearce, S.(2013). A Beginner’s Guide to Factor Analysis: Focusing on Exploratory Factor Analysis. Tutorials in Quantitative Methods for Psychology, 9(2), 79-94.
[6] Jothi, V.N., (2010). Socio-economic Impact: Micro financing of Self Help Groups. SCMS Journal of Indian Management, January-March, pp.91-103.